

Fully Automated Sample Processing and Analysis Workflow for Low-Input Proteome Profiling
- PMID: 33352054
- PMCID: PMC8140400
- DOI: 10.1021/acs.analchem.0c04240
Fully Automated Sample Processing and Analysis Workflow for Low-Input Proteome Profiling
Erratum in
-
Correction to Fully Automated Sample Processing and Analysis Workflow for Low-Input Proteome Profiling.Anal Chem. 2021 Apr 6;93(13):5651. doi: 10.1021/acs.analchem.1c01152. Epub 2021 Mar 24. Anal Chem. 2021. PMID: 33761238 No abstract available.
Abstract
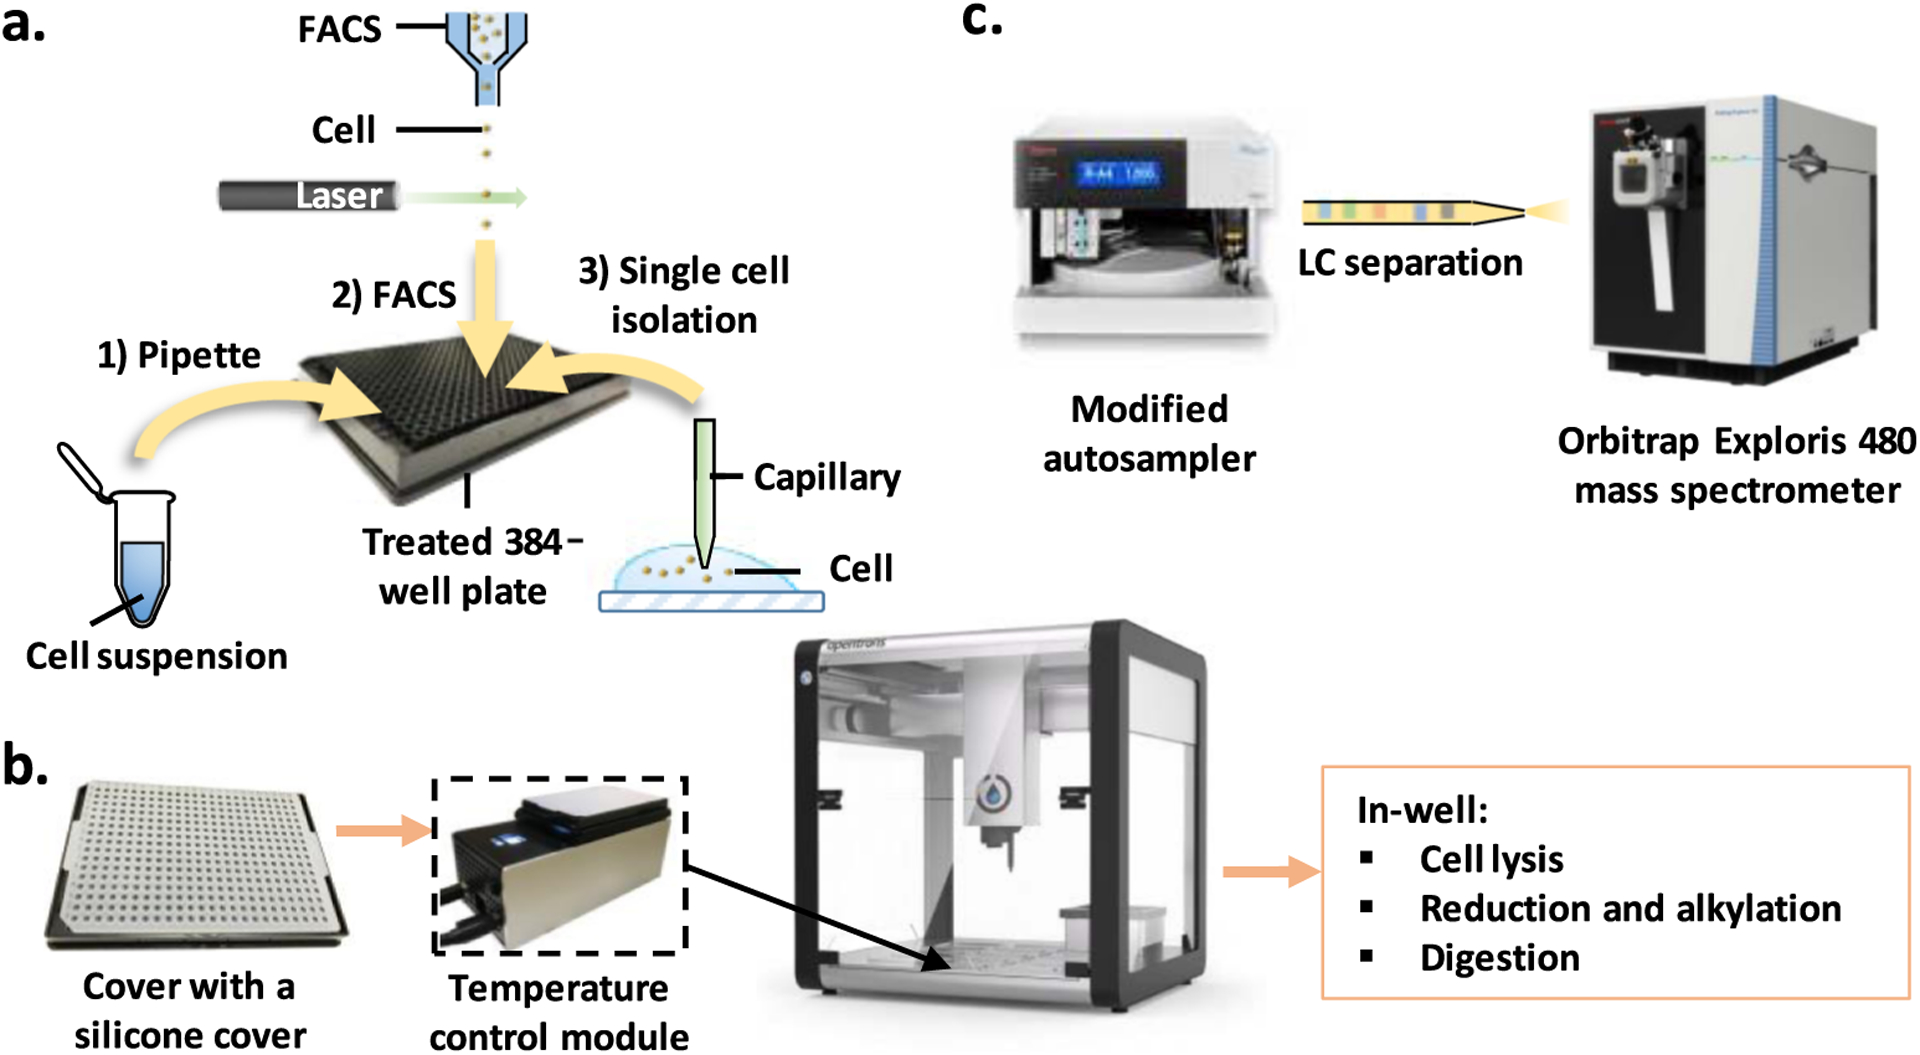
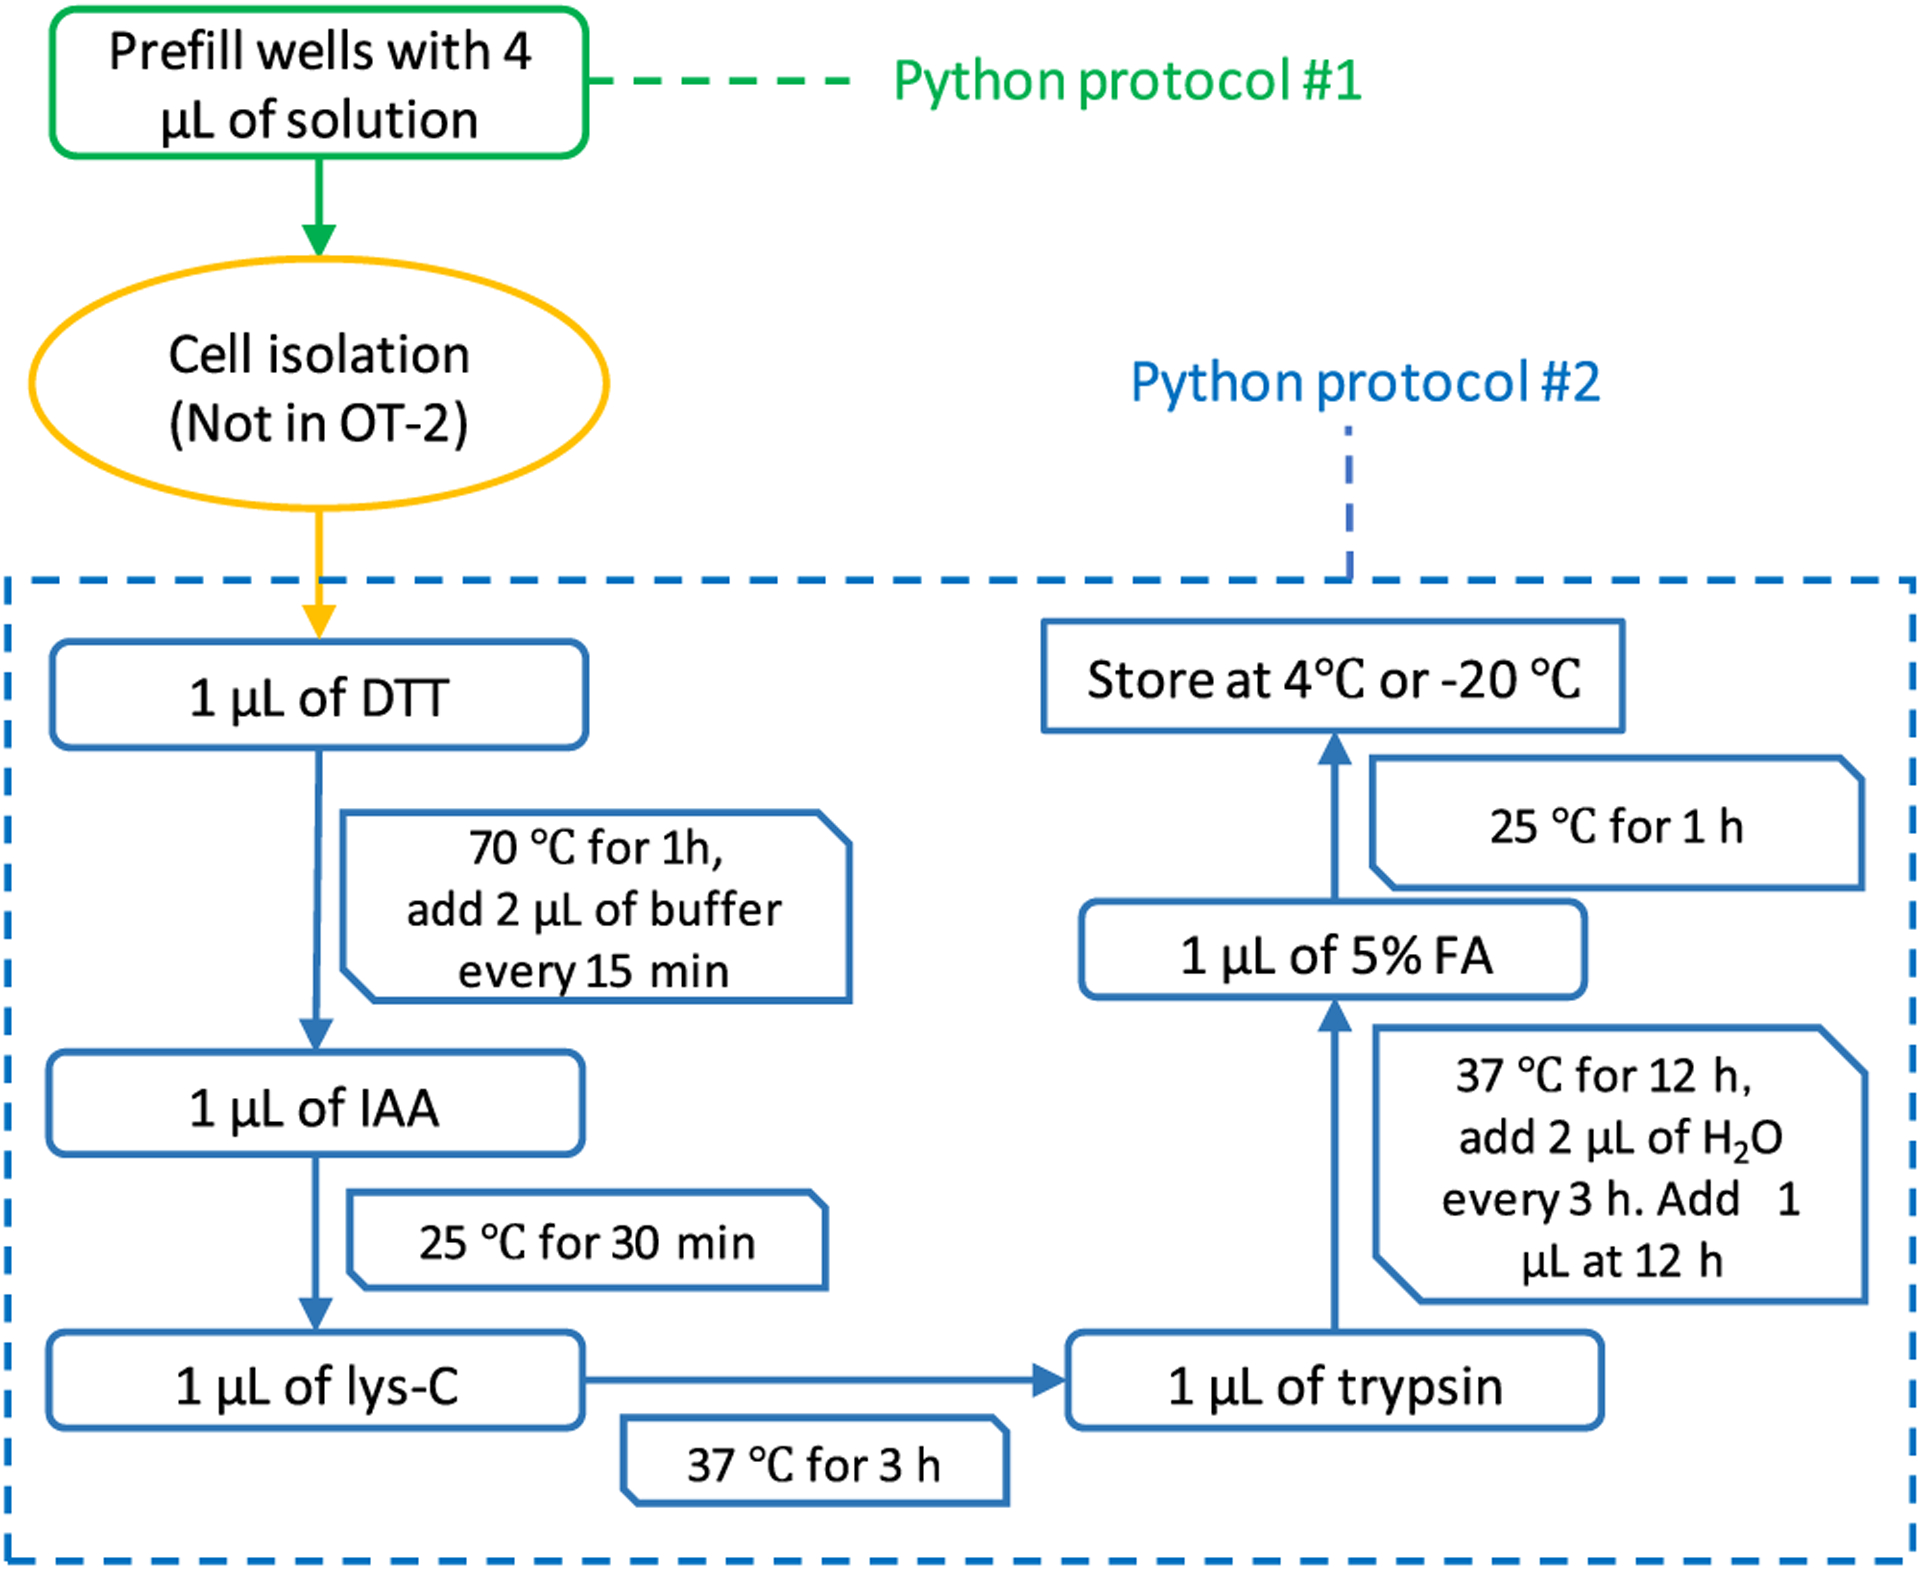
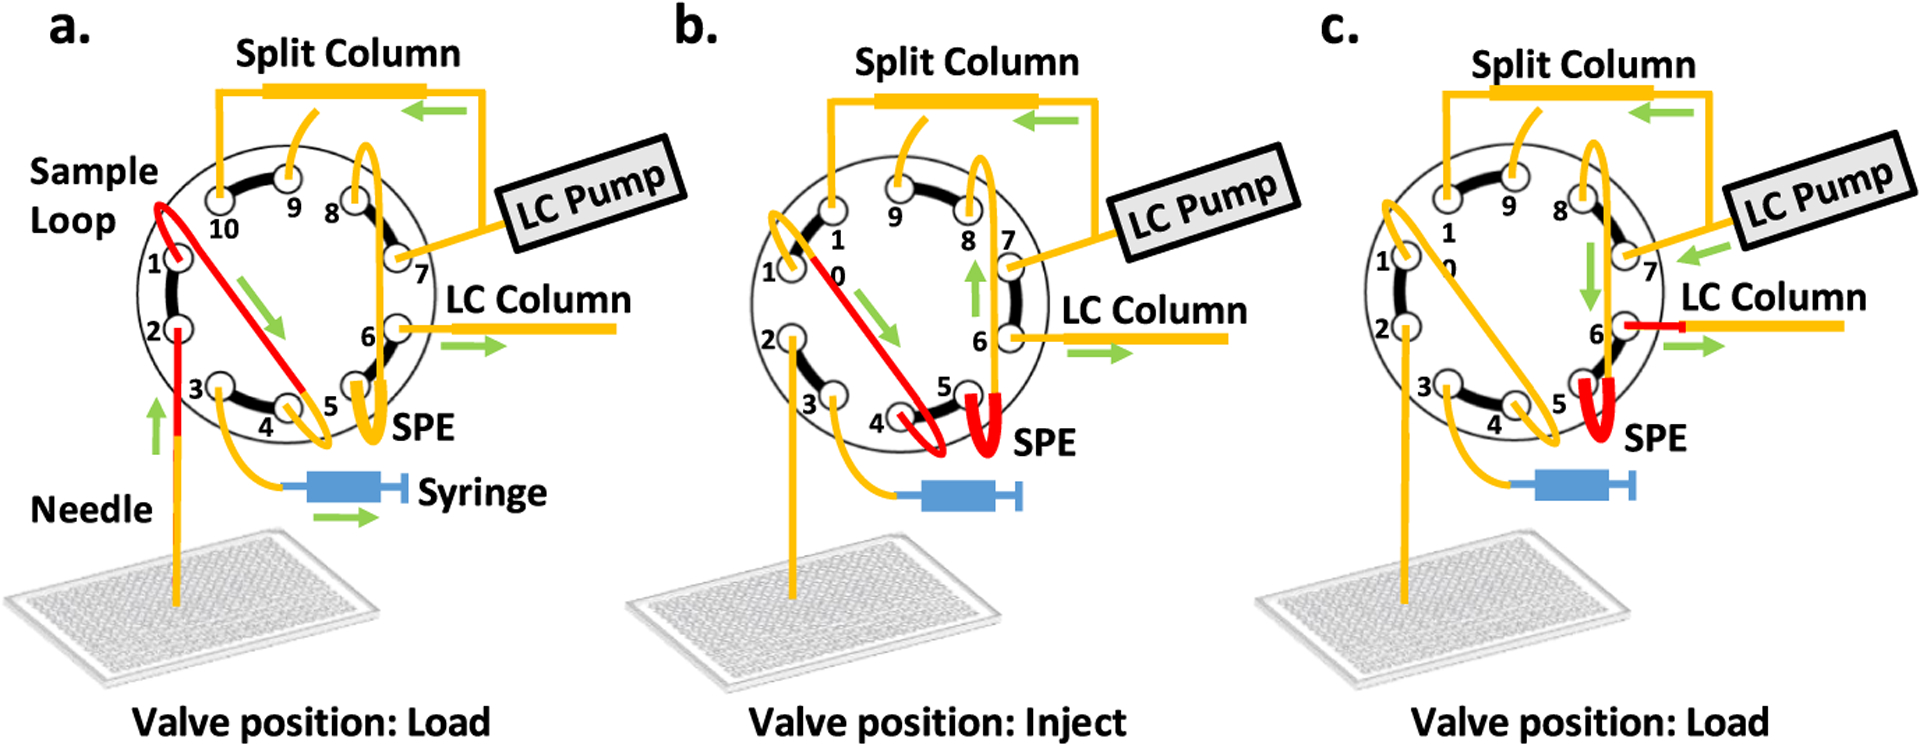
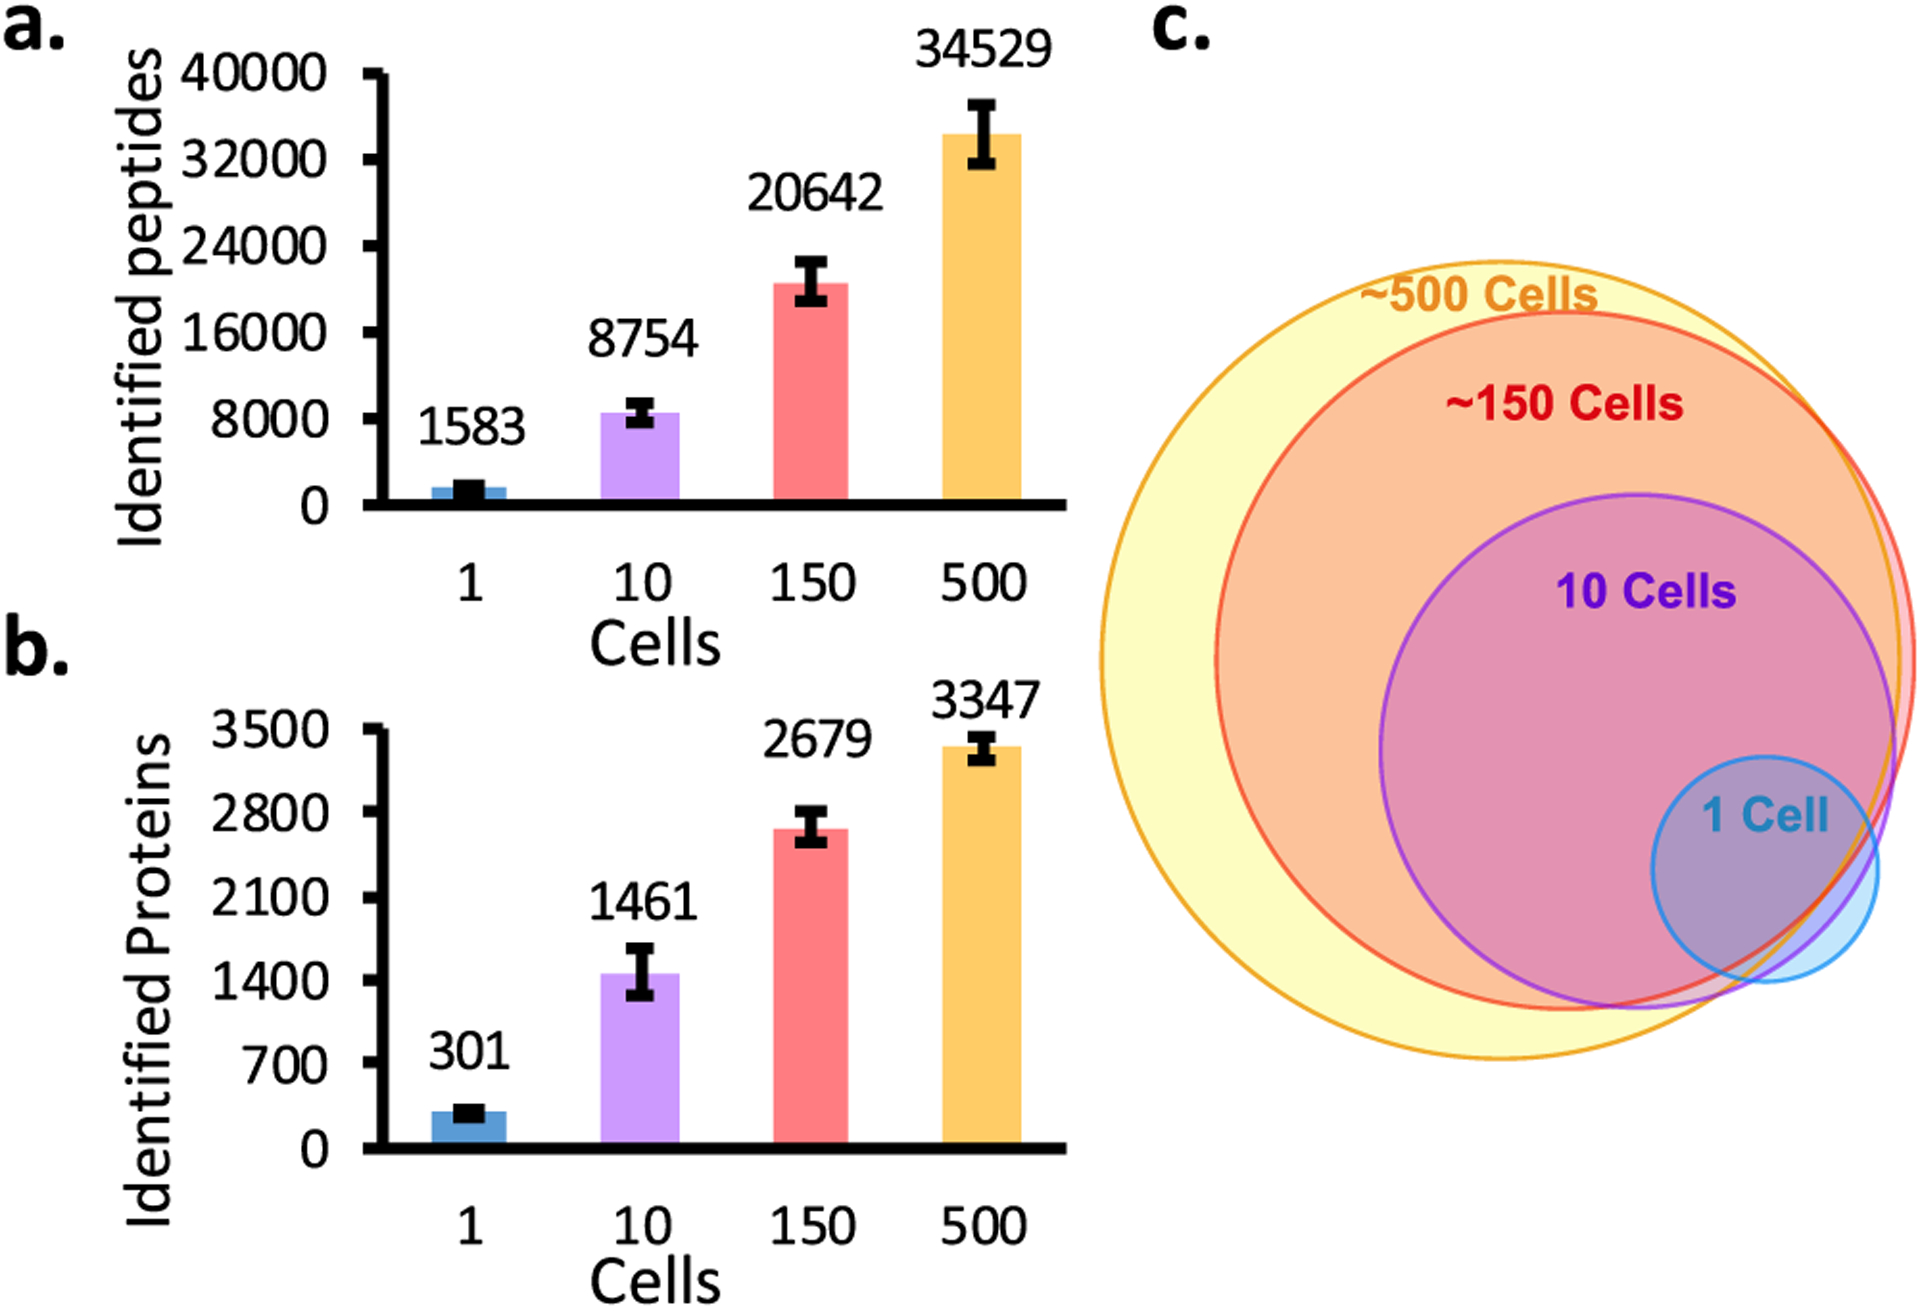
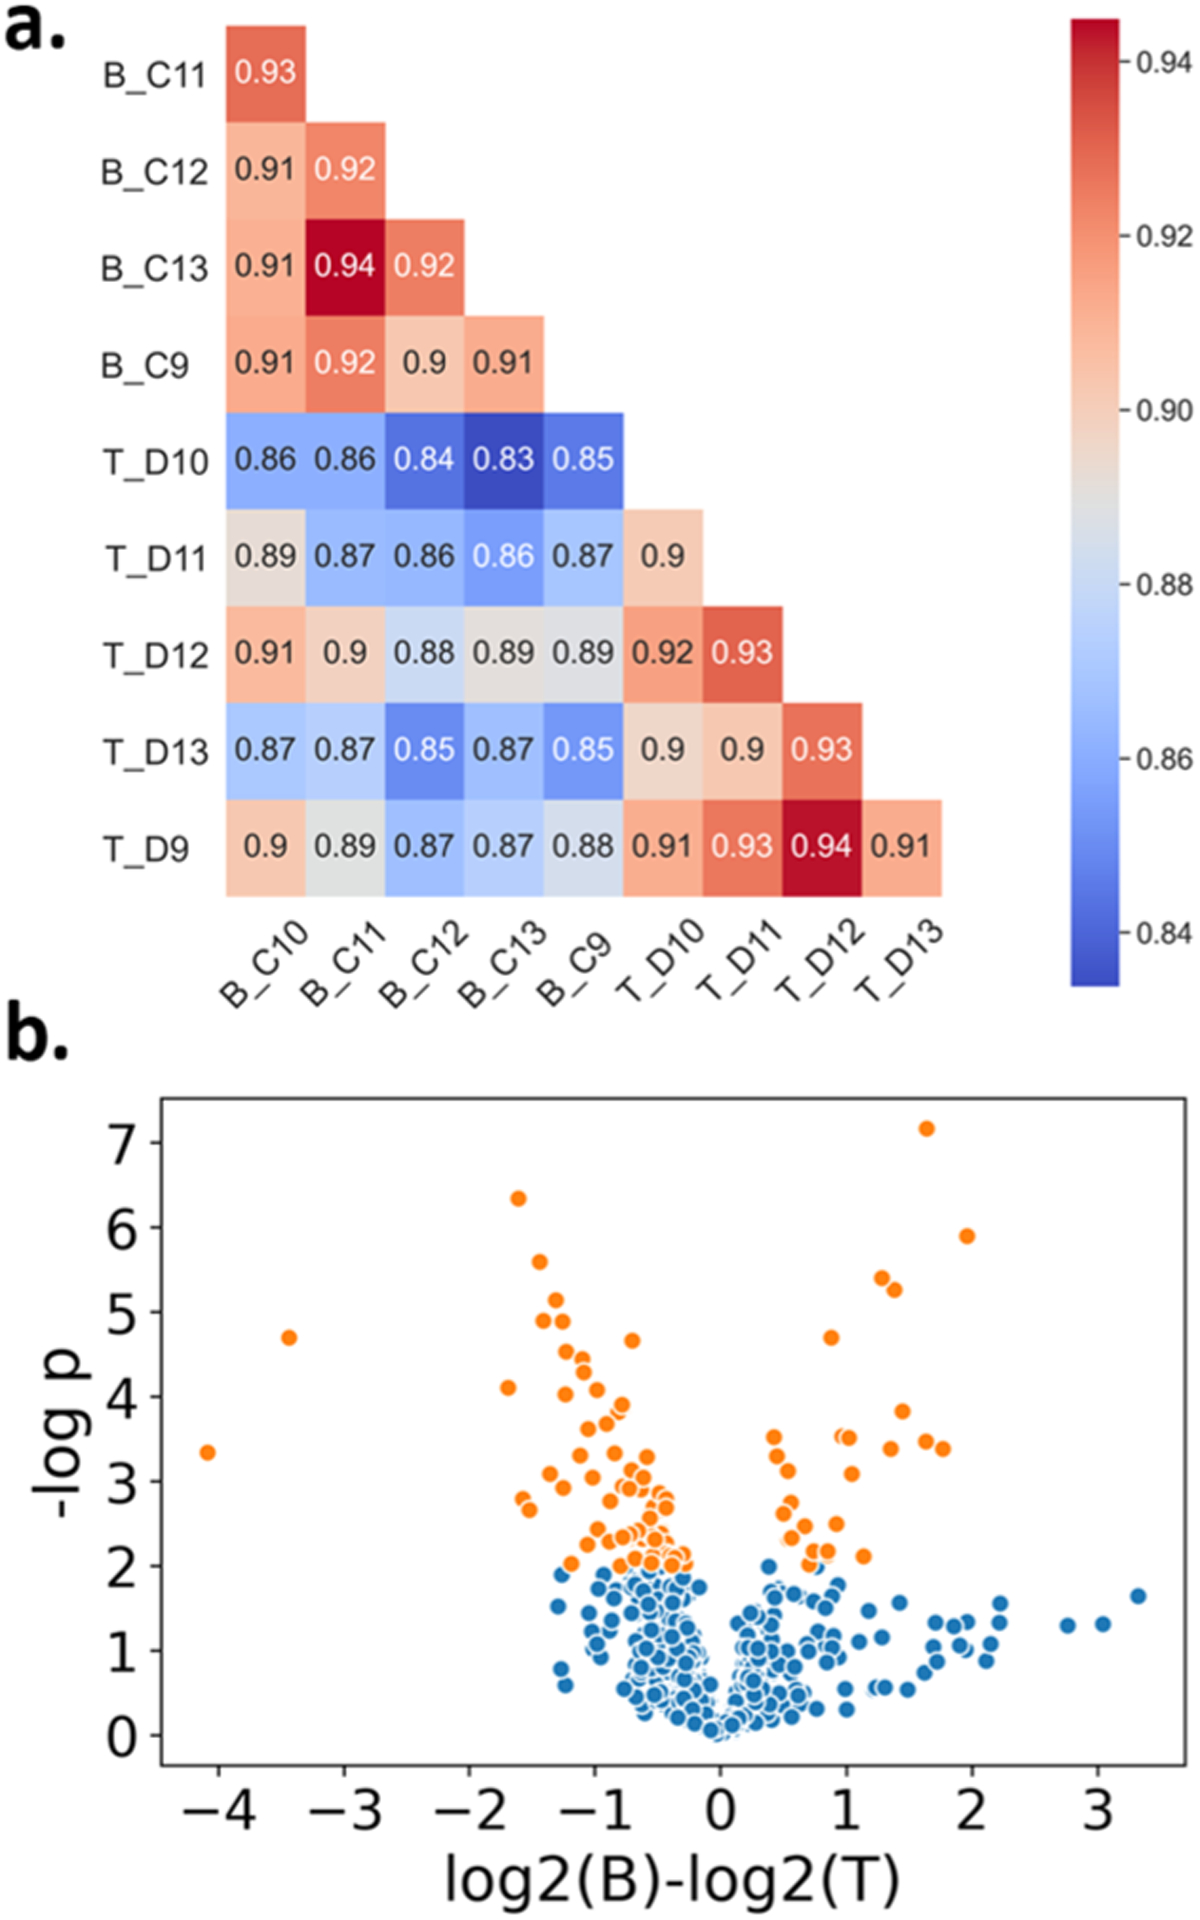
Recent advances in sample preparation and analysis have enabled direct profiling of protein expression in single mammalian cells and other trace samples. Several techniques to prepare and analyze low-input samples employ custom fluidics for nanoliter sample processing and manual sample injection onto a specialized separation column. While being effective, these highly specialized systems require significant expertise to fabricate and operate, which has greatly limited implementation in most proteomic laboratories. Here, we report a fully automated platform termed autoPOTS (automated preparation in one pot for trace samples) that uses only commercially available instrumentation for sample processing and analysis. An unmodified, low-cost commercial robotic pipetting platform was utilized for one-pot sample preparation. We used low-volume 384-well plates and periodically added water or buffer to the microwells to compensate for limited evaporation during sample incubation. Prepared samples were analyzed directly from the well plate with a commercial autosampler that was modified with a 10-port valve for compatibility with 30 μm i.d. nanoLC columns. We used autoPOTS to analyze 1-500 HeLa cells and observed only a moderate reduction in peptide coverage for 150 cells and a 24% reduction in coverage for single cells compared to our previously developed nanoPOTS platform. To evaluate clinical feasibility, we identified an average of 1095 protein groups from ∼130 sorted B or T lymphocytes. We anticipate that the straightforward implementation of autoPOTS will make it an attractive option for low-input and single-cell proteomics in many laboratories.
Conflict of interest statement
The authors declare no competing financial interest.
Figures
References
-
- Wiśniewski JR; Zougman A; Nagaraj N; Mann M Nat. Methods 2009, 6, 359–362. - PubMed
Publication types
MeSH terms
Substances
Grants and funding
LinkOut - more resources
Full Text Sources
