

Estimating the burden of COVID-19 on the Australian healthcare workers and health system during the first six months of the pandemic
- PMID: 33352440
- PMCID: PMC7598370
- DOI: 10.1016/j.ijnurstu.2020.103811
Estimating the burden of COVID-19 on the Australian healthcare workers and health system during the first six months of the pandemic
Erratum in
-
Erratum to "Estimating the burden of COVID-19 on the Australian healthcare workers and health system during the first six months of the pandemic" [International Journal of Nursing Studies, 114 (2021), 103811].Int J Nurs Stud. 2021 Sep;121:104031. doi: 10.1016/j.ijnurstu.2021.104031. Epub 2021 Jul 21. Int J Nurs Stud. 2021. PMID: 34301404 Free PMC article. No abstract available.
Abstract
Introduction: There are no publicly available national data on healthcare worker infections in Australia. It has been documented in many countries that healthcare workers (HCW) are at increased occupational risk of COVID-19. We aimed to estimate the burden of COVID-19 on Australia HCW and the health system by obtaining and organizing data on HCW infections, analyzing national HCW cases in regards to occupational risk and analyzing healthcare outbreak.
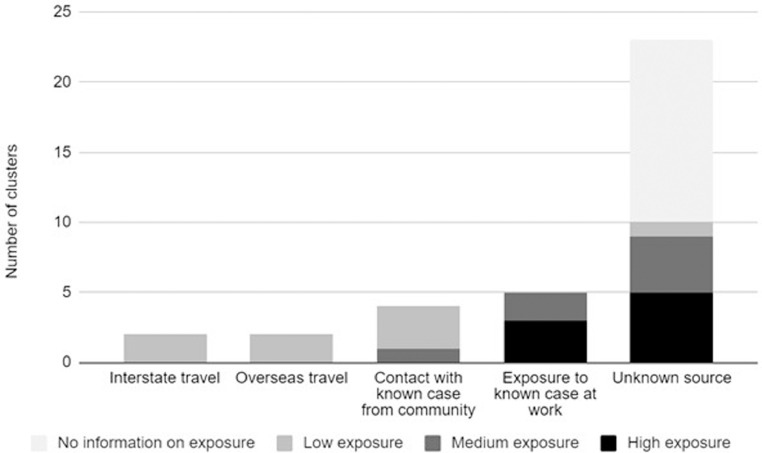
Methods: We searched government reports and websites and media reports to create a comprehensive line listing of Australian HCW infections and nosocomial outbreaks between January 25th and July 8th, 2020. A line list of HCW related COVID-19 reported cases was created and enhanced by matching data extracted from media reports of healthcare related COVID-19 relevant outbreaks and reports, using matching criteria. Rates of infections and odds ratios (ORs) for HCW were calculated per state, by comparing overall cases to HCW cases. To investigate the sources of infection amongst HCW, transmission data were collated and graphed to show distribution of sources.
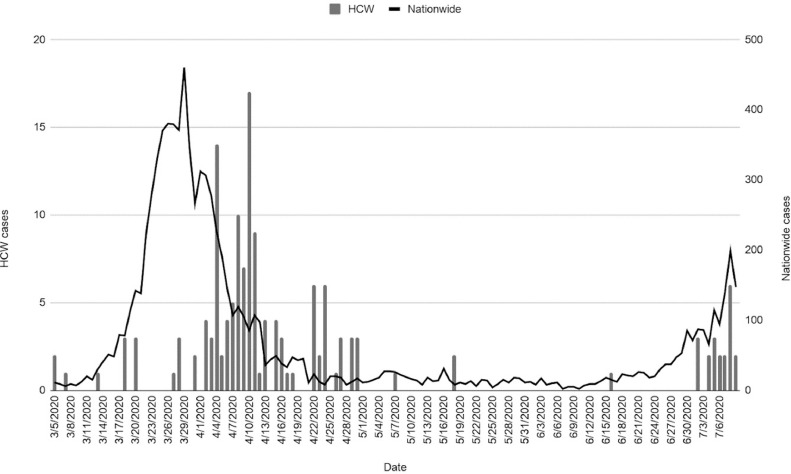
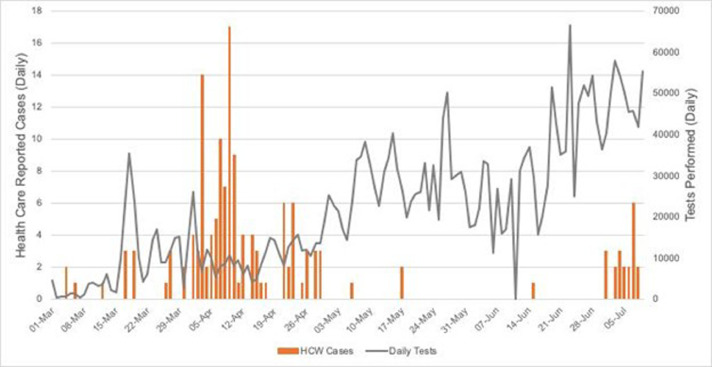
Results: We identified 36 hospital outbreaks or HCW infection reports between January 25th and July 8th, 2020. According to our estimates, at least 536 HCW in Australia had been infected with COVID-19, comprising 6.03% of all reported infections. The rate of HCW infection was 90/100000 and of community infection 34/100,000. HCW were 2.69 times more likely to contract COVID-19 (95% CI 2.48 to 2.93; P < 0.001). The timing of hospital outbreaks did not always correspond to community peaks. Where data were available, a total of 131 HCW across 21 outbreaks led to 1656 HCW being furloughed for quarantine. In one outbreak, one hospital was closed and 1200 HCW quarantined.
Conclusion: The study shows that HCW were at nearly 3 times the risk of infection. Of concern, this nearly tripling of risk occurred during a period of low community prevalence suggesting failures at multiple hazard levels including PPE policies within the work environment. Even in a country with relatively good control of COVID-19, HCW are at greater risk of infection than the general community and nosocomial outbreaks can have substantial effects on workforce capacity by the quarantine of numerous HCW during an outbreak. The occurrence of hospital outbreaks even when community incidence was low highlights the high risk setting that hospitals present. Australia faced a resurgence of COVID-19 after the study period, with multiple hospital outbreaks. We recommend formal reporting of HCW infections, testing protocols for nosocomial outbreaks, cohorting of workforce to minimize the impact, and improved PPE guidelines to provide precautionary and optimal protection for HCW.
Keywords: COVID-19; Healthcare worker; Healthcare worker infections; Occupational risk.
Copyright © 2020. Published by Elsevier Ltd.
Conflict of interest statement
Declaration of Competing Interest None.
Figures
References
-
- ABC News. Tasmania Closes Two Hospitals to “Stamp Out” Coronavirus Outbreak in the North-West Key Points. https://www.abc.net.au/news/2020-04-12/tasmania-to-close-two-hospitals-d.... Published 2020. Accessed June 12, 2020.
-
- ACT Government. ACT government: COVID-19. https://www.covid19.act.gov.au/. Published 2020. Accessed July 10, 2020.
-
- AHPRA & National Boards. Pandemic response sub-register. https://www.ahpra.gov.au/News/COVID-19/Pandemic-response-sub-register.aspx. Published 2020. Accessed May 25, 2020.
-
- Aubusson B.K. The Sydney Morning Herald; 2020. Coronavirus Clusters Pervade Australian Hospital Wards.https://www.smh.com.au/national/coronavirus-clusters-pervade-australian-... Published Accessed June 12, 2020.
-
- Australian Government Department of Health . Infection Control Expert Group (ICEG); 2020. Guidance on the Use of Personal Protective Equipment (PPE) in Hospitals During the COVID-19 Outbreak.https://www.health.gov.au/sites/default/files/documents/2020/07/guidance... Published Accessed July 12, 2020.
MeSH terms
LinkOut - more resources
Full Text Sources
Other Literature Sources
Medical
