. 2020 Dec 19;21(24):9722.
doi: 10.3390/ijms21249722.

3D Reconstruction of Hv RNASET2 Molecule to Understand Its Antibacterial Role

Affiliations

3D Reconstruction of Hv RNASET2 Molecule to Understand Its Antibacterial Role

Nicolò Baranzini et al. Int J Mol Sci. .

Abstract

Recent studies performed on the invertebrate model Hirudo verbana (medicinal leech) suggest that the T2 ribonucleic enzyme HvRNASET2 modulates the leech's innate immune response, promoting microbial agglutination and supporting phagocytic cells recruitment in challenged tissues. Indeed, following injection of both lipoteichoic acid (LTA) and Staphylococcus aureus in the leech body wall, HvRNASET2 is expressed by leech type I granulocytes and induces bacterial aggregation to aid macrophage phagocytosis. Here, we investigate the HvRNASET2 antimicrobial role, in particular assessing the effects on the Gram-negative bacteria Escherichia coli. For this purpose, starting from the three-dimensional molecule reconstruction and in silico analyses, the antibacterial activity was evaluated both in vitro and in vivo. The changes induced in treated bacteria, such as agglutination and alteration in wall integrity, were observed by means of light, transmission and scanning electron microscopy. Moreover, immunogold, AMPs (antimicrobial peptides) and lipopolysaccharide (LPS) binding assays were carried out to evaluate HvRNASET2 interaction with the microbial envelopes and the ensuing ability to affect microbial viability. Finally, in vivo experiments confirmed that HvRNASET2 promotes a more rapid phagocytosis of bacterial aggregates by macrophages, representing a novel molecule for counteracting pathogen infections and developing alternative solutions to improve human health.

Keywords: 3D reconstruction of HvRNASET2; LPS; antimicrobial activity; innate immunity; medicinal leech.


Conflict of interest statement

The authors declare no conflict of interest.

Figures
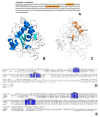
Figure 1
Figure 1
HvRNASET2 bioinformatic characterization. (A) HvRNASET2 (accession number: AYQ58237.1) amino acid sequence. In the N-terminal region, the underlined residues identify the signal peptide, and the two conserved active sites (CAS) are underscored in bright orange. (B,C) Secondary HvRNASET2 three-dimensional structure, predicted with I-TASSER. The β-strands and α-helix that composed the secondary structure are represented in cyan and blue (B). The CAS I and CAS II domains, reported in bright orange (C), are specifically located on the β2-strand and α3-helix, respectively. (D,E) Multiple sequence alignments. The H. verbana HvRNASET2 amino acid sequence was aligned either with those of the well-studied A. niger ACTIBIND and human RNASET2 enzymes (D) or with T. curvispinus (Arthropoda), H. vulgaris (Cnidaria) and C. gigas (Mollusca) (E) invertebrate T2 RNases. Both the CAS I and CAS II domains are extremely well conserved, and different blue shades identify the distinct conservation of each specific amino acid.
Figure 2
Figure 2
Antimicrobial peptide identification. (A) The HvRNASET2 primary sequence was analyzed with the AMPA software [13] in order to identify possible antimicrobial peptides, and a specific sequence of amino acids (QVLKMRIHNKNNTNTFT), underscored in orange, was detected in the C-terminal region. (B,C) Three-dimensional representations of the detected peptide are displayed in orange. Of note, it is arranged on the outer surface (B) and in the C-terminal region (NQMNQIHSNS) (C) of the enzyme.
Figure 3
Figure 3
Optical and TEM morphological analyses. (AF) E. coli incubated with PBS (AC) or rHvRNASET2 (DF) were assessed by optical microscope after 3 (A,D), 24 (B,E) and 48 h (C,F) from the incubation. The bacterial distribution was dense, and microorganisms appeared closer after rHvRNASET2 treatment (DF) compared to PBS control samples (AC). (GL) E. coli incubated with PBS (GI) or rHvRNASET2 (JL) analyzed with TEM. After 3 (G,J), 24 (H,K) and 48 h (I,L) from incubation, in control samples, cells maintained their typical shape (GI), while after incubation with rHvRNASET2, they were clearly agglutinated and suffering (JL). Indeed, bacterial membranes appear damaged (arrowheads), and the cytoplasmatic content was released in the surrounded environment (arrows). Scale bars: (AF) 10 µm; (GL) 2 µm.
Figure 4
Figure 4
SEM and immunogold analyses. (AC) With SEM, E. coli treated with PBS were randomly distributed on the analyzed surfaces, after 3 h (A), 24 h (B) and 48 h (C). (DG) However, the incubation with rHvRNASET2 induced a strong bacterial agglutination already 3 h after treatment (D). Moreover, in particular after 24 h (E) and 48 h (F,G) from incubation, bacterial aggregates were clearly visible, and cell membranes appeared damaged (F) (arrowheads), releasing the cytoplasmatic content into the external environment (G) (arrows). (HJ) Immunogold at TEM. Immunogold assays, performed 3 h after incubation, indicate that rHvRNASET2 is specifically located on the E. coli outer bacterial surface (I,I’) (arrowheads). No signals were detected in PBS samples (H) or in negative control experiments (J), in which the primary antibody was omitted. In particular (I’), many gold particles were detectable, suggesting the direct interaction of HvRNASET2 with bacterial cell components (arrow). Scale bars: (AC,F) 2 µm; (D) 50 µm; (E) 5 µm; (G) 1 µm; (H–J) 0.5 µm; (I’) 100 nm.
Figure 5
Figure 5
Antimicrobial in vitro assay. The graph illustrates the cellular viability of E. coli after 24 h of rHvRNASET2 treatment. Untreated cells were used as control. Experiments were performed in triplicate, and statistical differences were calculated by unpaired t-test. ***p < 0.001 indicates a significant difference with untreated samples.
Figure 6
Figure 6
In vivo experiments. (AC) E. coli alone injected in the leech body wall. Tissues were analyzed 3 h after treatment; bacterial cells appeared randomly distributed (arrowheads) and only a few resident cells (arrows) were detectable. (DF) E. coli were pre-incubated with PBS for 3, 24 and 48 h and injected into the leech body wall. Tissues were analyzed after 3 h of treatment, and microorganisms appeared randomly distributed (arrowheads) with few resident cells clearly visible (arrows). (GI) E. coli pre-incubated with rHvRNASET2 for 3, 24 and 48 h and subsequently injected into the leech body wall. Tissues were analyzed 3 h after treatment, and bacterial cells appeared extremely agglutinated. The microorganism aggregates were evident (arrowheads) for all times, and a larger number of endogenous leech cells were observed surrounding bacterial clusters (arrows). These data confirm the ability of HvRNASET2 in recruiting immune cells to the challenged area. Scale bars: (AI) 10 µm.
Figure 7
Figure 7
ACP assay. (AC) E. coli alone injected in the leech body wall and tissues were analyzed after 3 h from treatment. Several ACP+-activated macrophages were detected in the challenged area. These cells are recognizable by the intense cytoplasmatic lysosomial activity (arrows). (DF) E. coli were pre-incubated with PBS for 3 h, 24 h and 48 h and injected into the leech body wall. Tissues were analyzed 3 h after treatment, and the number of ACP+ presented cells (arrows) was quite similar to those observed when bacteria are injected alone. (GI) E. coli were pre-incubated with rHvRNASET2 for 3 h, 24 h and 48 h and subsequently injected into the leech body wall. Tissues were analyzed after 3 h from treatment, and many ACP+ macrophages are detected (arrows). (J) Graph showing the total positive ACP cells count. Means with different letters indicate a significant difference between treatments at different times. Experiments were performed in triplicate, and data represent mean values ± SD. Statistical analyses were performed using Statistica 7.0 software, and differences were calculated by one-way ANOVA followed by Tukey’s post hoc test. p < 0.05 was considered statistically significant. Scale bars: (AI) 100 µm. Different letters indicate statistically significant differences (p < 0.05).

Similar articles

References

    1. Sirijan S. Nitaya Indrawattana Mechanisms of antimicrobial resistance in Pasteurellaceae. BioMed Res. Int. 2016;2016:1–8. - PMC - PubMed
    1. Mukhopadhyay S., Bharath Prasad A.S., Mehta C.H., Nayak U.Y. Antimicrobial peptide polymers: No escape to ESKAPE pathogens—A review. World J. Microbiol. Biotechnol. 2020;36:1–14. doi: 10.1007/s11274-020-02907-1. - DOI - PMC - PubMed
    1. Mahlapuu M., Björn C., Ekblom J. Antimicrobial peptides as therapeutic agents: Opportunities and challenges. Crit. Rev. Biotechnol. 2020;40:978–992. doi: 10.1080/07388551.2020.1796576. - DOI - PubMed
    1. Irie M. Structure-Function Relationships of Acid Ribonucleases. Pharmacol. Ther. 1999;81:77–89. doi: 10.1016/S0163-7258(98)00035-7. - DOI - PubMed
    1. Deshpande R.A., Shankar V. Ribonucleases from T2 family. Crit. Rev. Microbiol. 2002;28:79–122. - PubMed

MeSH terms