. 2020 Dec 18;9(12):477.
doi: 10.3390/biology9120477.

Epidemic Dynamics via Wavelet Theory and Machine Learning with Applications to Covid-19

Affiliations

Epidemic Dynamics via Wavelet Theory and Machine Learning with Applications to Covid-19

Tô Tat Dat et al. Biology (Basel). .

Abstract

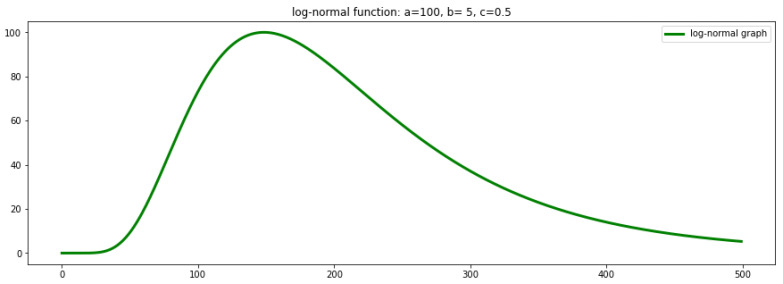
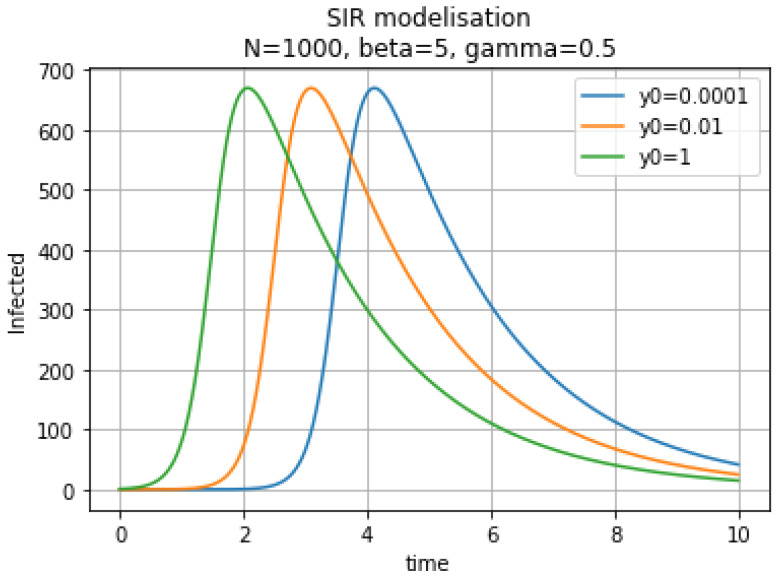
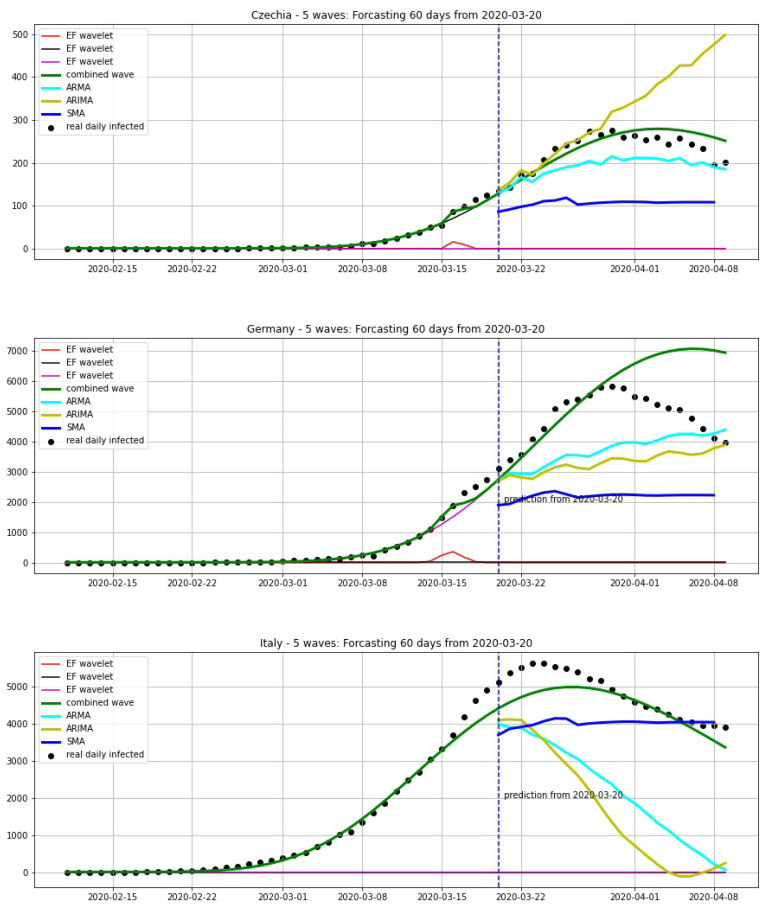
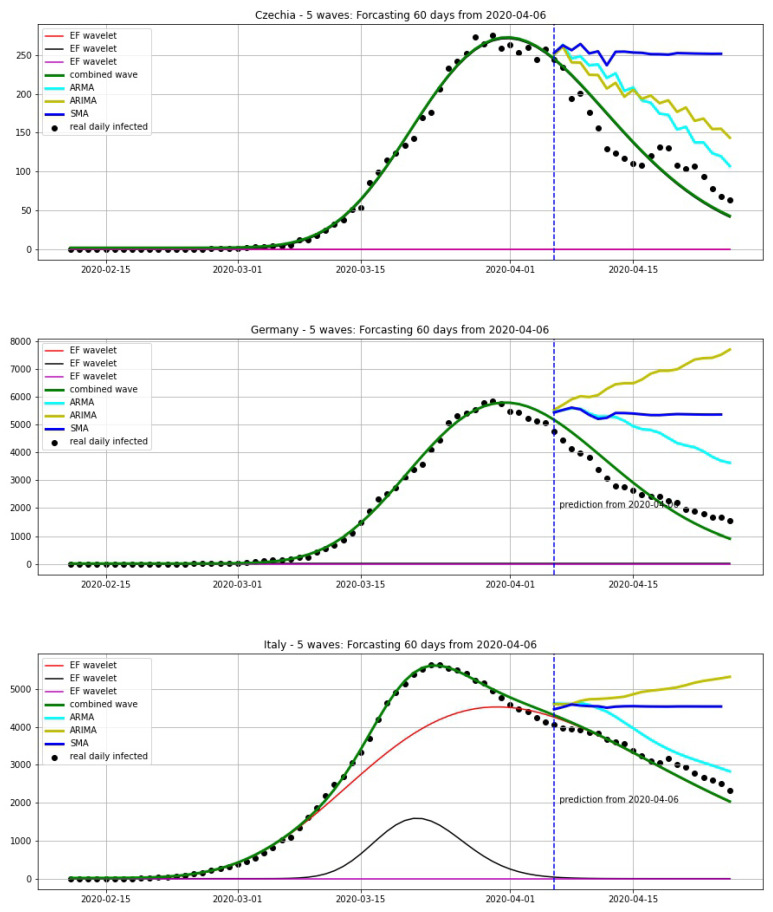
We introduce the concept of epidemic-fitted wavelets which comprise, in particular, as special cases the number I(t) of infectious individuals at time t in classical SIR models and their derivatives. We present a novel method for modelling epidemic dynamics by a model selection method using wavelet theory and, for its applications, machine learning-based curve fitting techniques. Our universal models are functions that are finite linear combinations of epidemic-fitted wavelets. We apply our method by modelling and forecasting, based on the Johns Hopkins University dataset, the spread of the current Covid-19 (SARS-CoV-2) epidemic in France, Germany, Italy and the Czech Republic, as well as in the US federal states New York and Florida.

Keywords: Covid-19; Covid-19 spread predicting; SARS-CoV-2; curve fitting; epidemic dynamics; epidemic-fitted wavelet; model selection.


Conflict of interest statement

The authors declare no conflict of interest.

Figures

Figure 1
Figure 1
Log-normal graph.
Figure 2
Figure 2
Infectious individuals I(t) for different initial conditions.
Figure 3
Figure 3
Czechia: fitting and forecasting (green curve) from 25 October with 5 wavelets. The green curve is the combination of other curves which are EF wavelets.
Figure 4
Figure 4
Czechia: fitting and forecasting from 19 October with 5 wavelets. The green curve is the combination of other curves which are EF wavelets.
Figure 5
Figure 5
France: fitting and forecasting from 25 October with 5 wavelets. Our model predicts a new wave starting from October 2020.
Figure 6
Figure 6
France: fitting and forecasting from 19 October with 5 wavelets. The green curve is the combination of other curves which are EF wavelets.
Figure 7
Figure 7
France: fitting and forecasting from 26/09 with 5 wavelets. The green curve is the combination of other curves which are EF wavelets.
Figure 8
Figure 8
Germany: fitting and forecasting from 25 October with 5 wavelets. The green curve is the combination of other curves which are EF wavelets.
Figure 9
Figure 9
Germany: fitting and forecasting from 19 October with 5 wavelets. The green curve is the combination of other curves which are EF wavelets.
Figure 10
Figure 10
Italy: fitting and forecasting from 25 October with 5 wavelets. The green curve is the combination of other curves which are EF wavelets.
Figure 11
Figure 11
Italy: fitting and forecasting from 19 October with 5 wavelets. The green curve is the combination of other curves which are EF wavelets.
Figure 12
Figure 12
Italy: fitting and forecasting from 9 November with 5 wavelets. The green curve is the combination of other curves which are EF wavelets.
Figure 13
Figure 13
France: fitting and forecasting from 9 November with 5 wavelets. The green curve is the combination of other curves which are EF wavelets.
Figure 14
Figure 14
Germany: fitting and forecasting from 9 November with 5 wavelets. The green curve is the combination of other curves which are EF wavelets.
Figure 15
Figure 15
Czechia: fitting and forecasting from 10 November with 5 wavelets. The green curve is the combination of other curves which are EF wavelets.
Figure 16
Figure 16
Florida: fitting and forecasting from 25 October. The green curve is the combination of other curves which are EF wavelets.
Figure 17
Figure 17
New York: fitting and forecasting from 25 October. The green curve is the combination of other curves which are EF wavelets.
Figure 18
Figure 18
Florida: fitting and forecasting from 10 November 2020. The green curve is the combination of other curves which are EF wavelets.
Figure 19
Figure 19
New York: fitting and forecasting from 10 November 2020. The green curve is the combination of other curves which are EF wavelets.
Figure 20
Figure 20
Forecasting 20 days from 30 March, using a wavelet model (green curve) which is combined from EF wavelets, SMA (blue curve), ARMA model (cyan curve) and ARIMA model (yellow curve).
Figure 21
Figure 21
Forecasting 20 days from 06 April, using a wavelet model (green curve) which is combined from EF wavelets, SMA (blue curve), ARMA model (cyan curve) and ARIMA model (yellow curve).

References

    1. Brauer F., van den Driessche P., Wu J., editors. Lecture Notes in Mathematics 1945, Mathematical Biosciences Subseries. Springer; Berlin, Germany: 2008. Mathematical epidemiology.
    1. Kermack W.O., McKendrick A.G. A Contribution to the Mathematical Theory of Epidemics. Proc. R. Soc. 1927;115:700–721.
    1. Wang J. Mathematical models for COVID-19: Applications, limitations, and potentials. J. Public Health Emerg. 2020;4 doi: 10.21037/jphe-2020-05. - DOI - PMC - PubMed
    1. Bartlett M.S. Deterministic and stochastic models for recurrent epidemics; Proceedings of the Third Berkeley Symposium on Mathematical Statistics and Probability; Berkeley, CA, USA. 23–25 December 1956; pp. 81–109.
    1. Bartlett M.S. Measles periodicity and community size. J. R. Stat. Soc. A. 1957;120:48–70. doi: 10.2307/2342553. - DOI

LinkOut - more resources