. 2020 Dec 22;11(1):6358.
doi: 10.1038/s41467-020-20215-y.

Lunar impact crater identification and age estimation with Chang'E data by deep and transfer learning

Affiliations

Lunar impact crater identification and age estimation with Chang'E data by deep and transfer learning

Chen Yang et al. Nat Commun. .

Abstract

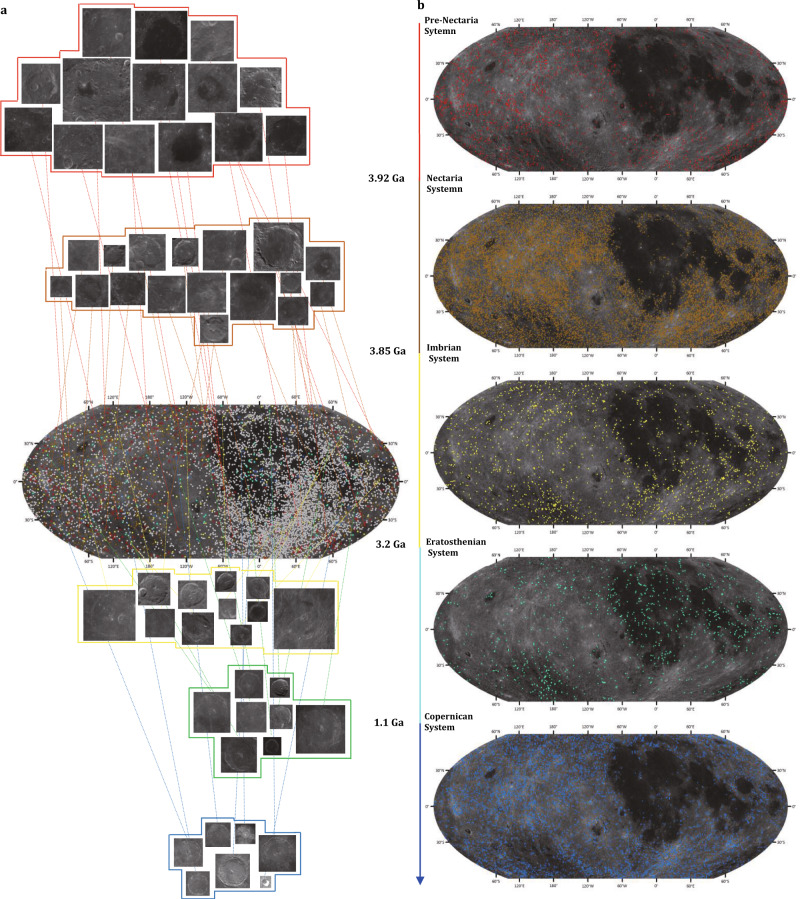
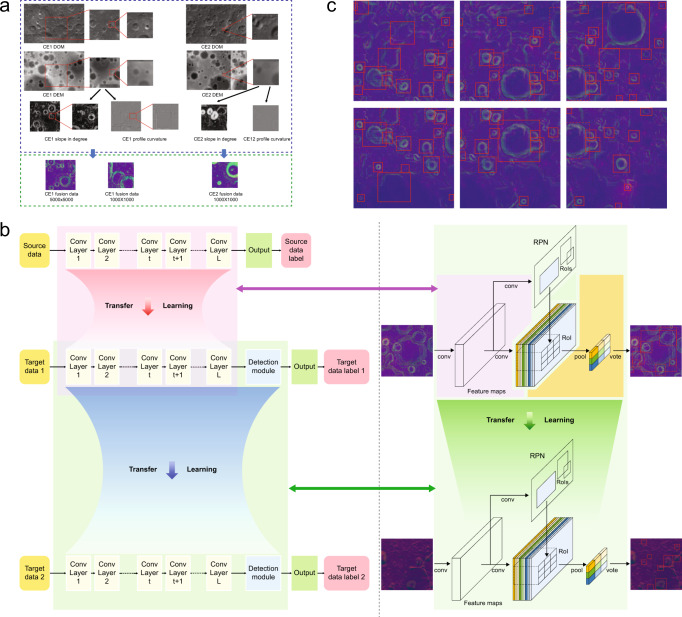
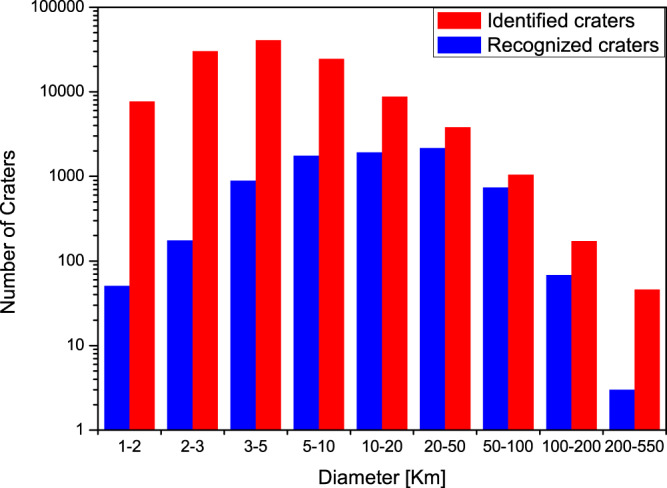
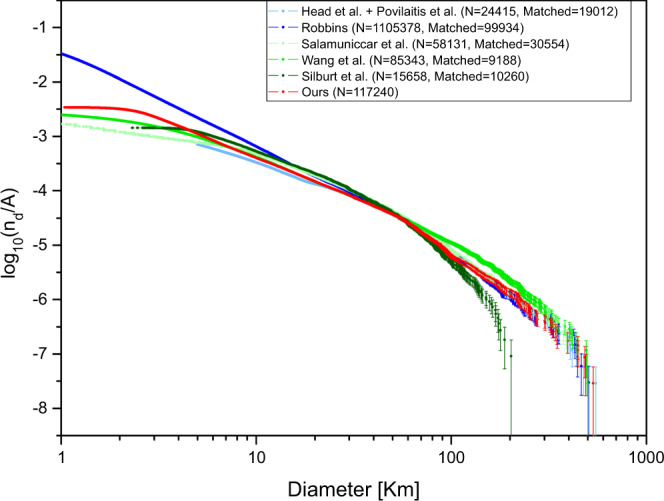
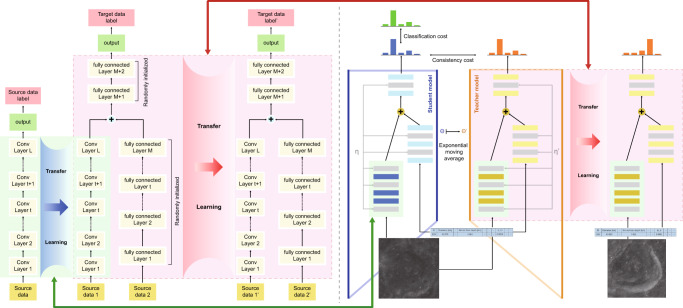
Impact craters, which can be considered the lunar equivalent of fossils, are the most dominant lunar surface features and record the history of the Solar System. We address the problem of automatic crater detection and age estimation. From initially small numbers of recognized craters and dated craters, i.e., 7895 and 1411, respectively, we progressively identify new craters and estimate their ages with Chang'E data and stratigraphic information by transfer learning using deep neural networks. This results in the identification of 109,956 new craters, which is more than a dozen times greater than the initial number of recognized craters. The formation systems of 18,996 newly detected craters larger than 8 km are estimated. Here, a new lunar crater database for the mid- and low-latitude regions of the Moon is derived and distributed to the planetary community together with the related data analysis.


Conflict of interest statement

The authors declare no competing interests.

Figures

Fig. 1
Fig. 1. Distribution of lunar impact craters on the Moon.
a The distribution of recognized and dated craters. The red, brown, yellow, green and blue squares and points represent the craters of the pre-Nectarian System, the Nectarian System, the Imbrian System, the Eratosthenian System and the Copernican System, respectively. The grey points show recognized craters without ages. b Distribution of identified craters with assigned ages. From the time scale and spatial distribution, these dated craters exhibit specific characteristics. Craters with diameters smaller than 8 km and larger than 550 km are not shown in the distribution map.
Fig. 2
Fig. 2. Identification of lunar impact craters based on transfer learning (TL) with Chang’E-1 (CE-1) data and Chang’E-2 (CE-2) data.
a CE-1 and CE-2 digital orthophoto images (DOM) and DOM data fusion and multiscale crater images. b The flowchart demonstrates the two-stage crater detection approach based on TL. The flowchart is split by a vertical dotted line. The left part shows the TL process, and the right part shows the corresponding network structure in detail. In the left part, the light pink area indicates the first-stage TL. The detection module is the region-based fully convolutional network with the basic network of the ResNet101 convolutional neural networks (CNN) architecture. ResNet101 (only the convolutional layers, not including the top fully connected layers) is transferred for crater detection. The detection module is fine-tuned by CE-1 data. Then, the detection module is directly transferred to CE-2 data, as shown in the light green area. It should be emphasized that there is no training in the second-stage TL. c Detection maps with CE-1 data. There are six adjacent detection maps that have a 50% overlap with each other. The red squares show the edge of detected craters, and the red dashed squares represent the individual undetected craters (on the image edge or not fully displayed on the image) in one of the detection maps. However, the individual undetected craters can be detected in the other adjacent detection maps.
Fig. 3
Fig. 3. Identified lunar impact craters distributions compared with the recognized craters from the International Astronomical Union (IAU) in different diameter scales.
The red column represents the number of the identified craters compared with the number of the recognized craters (blue column). Recognized craters used for identification are the ones completely located within the study area having diameters larger than 1 km and smaller than 500 km. Source data are provided as a source data file.
Fig. 4
Fig. 4. The cumulative size-frequency distributions (CSFDs) of craters in the existing databases and those identified in this paper.
The light blue and blue lines show the crater CSFDs of the manual lunar crater databases, i.e., combined Head et al. + Povilaitis et al. and Robbins. The light green, green and dark green lines show CSFDs of the three automated crater catalogues, i.e., Salamunićcar et al., Wang et al. and Silburt et al. The red line represents the CSFD of the craters identified in this paper. The confidence interval ±σ, which for the kth crater is logk±k/A, where A is the surface area, kth crater means that the kth-largest crater at the level of diameter. Source data are provided as a source data file.
Fig. 5
Fig. 5. Estimation of the age of lunar craters based on transfer learning (TL) with Chang’E-1 (CE-1) data and Chang’E-2 (CE-2) data.
The flow chart demonstrates the two-stage crater classification approach based on TL. The two stages are separated by dotted lines. The left part is the TL process, and the right part shows the crater classification network structure. In the left part, the light green area indicates the first-stage TL. The crater classification model includes two types of input data, i.e., images and attribute data. Thus, the model consists of two channels. One of the channels is based on the pre-trained deep convolutional neural networks (CNN) model on ImageNet (only convolutional layers, not including the top fully connected layers) for images, and the other is the feedforward neural network for attribute data. Meanwhile, a semi-supervised learning strategy, i.e., Meanteacher, is adopted to take advantage of a large number of newly identified craters. In the second TL stage, the two-channel classification model with the Meanteacher strategy is directly used for estimating ages with CE-2 data, as shown in the light pink area. There is no other training in the second TL stage. A series of deep CNN techniques are then used for the classification of crater ages with CE images.
Fig. 6
Fig. 6. Confusion matrix of the age estimation algorithm with Chang’E-1 (CE-1) data and Chang’E-2 (CE-2) data.
Confusion matrices for the crater age classification task of CE-1 and CE-2 data reveal acceptable misclassification of different systems. Element (i, j) of each confusion matrix represents the probability of estimating system j given that the true system is i, with i and j referring to different systems. The diagonal of the matrix represents the probability of corrected classification for each system. Note that with both CE-1 and CE-2 images, there is some confusion between adjacent systems. For the first stage of classification with CE-1 images, compared with other systems, the pre-Nectarian System and the Copernican System have a very high accuracy (100%). Some of the craters of the Imbrian System are confused with those of the Eratosthenian System. For the second stage with the CE-2 image, only two craters of the pre-Nectarian System are used for testing owing to the resolution and confusion with those of the Nectarian System. The diameters of craters in the Eratosthenian System and the Copernican System are relatively small, and craters of the Copernican System sometimes do not feature bright rays in the DOM data. However, the overall classification results are accurate and reliable for supporting scientific analysis and interpretation. Source data are provided as a source data file.
Fig. 7
Fig. 7. Dated lunar crater size-frequency distributions.
a Number of estimated craters and related assigned ages from the Lunar and Planetary Institute (LPI) with five ages in different diameter scales. Source data are provided as a source data file. b The cumulative size-frequency distributions (CSFDs) of identified craters with estimated ages and recognized craters with ages. Source data are provided as a source data file. The red, brown, yellow, green and blue lines represent the estimated crater CSFDs of the pre-Nectarian System, the Nectarian System, the Imbrian System, the Eratosthenian System and the Copernican System, respectively, and the hollow lines show recognized crater CSFDs of the five systems in the LPI used for age estimation. The confidence interval ±σ, which for the kth crater is logk±k/A, where A is the surface area, kth crater means that the kth-largest crater at the level of diameter. Source data are provided as a source data file. c, d R plots (areal density) of dated craters superimposed on lunar nearside mare and farside highland areas, illustrating the difference in density and CSFD slope of the five systems on the two terrains. The confidence interval ±σ is logR±R/N, where R is the R value, N is the cumulative number of craters. Source data for c, d are provided as a source data file.

References

    1. Hartmann WK. Note: lunar cratering chronology. Icarus. 1970;13:299–301. doi: 10.1016/0019-1035(70)90059-X. - DOI
    1. Ryder G. Mass flux in the ancient Earth-Moon system and benign implications for the origin of life on Earth. J. Geophys. Res. Planets. 2002;107:1–13. doi: 10.1029/2001JE001583. - DOI
    1. Gomes R, Levison HF, Tsiganis K, Morbidelli A. Origin of the cataclysmic Late Heavy Bombardment period of the terrestrial planets. Nature. 2005;435:466–469. doi: 10.1038/nature03676. - DOI - PubMed
    1. Chapman CR, Cohen BA, Grinspoon DH. What are the real constraints on the existence and magnitude of the late heavy bombardment? Icarus. 2007;189:233–245. doi: 10.1016/j.icarus.2006.12.020. - DOI
    1. Bottke WF, Norman MD. The late heavy bombardment. Annu. Rev. Earth Planet. Sci. 2017;45:619–647. doi: 10.1146/annurev-earth-063016-020131. - DOI

Publication types