. 2021 Feb;24(2):214-224.
doi: 10.1038/s41593-020-00763-8. Epub 2020 Dec 22.

Overexpression of schizophrenia susceptibility factor human complement C4A promotes excessive synaptic loss and behavioral changes in mice

Affiliations

Overexpression of schizophrenia susceptibility factor human complement C4A promotes excessive synaptic loss and behavioral changes in mice

Melis Yilmaz et al. Nat Neurosci. 2021 Feb.

Abstract

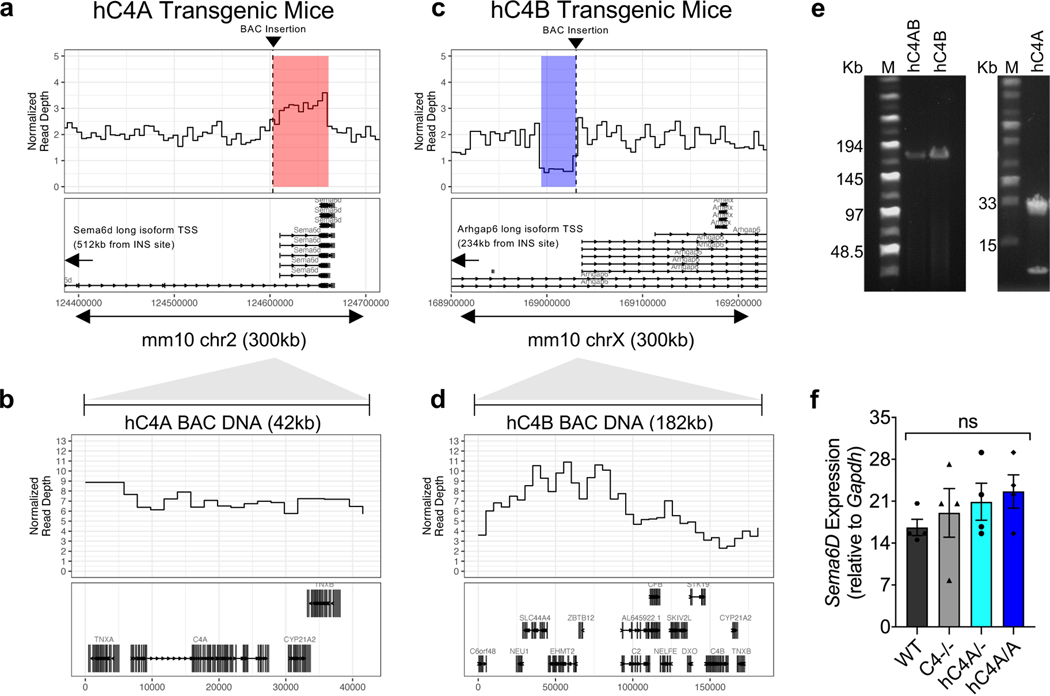
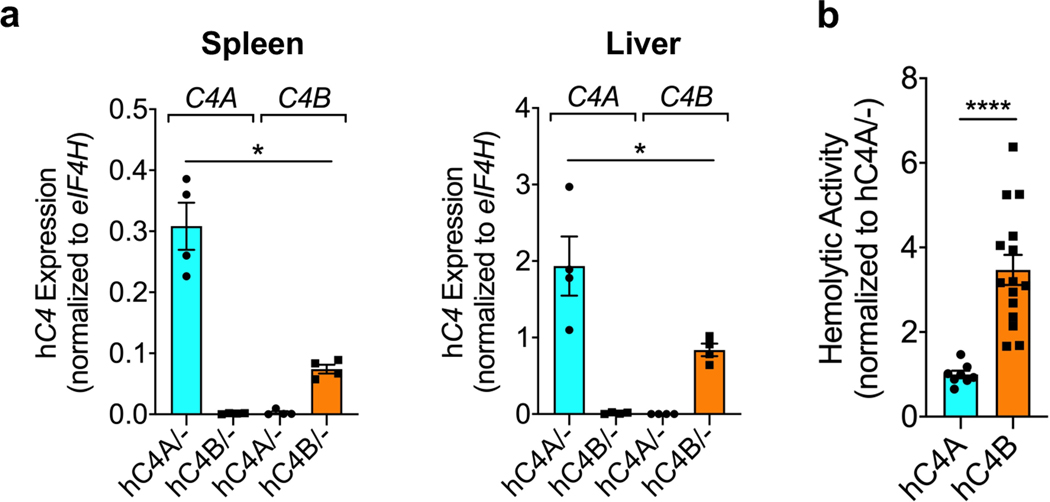
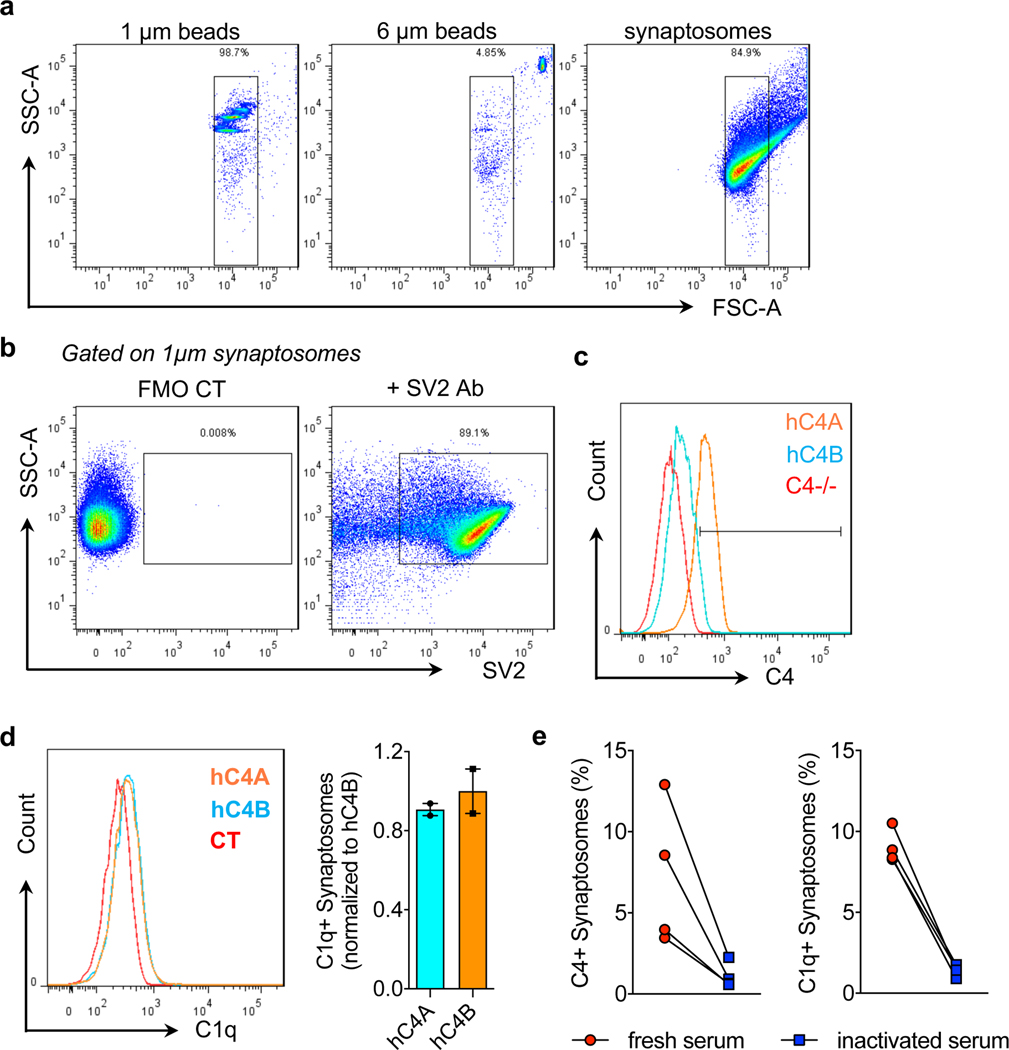
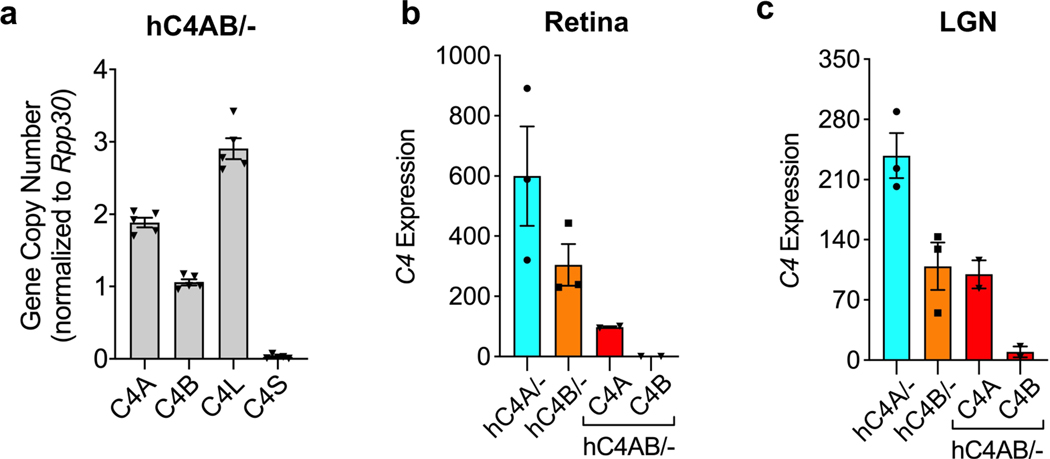
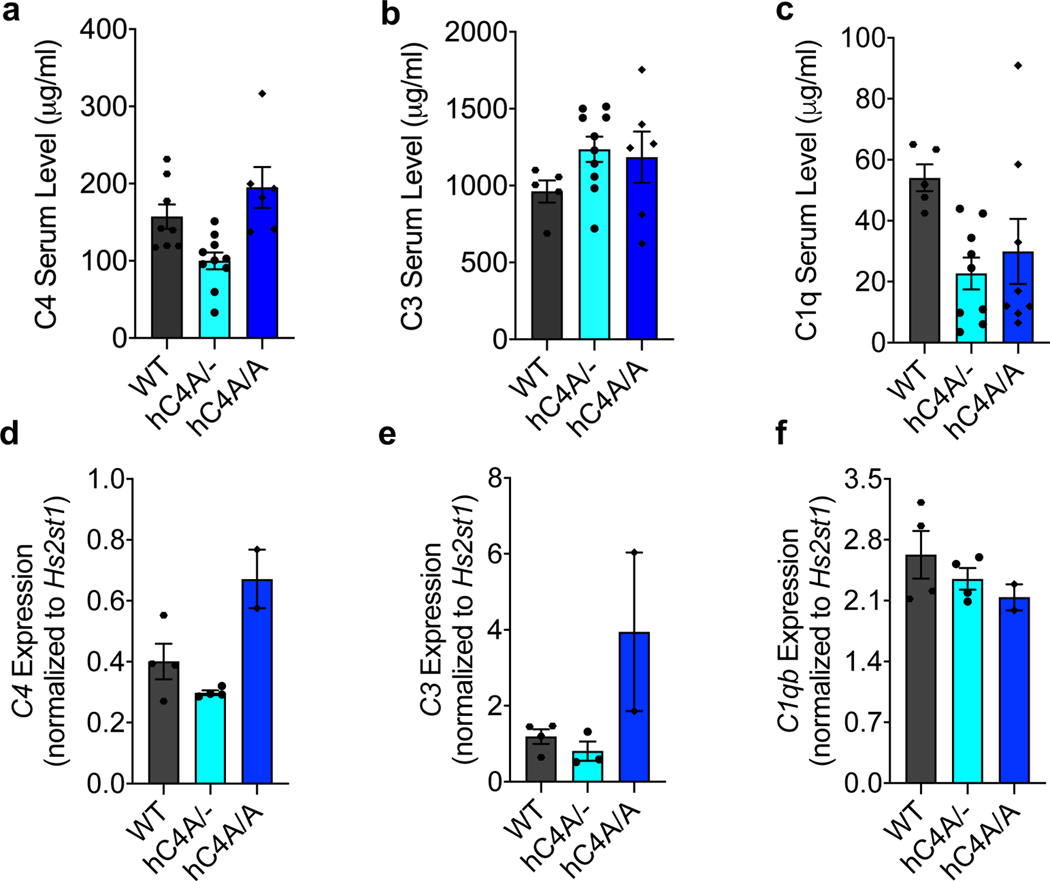
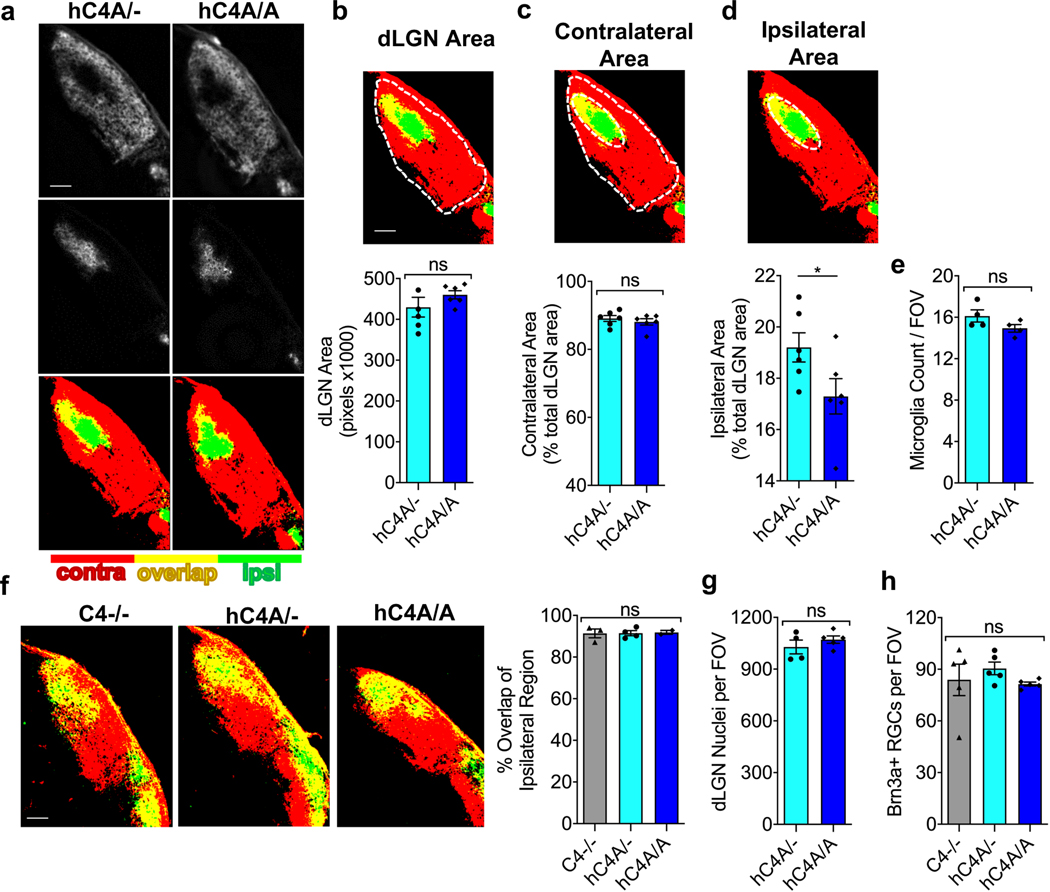
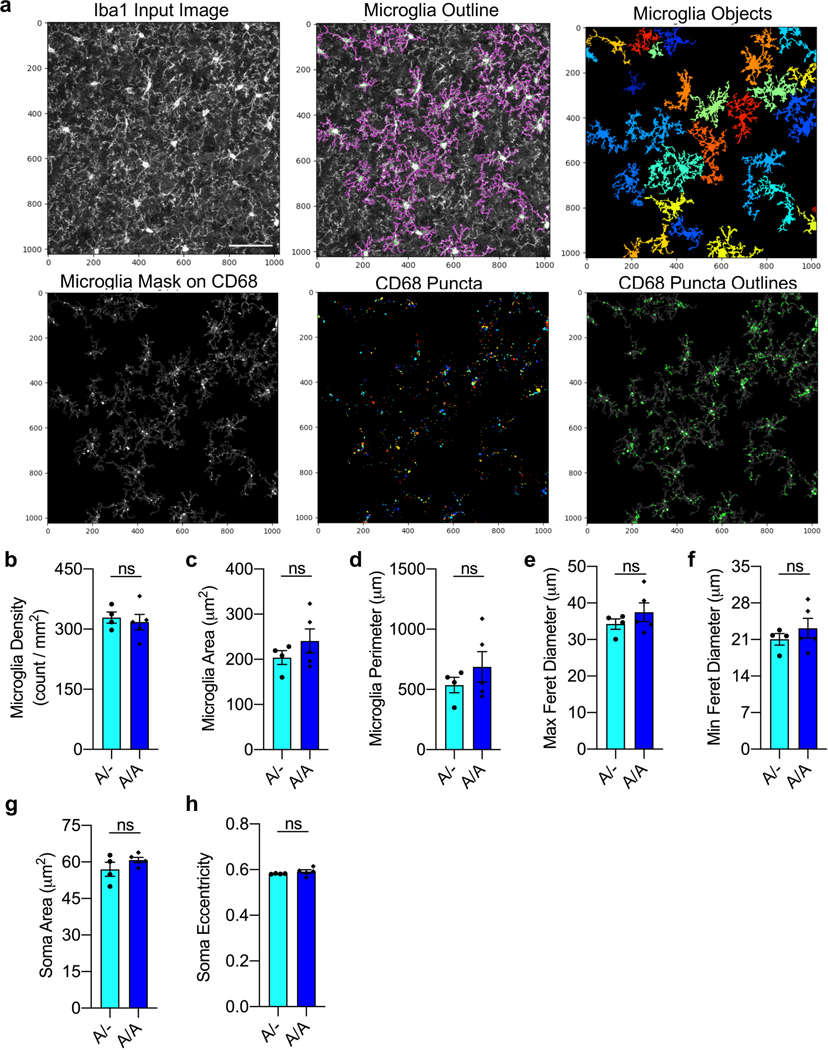
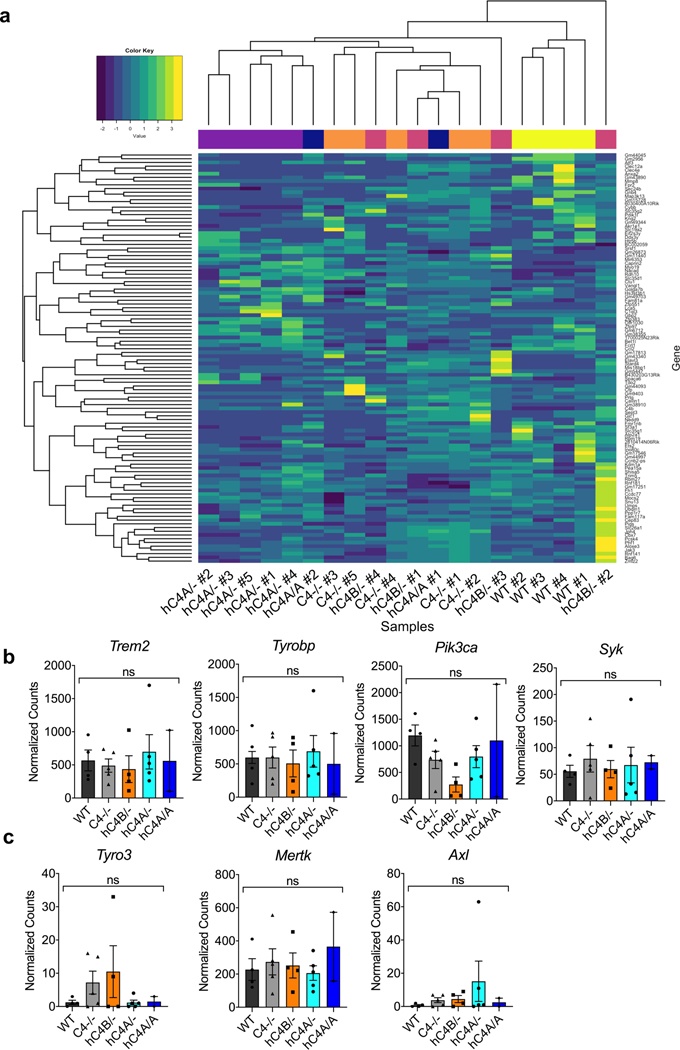
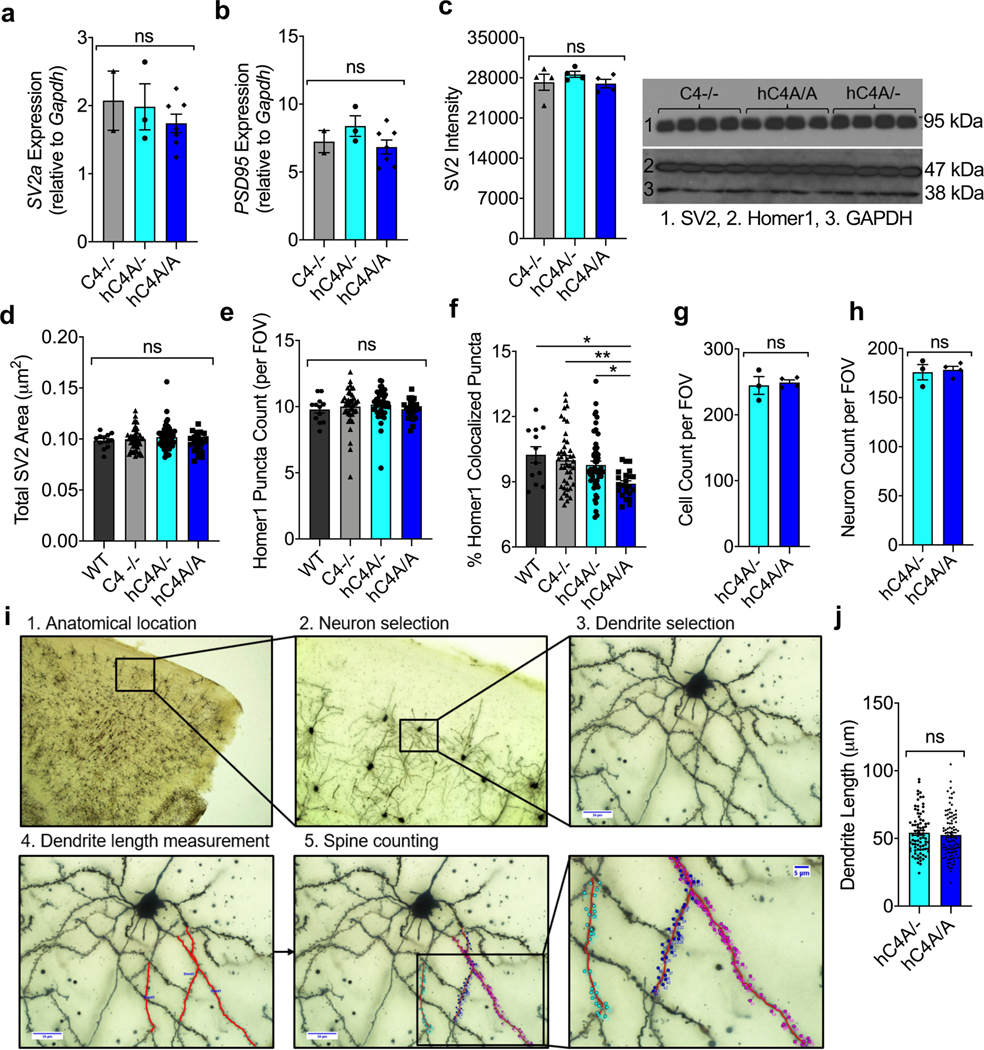
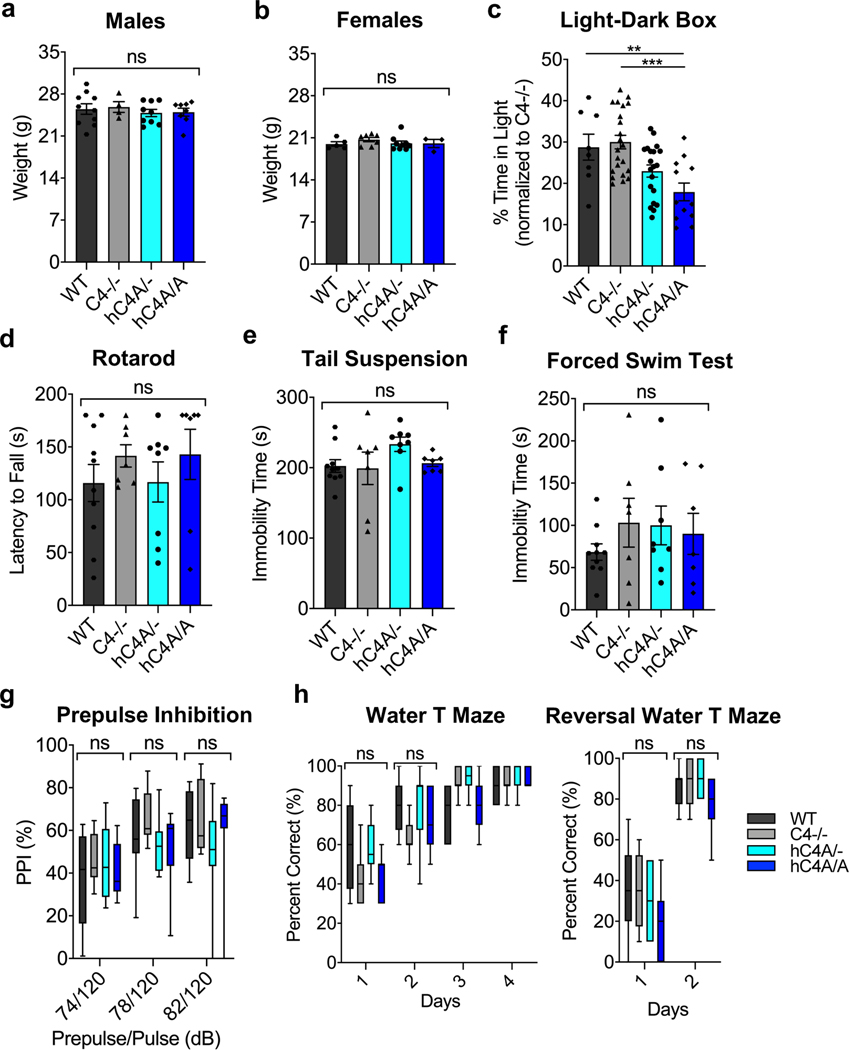
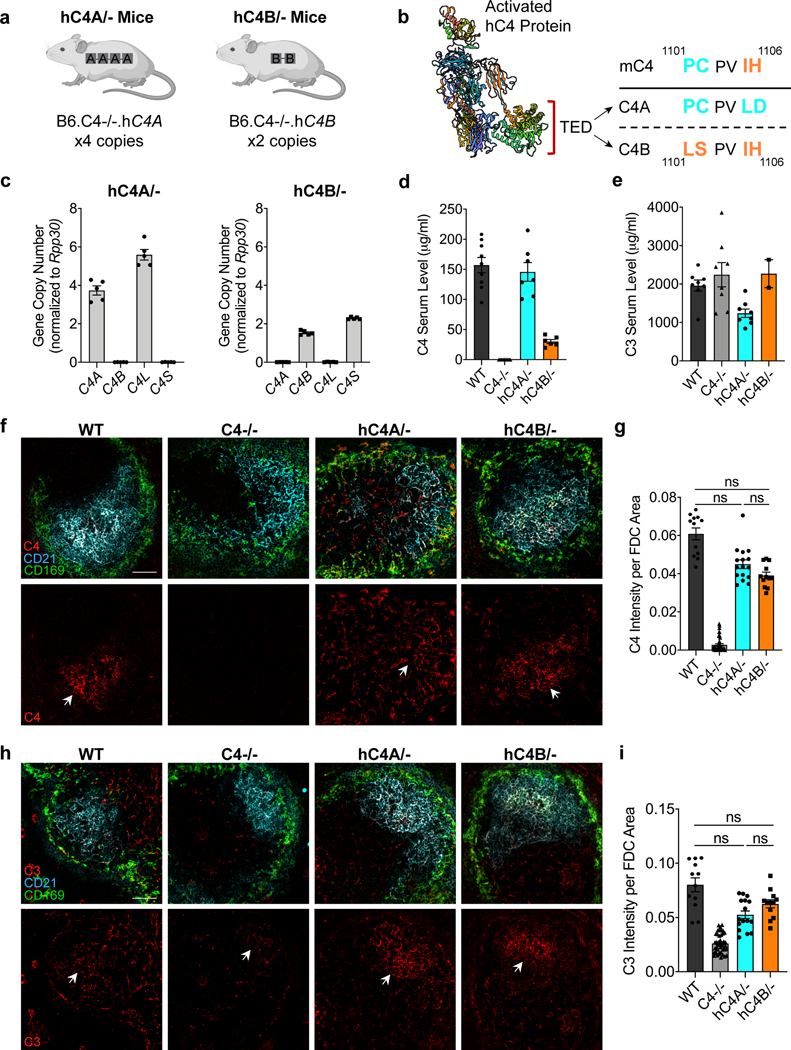
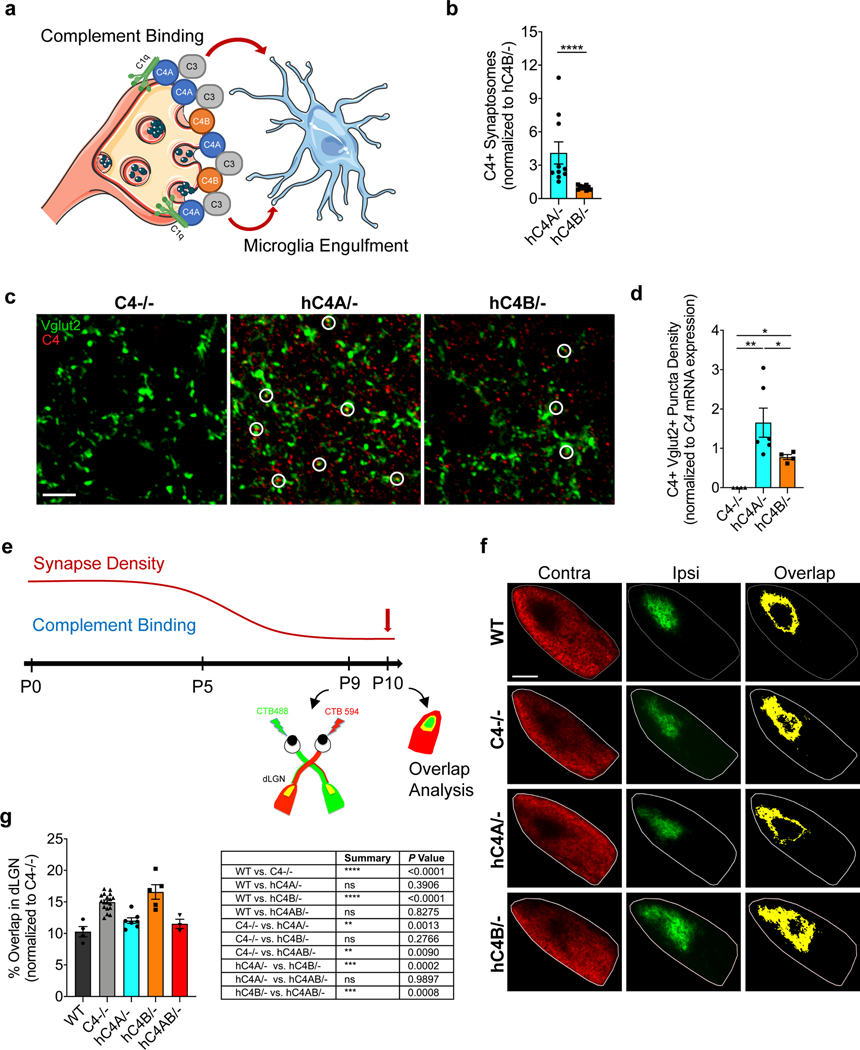
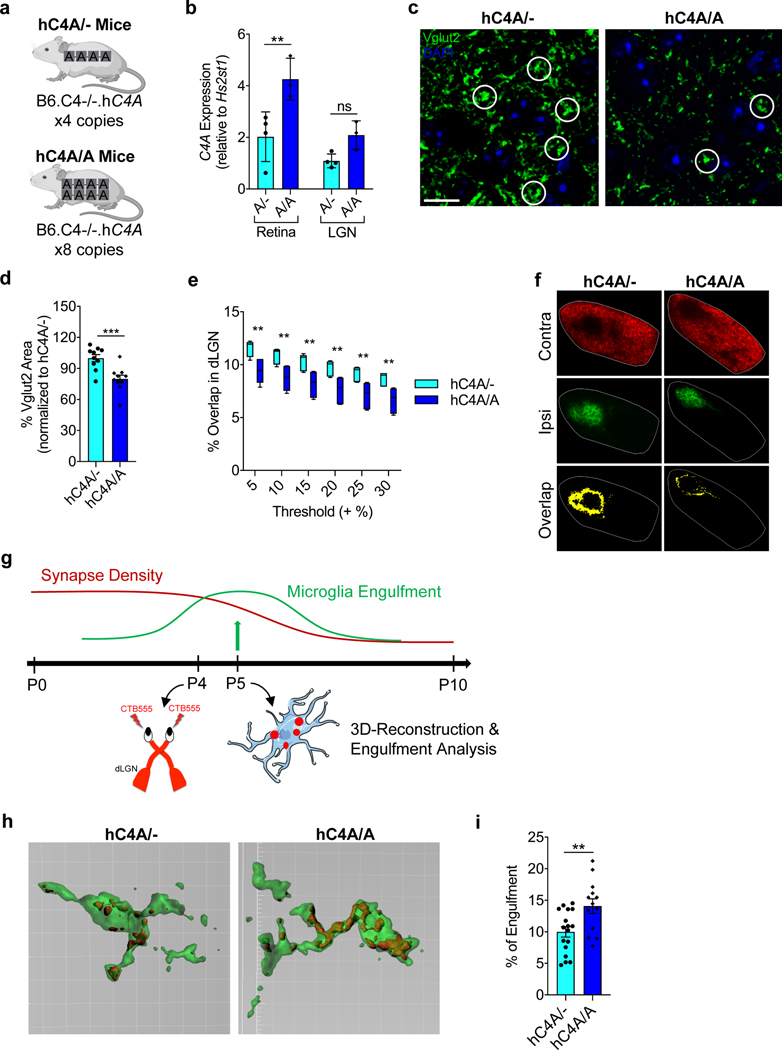
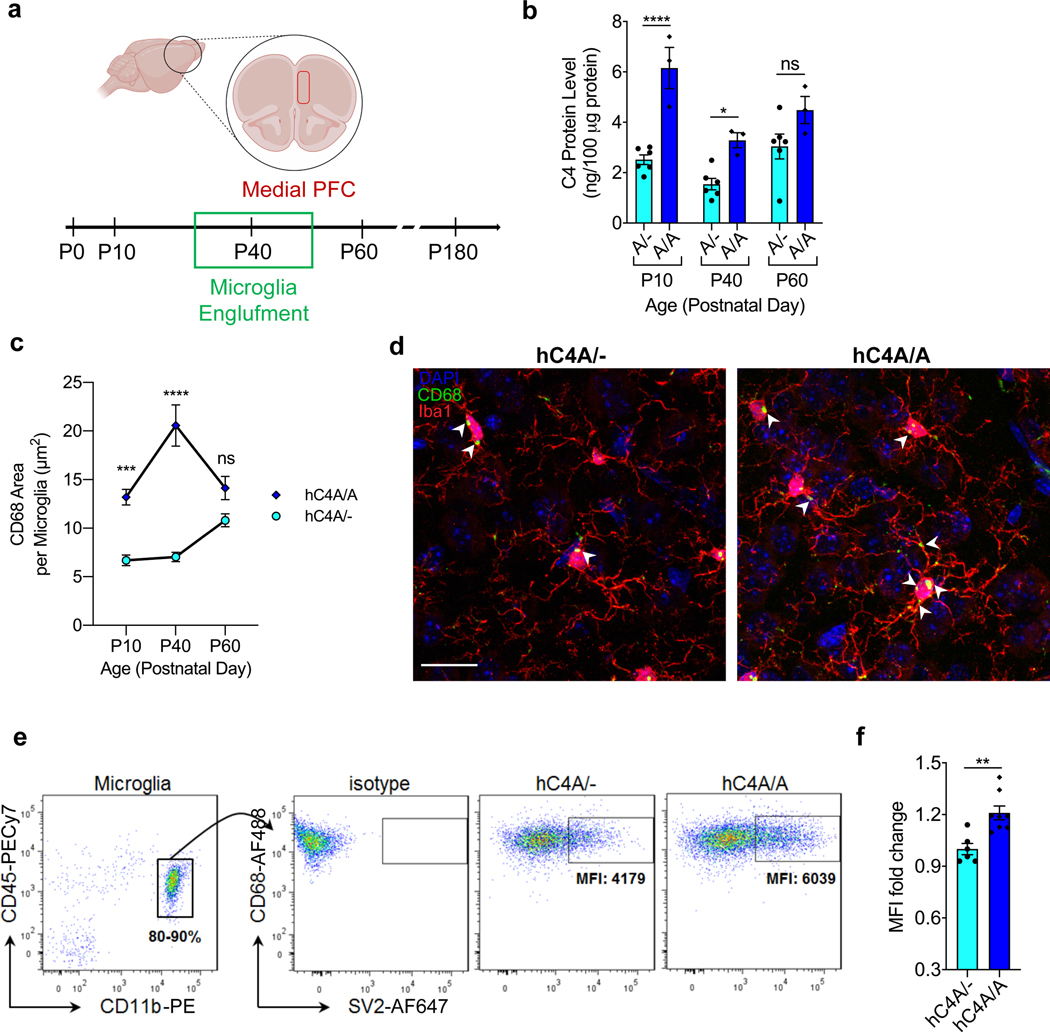
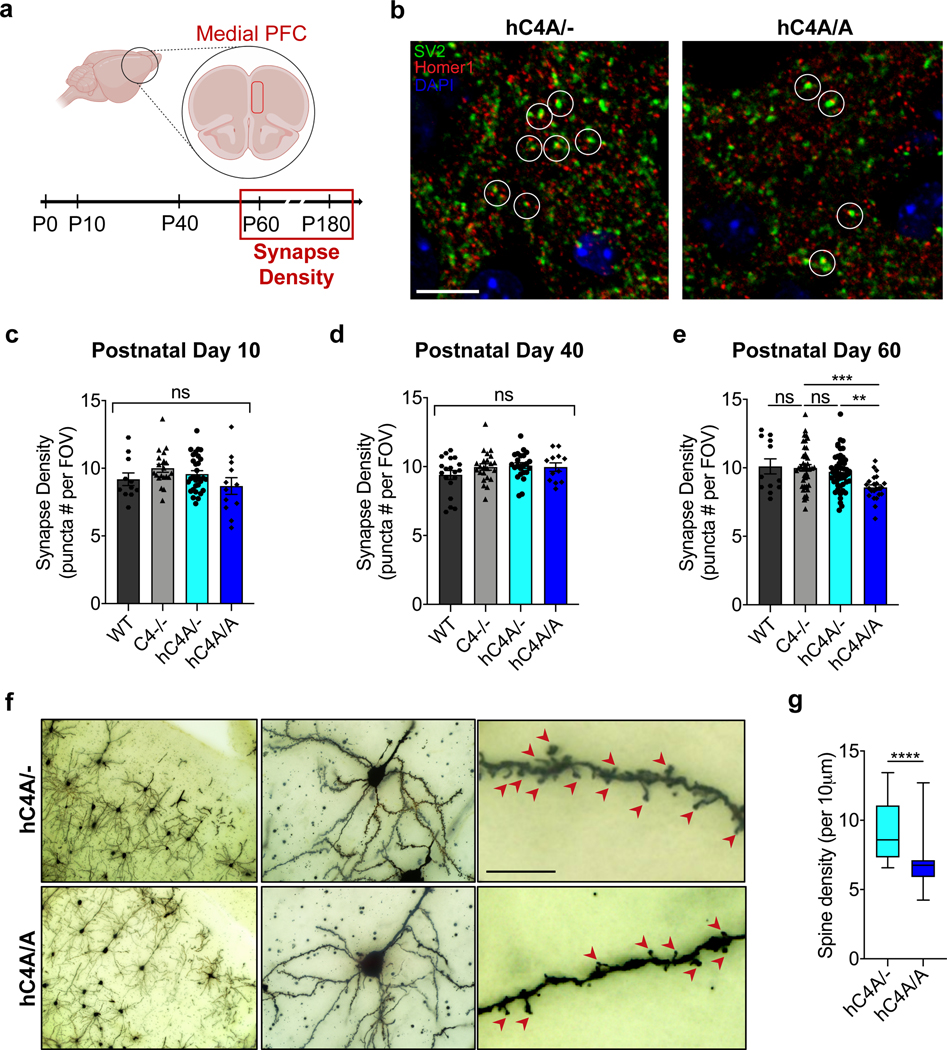
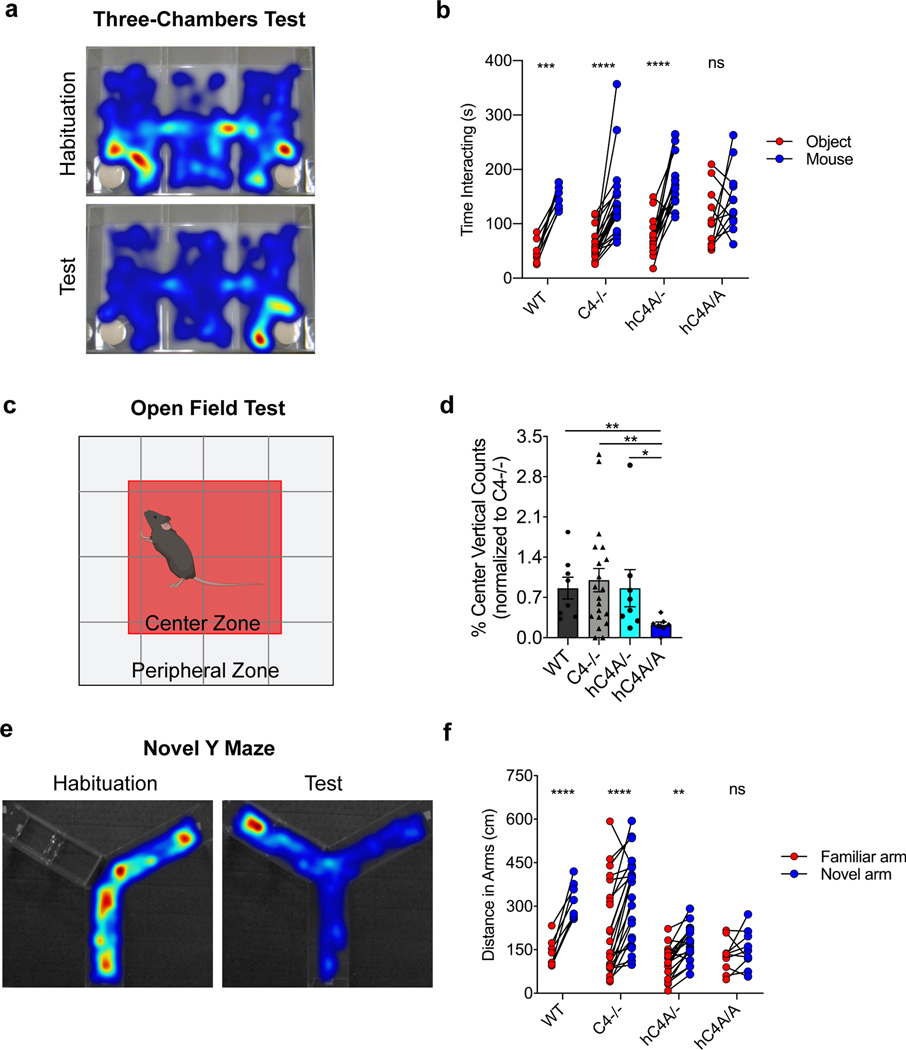
The complement component 4 (C4) gene is linked to schizophrenia and synaptic refinement. In humans, greater expression of C4A in the brain is associated with an increased risk of schizophrenia. To investigate this genetic finding and address how C4A shapes brain circuits in vivo, here, we generated a mouse model with primate-lineage-specific isoforms of C4, human C4A and/or C4B. Human C4A bound synapses more efficiently than C4B. C4A (but not C4B) rescued the visual system synaptic refinement deficits of C4 knockout mice. Intriguingly, mice without C4 had normal numbers of cortical synapses, which suggests that complement is not required for normal developmental synaptic pruning. However, overexpressing C4A in mice reduced cortical synapse density, increased microglial engulfment of synapses and altered mouse behavior. These results suggest that increased C4A-mediated synaptic elimination results in abnormal brain circuits and behavior. Understanding pathological overpruning mechanisms has important therapeutic implications in disease conditions such as schizophrenia.


Figures

Extended Data Fig. 1 |
Extended Data Fig. 1 |. Characteristics of C4 BAC DNA integration.
a-d, Insertion sites and associated rearrangements are shown for each mouse strain. a, c, The BAC DNA insertion site is shown for each mouse strain. Normalized read depth in 2-kb genomic windows at the insertion sites of the BACs. Dashed vertical lines indicate the insertion site. The hC4A insertion was associated with a duplication, and the hC4B insertion was associated with a small deletion. b, d, The BAC DNA-associated rearrangements are shown for each mouse strain. Normalized read depth in 1-kb genomic windows shows the copy number of the inserted constructs. Gene models are shown beneath the read depth plots. Human C4A was likely inserted into hC4A transgenic mice at a normalized read depth between 5 and 9. Human C4B was likely inserted into hC4B transgenic mice at a copy number between 2 and 5. The inserted hC4B BAC constructs contain additional internal copy number variants. e, Pulse-field gel showing linearized hC4B and hC4A BAC DNA used for microinjection into zygotes (representative of 3 independent experiments). Unprocessed versions of the gels can be found in Supplementary Figure 1a. f, Sema6D mRNA expression level in cortex was not changed by the region duplication caused by hC4A BAC DNA insertion. Gapdh was used as a control housekeeping gene (n = 4 mice per group; ns = P > 0.05, Kruskal-Wallis test with Dunn’s multiple comparisons test). Bar graph shows mean ± s.e.m.
Extended Data Fig. 2 |
Extended Data Fig. 2 |. Peripheral expression and function of C4 in hC4 transgenic mice.
a, C4A- and C4B-specific mRNA level was measured by ddPCR in the spleen (left) and liver (right) of hC4A/- and hC4B/- mice. eiF4H was used as the control housekeeping gene (n = 4 mice per group; * PSpleen = 0.0286, * PLiver = 0.0286; two-tailed Mann-Whitney test). b, C4 hemolytic activity was measured with equal amounts of hC4A or hC4B protein using sensitized sheep red blood cells. Data were normalized to hC4A samples (n = 8 hC4A and n = 15 hC4B combined from 3 independent experiments; **** P < 0.0001, Unpaired, two-tailed t test). Bar graphs show mean ± s.e.m.
Extended Data Fig. 3 |
Extended Data Fig. 3 |. Complement activation and binding to synaptosomes.
a, Representative dot plots showing the FSC-A / SSC-A of 1-μm beads, 6-μm beads, and synaptosomes. Further analysis will be gated on 1-μm synaptosomes. b, Synaptosomes were permeabilized and stained with anti-SV2 antibody (+ SV2 Ab) or no antibody (FMO CT). More than 85% of the particles analyzed contain SV2 protein. c, Representative histogram plot of C4 staining on synaptosomes isolated from C4−/− mice and incubated with serum from C4−/− (red), hC4A (orange), and hC4B (blue) mice. d, C1q deposition is shown and quantified using serum from hC4A mice (orange; n = 2), hC4B mice (blue; n = 2), or no serum CT (red). e, C4 (left) and C1q (right) deposition was detected on synaptosomes using fresh (red) or heat-inactivated (blue) serum. Bar graph shows mean ± s.e.m.
Extended Data Fig. 4 |
Extended Data Fig. 4 |. Human C4 in the retinogeniculate system.
a, hC4AB/- mice: gene copy numbers for C4A, C4B, C4A-L (C4L), and C4B-S (C4S) were determined by ddPCR using Rpp30 as a reference gene. It showed an insertion of two C4A-L genes and one C4B-L gene (n = 5 representative mice). Whole-genome sequencing revealed the hC4AB BAC DNA was inserted in chromosome 3 and that one C4A copy was truncated resulting in only one C4A coding copy (data not shown). b-c, Absolute quantification by ddPCR was used to measure C4A- and C4B-specific mRNA level in the retina and LGN from P5 hC4A/- (n = 3), hC4B/- (n = 3), and hC4AB/- mice (n = 2). Bar graphs show mean ± s.e.m.
Extended Data Fig. 5 |
Extended Data Fig. 5 |. Complement profile in hC4 transgenic mice during adolescence (P40).
a-c, Level of classical complement cascade proteins were measured in serum by ELISA in adolescent (P40) WT, hC4A/-, and hC4A/A mice. a, C4 serum level was measured in WT (n = 8), hC4A/- (n = 10), and hC4A/A mice (n = 6). b, C3 serum level was measured in WT (n = 5), hC4A/- (n = 10), and hC4A/A mice (n = 6). c, C1q serum level was measured in WT (n = 5), hC4A/- (n = 9), and hC4A/A mice (n = 8). d-f, RNA expression of classical complement cascade components in the FC were measured by ddPCR in adolescent (P40) WT, hC4A/-, and hC4A/A mice. All RNA measurements were normalized to Hs2st1 expression level. d, C4 mRNA expression level in FC was measured in WT (n = 4), hC4A/- (n = 4), and hC4A/A mice (n = 2). e, C3 mRNA expression level in FC was measured in WT (n = 4), hC4A/- (n = 3), and hC4A/A mice (n = 2). f, C1qb mRNA expression level in FC was measured in WT (n = 4), hC4A/- (n = 4), and hC4A/A mice (n = 2). Bar graphs show mean ± s.e.m.
Extended Data Fig. 6 |
Extended Data Fig. 6 |. C4A overexpression doesn’t change LGN cellularity or morphology.
a, Representative images of contralateral (top), ipsilateral (middle), and overlapping regions (bottom; scale = 20 μm). b-d, dLGN size (b), contralateral area (c), and ipsilateral area (d) were measured in P10 hC4A/- and hC4A/A mice (n = 6 hC4A/- and n = 6 hC4A/A littermates from 3 independent cohorts; two-tailed Mann-Whitney test; ns = P > 0.05, * P = 0.0411; scale = 20 μm). e, Iba1 staining was used to count the total number of microglia in the dLGN FOV (n = 4 mice per group; two-tailed Mann-Whitney test; ns = P > 0.05). f, Mice were injected with fluorescent-conjugated cholera toxin subunit-B (CTB) in each eye at P4 and brains were harvested at P5. Representative pseudo-colored images of P5 dLGN from C4−/−, hC4A/-, and hC4A/A littermates of contralateral (red), ipsilateral territories (green), and overlap (yellow) between the two territories (scale = 20 μm). Percent of overlap in ipsilateral region was compared in C4−/− (n = 3), hC4A/- (n = 4), and hC4A/A mice (n = 2; littermates). g, DAPI was used to count the total number of cells in the dLGN field of view (FOV) (n = 6 hC4A/- and n = 5 hC4A/A littermates from 3 independent cohorts; two-tailed Mann-Whitney test; ns = P > 0.05). h, The number of Brn3a+ RGCs was compared between C4−/−, hC4A/-, and hC4A/A mice (n = 5 mice per group; Kruskal-Wallis test with Dunn’s multiple comparisons test; ns = P > 0.05; scale = 20 μm). Bar graphs show mean ± s.e.m.
Extended Data Fig. 7 |
Extended Data Fig. 7 |. Cell Profiler microglia morphological analysis.
a, Cell Profiler software was used to analyze microglia morphology and lysosomal activity in the frontal cortex of P40 hC4A/- and hC4A/A mice. Microglial soma and processes are identified by Iba1 signature by using the image-based watershed method (top row). Microglia are used as a mask to select and quantify intracellular CD68 puncta (bottom row; scale = 50 μm). b-h, Morphological parameters for mPFC microglia (b-f) and their soma (g-h) from hC4A/- (n = 4) and hC4A/A (n = 5) mice were calculated by Cell Profiler software at P40 timepoint (ns = P > 0.05, two-tailed Mann-Whitney test). Bar graphs show mean ± s.e.m.
Extended Data Fig. 8 |
Extended Data Fig. 8 |. Microglial RNA sequencing analysis reveals no transcriptomic alterations in hC4 transgenic mice.
a, Bulk RNA sequencing analysis of microglia isolated from the frontal cortex of adolescent (P40) mice from WT (n = 4), C4−/− (n = 5), and hC4A/- (n = 5), hC4B/- (n = 4), and hC4A/A (n = 2) groups. Heatmap representation of differentially expressed genes between all experimental groups shows no significant transcriptional profile difference between any two groups. b-c, Normalized gene counts for the TREM2/DAP12 signaling pathway (b) and TAM receptor genes (c) were calculated for WT (n = 4), C4−/− (n = 5), hC4A/- (n = 5), hC4B/- (n = 4), and hC4A/A (n = 2; ns = P > 0.05, Kruskal-Wallis test with Dunn’s test). Bar graphs show mean ± s.e.m.
Extended Data Fig. 9 |
Extended Data Fig. 9 |. Synaptic protein expression is not affected by C4A overexpression in mice.
a-b, rt-PCR was used to measure mRNA expression of Sv2a (a) and Psd95 (b) in the FC in adult mice (C4−/− n = 2, hC4A/- n = 3, and hC4A/A littermates n = 7). RNA expression was normalized to Gapdh expression. c, SV2 and PSD95 protein level were analyzed by western blot. GAPDH was used as a loading control protein (C4−/− n = 4, hC4A/- n = 4, and hC4A/A n = 4 littermates from one experiment; Kruskal-Wallis test with Dunn’s multiple comparisons test; ns = P > 0.05). Unprocessed versions of the western blots can be found in Supplementary Figure 1b. d, Total SV2 area per FOV in the mPFC was calculated from immunofluorescence staining between WT (n = 3), C4−/− (n = 11), hC4A/- (n = 13), and hC4A/A (n = 6) groups (Kruskal-Wallis test with Dunn’s multiple comparisons test). e-f, Total Homer1 puncta and percentage of colocalized Homer1 puncta from the mPFC in adult mice were calculated for WT (n = 3), C4−/− (n = 11), hC4A/- (n = 13), and hC4A/A (n = 6) groups (Kruskal-Wallis test with Dunn’s multiple comparisons test; ns = P > 0.05, * PWT vs A/A = 0.0139, ** PWT vs A/A = 0.0139). g-h, Brain sections were stained with DAPI and NeuN, and cellularity was measured in frontal cortex at P180. Total cells (g) and neurons (h) per FOV in frontal cortex is represented for hC4A/- (n = 3) and hC4A/A mice (n = 4; two-tailed Mann-Whitney test; ns = P > 0.05). i, Method used for the manual counting of dendritic spines in mPFC of hC4 mice. j, Length of dendrites that have been used for spine density analysis for hC4A/- (80 dendrites) and hC4A/A (96 dendrites; two-tailed Mann-Whitney test; ns = P > 0.05). Bar graphs show mean ± s.e.m.
Extended Data Fig. 10 |
Extended Data Fig. 10 |. Human-C4A overexpression alters mouse behavior.
a-h, WT, C4−/−, hC4A/-, and hC4A/A mice were subjected to a battery of behavioral tests. a-b, Weight of male and female mice were compared between WT (n = 10), C4−/− (n = 4), hC4A/- (n = 9), and hC4A/A mice (n = 8; Kruskal-Wallis test with Dunn’s multiple comparisons test; ns = P > 0.05). c, Anxiety levels were measured in the light-dark box test by time spent in the light-zone between WT (n = 8), C4−/− (n = 22), hC4A/- (n = 20), and hC4A/A (n = 12) groups (two-tailed, unpaired t test; ** P = 0.0085; two-tailed Mann-Whitney test, *** P = 0.0009). Results were normalized to the C4−/− group to retain littermate controls. d, In the rotarod test, latency to fall was measured in seconds for WT (n = 10), C4−/− (n = 7), hC4A/- (n = 8), and hC4A/A (n = 7) groups (Kruskal-Wallis test with Dunn’s multiple comparisons test, ns = P > 0.05). e-f, Immobility time in seconds was compared in the tail suspension test (e) and the forced swim test (f) for WT (n = 10), C4−/− (n = 7), hC4A/- (n = 8), and hC4A/A (n = 7) groups (Kruskal-Wallis test with Dunn’s multiple comparisons test, ns = P > 0.05). g, Prepulse inhibition was measured between WT (n = 10), C4−/− (n = 7), hC4A/- (n = 8), and hC4A/A (n = 7) groups (two-way ANOVA with Tukey’s multiple comparisons test; ns = P > 0.05). h, Percent of correct decisions were recorded in the water t maze and the reversal water t maze for WT (n = 10), C4−/− (n = 7), hC4A/- (n = 8), and hC4A/A (n = 7) groups (two-way ANOVA with Tukey’s multiple comparisons test; ns = P > 0.05). Bar graphs show mean ± s.e.m. Box-and-whisker plots display the median (center line), 25th to 75th percentile (box), and minimum to maximum values (whiskers).
Fig. 1 |
Fig. 1 |. Human C4A and C4B are functionally active in a mouse model.
a, Schematic of hC4A/− and hC4B/− transgenic mice. b, A three-dimensional (3D) structure of activated hC4 protein showing the TED domain and the amino-acid sequence differences between C4A and C4B. The mC4 protein is a hybrid of C4A and C4B, gaining positions 1,101–1,102 from C4A and 1,105–1,106 from C4B. c, Gene copy numbers for C4A, C4B, C4A-L and C4B-S were determined by ddPCR using Rpp30 as a reference gene (n = 5 representatives per group). d, C4 serum levels were measured by ELISA in adult (P60) WT (n = 9), C4−/− (n = 10), hC4A/− (n = 7) and hC4B/− (n = 6) mice. e, C3 serum levels were measured by ELISA in adult (P60) WT (n = 8), C4−/− (n = 8), hC4A/− (n = 8) and hC4B/− (n = 2) mice. f, Representative confocal images of spleen showing C4 deposition on CD21+ FDCs in follicles delineated by CD169+ macrophages in WT, C4−/−, hC4A/−and hC4B/− mice (red, C4; cyan, CD21; green, CD169). White arrows indicate C4 puncta deposited onto FDCs. Scale bar, 50 μm. g, C4 deposition was quantified by fluorescence intensity per FDC area (in each FOV) for WT (n = 3), C4−/− (n = 11), hC4A/− (n = 4) and hC4B/− (n = 3) mice. Kruskal–Wallis test with Dunn’s multiple comparison test. h, Representative images showing C3 deposition on FDCs (white arrows) in WT, C4−/−, hC4A/− and hC4B/− mice (red, C3; cyan, CD21; green, CD169). Scale bar, 50 μm. i, C3 deposition was quantified by fluorescence intensity per FDC area (in each FOV) for WT (n = 3), C4−/− (n = 11), hC4A/− (n = 4) and hC4B/− (n = 3) mice. Kruskal–Wallis test with Dunn’s multiple comparison test. Bar graphs show the mean ± s.e.m. NS, not significant (P > 0.05).
Fig. 2 |
Fig. 2 |. Human C4A is more efficient than C4B in synaptic pruning.
a, At the synapse, complement-dependent pruning is carried out by the classical complement cascade. After C1q tagging, C4 binds the synapse and C3 is then activated for microglia recognition by the receptor CR3. Microglia engulf the complement-bound synapses for refinement. b, Synaptosomes from C4−/− mice were isolated and incubated with serum containing the same amount of C4 from hC4A/− (n = 10) or hC4B/− (n = 9) mice. C4 deposition on synaptosomes was detected and quantified by flow cytometry (serum from three independent experiments; Mann–Whitney test, two-tailed, ****P < 0.0001). c,d, C4 deposition onto Vglut2+ synaptic terminals in the dLGN was identified by immunofluorescence staining at P5 in C4−/− (n = 4), hC4A/− (n = 6) and hC4B/− (n = 4) mice. c, Representative images of C4 (red) and Vglut2 (green) staining in the dLGN showing C4+Vglut2+ synapses (white circles). Scale bar, 5 μm. d, Quantification of C4+Vglut2+ synapse density in P5 hC4 transgenic mice (three independent experiments; results were normalized to hC4 mRNA expression in the LGN (Mann–Whitney test, two tailed: **PC4−/− vs hC4A/− = 0.0095, *PC4−/− vs hC4B/− = 0.0286, *PhC4A/− vs hC4B/− = 0.0190). e, To investigate complement-dependent synaptic pruning in the retinogeniculate system, the eye-specific segregation assay was performed. Mice were injected with fluorescently tagged CTB (CTB-488 and CTB-594) in each eye at P9 and brains were collected at P10. f, Representative images of WT, C4−/−, hC4A/− and hC4B/− mice at P10 are shown. Inputs from contralateral (Contra; red) and ipsilateral (Ipsi; green) eyes and overlapping area (yellow) are shown. Scale bar, 100 μm. g, The percentage overlap of the contralateral and ipsilateral areas were calculated for P10 WT (n = 4), C4−/− (n = 18), hC4A/− (n = 7), hC4B/− (n = 6) and hC4AB/− (n = 3) mice (2 independent experiments; all results were normalized to the C4−/− group to retain littermate controls; one-way ANOVA with Tukey’s multiple comparisons test). Bar graphs show the mean ± s.e.m.
Fig. 3 |
Fig. 3 |. increased C4A copy number induces excessive synaptic pruning via microglia engulfment.
a, Schematic of hC4A/− and hC4A/A transgenic mice. b, C4A mRNA expression was measured at P5 in the retina and the LGN from hC4A/− (A/−; n = 4) and hC4A/A (A/A; n = 3) mice by ddPCR (littermates from two independent cohorts; two-way ANOVA with Sidak’s multiple comparisons test, **P = 0.0039). c,d, The presynaptic marker Vglut2 was stained by immunofluorescence at P10 for hC4A/− (n = 10) and hC4A/A (n = 10) mice. c, Representative images of Vglut2 immunostaining are shown. White circles indicate examples of Vglut2 synapses. Scale bar, 10 μm. d, Percentage area of Vglut2 staining was measured (littermates from three independent cohorts; unpaired, two-tailed t-test, ***P = 0.0009). e,f, The eye-specific segregation assay was performed for hC4A/− (n = 6) and hC4A/A (n = 6) mice. e, The percentage overlap over multiple thresholds was used for analysis in P10 hC4A/− and hC4A/A mice (n = 6 in each group, littermates from 3 independent experiments; two-way ANOVA with Sidak’s multiple comparisons test, 0.0026 ≤ **P ≤ 0.0054). Box-and-whisker plot displays the median (center line), the 25th to 75th percentile (box), and the minimum and maximum values (whiskers). f, Representative images of hC4A/− and hC4A/A littermates at P10 from three independent experiments showing inputs from contralateral (red) and ipsilateral (green) eyes and the overlapping area (yellow). Scale bar, 100 μm. g, Schematic of the experiment. Mice received an intravitreal injection of fluorescently conjugated CTB (CTB-555) at P4 and brains were collected at P5, when microglia engulfment is at its peak. Microglia were stained with Iba1 for confocal imaging and 3D reconstruction. h, Representative surface-rendered microglia (green) and engulfed retinogeniculate inputs (red) from the dLGN. Grid line increments are 5 μm. i, Quantification of the percentage of CTB engulfment within individual microglia volume for hC4A/− (n = 3) and hC4A/A (n = 4) mice (three independent experiments; unpaired, two-tailed t-test, **P = 0.0060). Bar graphs show the mean ± s.e.m.
Fig. 4 |
Fig. 4 |. hC4A-overexpressing mice have increased synaptic material uptake by microglia in the mPFC.
a, Schematic of the experiment. The role of C4A was examined in the mPFC across different time points for protein expression and microglia engulfment. Further microglia analyses were conducted at the adolescence stage for synaptic material engulfment. b, C4 protein expression in the forebrain was measured by ELISA for hC4A/− (n = 6) and hC4A/A (n = 3) mice at different time points: development (P10), adolescence (P40) and adulthood (P60; two-way ANOVA with Sidak’s multiple comparisons test, ****P < 0.0001, *P = 0.0322). c,d, Microglia engulfment in the mPFC was analyzed using Iba1+ and CD68+ markers across different time points. The peak difference between hC4A/− and hC4A/A mice was observed at the adolescence stage (P40). c, Quantification of CD68+ puncta area per microglia using Cell Profiler at P10 (hC4A/− (301 microglia), hC4A/A (368 microglia)), P40 (hC4A/− (265 microglia), hC4A/A (320 microglia)) and P60 time points (hC4A/− (104 microglia), hC4A/A (121 microglia); two-way ANOVA with Sidak’s multiple comparisons test; xy plot shows the mean ± s.e.m. ***P = 0.001, ****P < 0.0001). d, Representative images of microglia with the CD68 signature. White arrowheads indicate CD68+ puncta in microglia. Scale bar, 20 μm. e,f, Comparison of microglial engulfment in the FC of P40 hC4A/− (n = 6) and hC4A/A (n = 8) mice. e, Purified microglia were intracellularly stained for the detection of SV2 synaptic protein. The gating strategy for microglia is shown (CD45low and CD11bhigh). f, The SV2 mean fluorescence intensity (MFI) was measured in hC4A/− (n = 6) and hC4A/A (n = 8) mice (three independent experiments; Mann–Whitney test, two-tailed, **P = 0.0047). Bar graphs show the mean ± s.e.m.
Fig. 5 |
Fig. 5 |. Adult hC4A-overexpressing mice have decreased synapse density in the mPFC.
a, Schematic of the experiment. The extent of synaptic pruning in the mPFC was evaluated by synapse-density quantification at different time points (P10, P40, P60 and P180). b, Synapses are defined as SV2+ and Homer-1+ colocalized puncta (indicated by white circles) in P60 hC4A/− and hC4A/A mice. Scale bar, 10 μm. ce, Synapse-density quantification by immunofluorescence in the mPFC at P10 (c), P40 (d) and P60 (e) mice showed a reduction in hC4A/A mice only at the P60 time point. All results were normalized to the C4−/− group to retain littermate controls. c, Synapse density in the mPFC of P10 WT (n = 3), C4−/− (n = 5), hC4A/− (n = 8) and hC4A/A (n = 3) mice was quantified (3–4 FOVs per mouse; 4 independent cohorts; Kruskal–Wallis test with Dunn’s multiple comparisons test). d, Synapse density in the mPFC of P40 WT (n = 3), C4−/− (n = 6), hC4A/− (n = 6) and hC4A/A (n = 3) mice was quantified (3–4 FOVs per mouse; 4 independent cohorts; ordinary one-way ANOVA with Tukey’s multiple comparisons test). e, Synapse density in the mPFC of P60 WT (n = 3), C4−/− (n = 11), hC4A/− (n = 13) and hC4A/A (n = 6) mice was quantified (3–4 FOVs per mouse; 5 independent cohorts; Kruskal–Wallis test with Dunn’s multiple comparisons test, ***P = 0.0007, **P = 0.0039). f, Golgi staining was used to identify pyramidal neurons in the mPFC (left and middle), and high-magnification imaging revealed dendritic spines (right; red arrowheads) in P180 hC4A/− and hC4A/A mice. Scale bar, 10 μm. g, The spine density for each neuron is represented (5–6 neurons per mouse from 5 hC4A/− and 5 hC4A/A littermates from 2 independent cohorts; Mann–Whitney test, two-tailed, ****P < 0.0001). Bar graphs show the mean ± s.e.m. Box-and-whisker plots display the median (center line), the 25th to 75th percentile (box), and minimum to maximum values (whiskers).
Fig. 6 |
Fig. 6 |. Human C4A overexpression alters mouse behavior.
a,b, Mice were tested for social-interaction behavior with the three-chambers test. a, Representative heatmaps of the three-chambers test during the habituation period, when mice travel the same amount of time in each chamber, and during the test period, when WT mice spend more time interacting with stranger mouse (right chamber) than with an object (left chamber). b, Representation of the amount of time spent interacting with a novel object (red) or a stranger mouse (blue) for WT ( n = 8), C4−/− (n = 22), hC4A/− (n = 16) and hC4A/A (n = 12) mice (two-way ANOVA with Sidak’s multiple comparisons test, ***PWT = 0.0002, ****P < 0.0001). c,d, The anxiety-like phenotype was tested with the open-field test. c, Representative map of the arena, divided into two zones: center and periphery. d, The percentage of vertical counts in the center for WT (n = 8), C4−/− (n = 20), hC4A/− (n = 8) and hC4A/A (n = 7) mice (results were normalized to the C4−/− group to retain littermate controls; two-tailed Mann–Whitney test, **PWT versus hC4A/A = 0.0022, **PC4−/−vs hC4A/A = 0.0093, *PhC4A/−vs hC4A/A = 0.0140). e,f, Short-term memory was tested using the novel Y-maze. e, Representative heatmaps of the novel Y-maze test during the habituation period, when mice are only allowed to travel in an open arm (right arm), and the during test period, when WT mice spend more time in the novel arm (left arm). f, Distance traveled in the familiar (red) and the novel arm (blue) for WT (n = 8), C4−/− (n = 24), hC4A/− (n = 19) and hC4A/A (n = 10) mice (two-way ANOVA with Sidak’s multiple comparisons test, ****P < 0.0001, **PhC4A/− = 0.0034). For all behavior analyses, WT and C4−/−, and C4−/− and hC4A transgenic mice littermates (two cohorts) were used. Bar graph shows the mean ± s.e.m.

Comment in

References

    1. Cannon TD et al. Cortex mapping reveals regionally specific patterns of genetic and disease-specific gray-matter deficits in twins discordant for schizophrenia. Proc. Natl Acad. Sci. USA 99, 3228–3233 (2002). - PMC - PubMed
    1. Cannon TD et al. Progressive reduction in cortical thickness as psychosis develops: a multisite longitudinal neuroimaging study of youth at elevated clinical risk. Biol. Psychiatry 77, 147–157 (2015). - PMC - PubMed
    1. Glantz LA & Lewis DA Decreased dendritic spine density on prefrontal cortical pyramidal neurons in schizophrenia. Arch. Gen. Psychiatry 57, 65–73 (2000). - PubMed
    1. Glausier JR & Lewis DA Dendritic spine pathology in schizophrenia. Neuroscience 251, 90–107 (2013). - PMC - PubMed
    1. Feinberg I. Schizophrenia: caused by a fault in programmed synaptic elimination during adolescence? J. Psychiatr. Res 17, 319–334 (1982). - PubMed

Publication types

MeSH terms