[Preprint]. 2020 Dec 18:2020.12.16.20248294.
doi: 10.1101/2020.12.16.20248294.

Antibody responses to endemic coronaviruses modulate COVID-19 convalescent plasma functionality

Affiliations

Antibody responses to endemic coronaviruses modulate COVID-19 convalescent plasma functionality

William Morgenlander et al. medRxiv. .

Update in

  • Antibody responses to endemic coronaviruses modulate COVID-19 convalescent plasma functionality.
    Morgenlander WR, Henson SN, Monaco DR, Chen A, Littlefield K, Bloch EM, Fujimura E, Ruczinski I, Crowley AR, Natarajan H, Butler SE, Weiner JA, Li MZ, Bonny TS, Benner SE, Balagopal A, Sullivan D, Shoham S, Quinn TC, Eshleman SH, Casadevall A, Redd AD, Laeyendecker O, Ackerman ME, Pekosz A, Elledge SJ, Robinson M, Tobian AA, Larman HB. Morgenlander WR, et al. J Clin Invest. 2021 Apr 1;131(7):e146927. doi: 10.1172/JCI146927. J Clin Invest. 2021. PMID: 33571169 Free PMC article.

Abstract

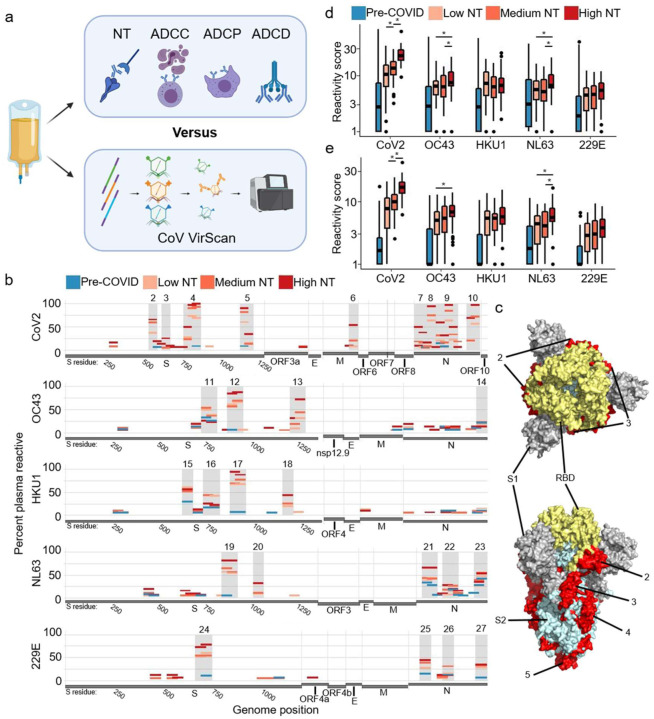
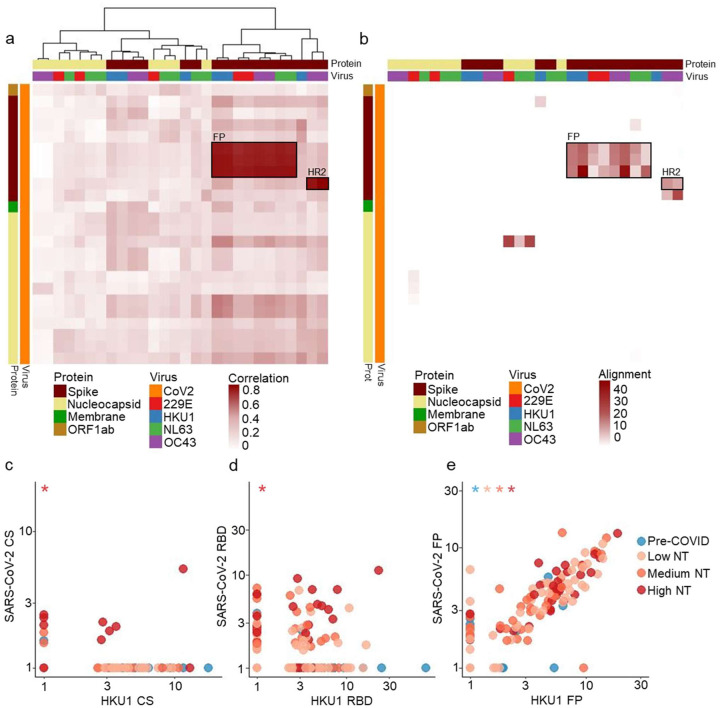
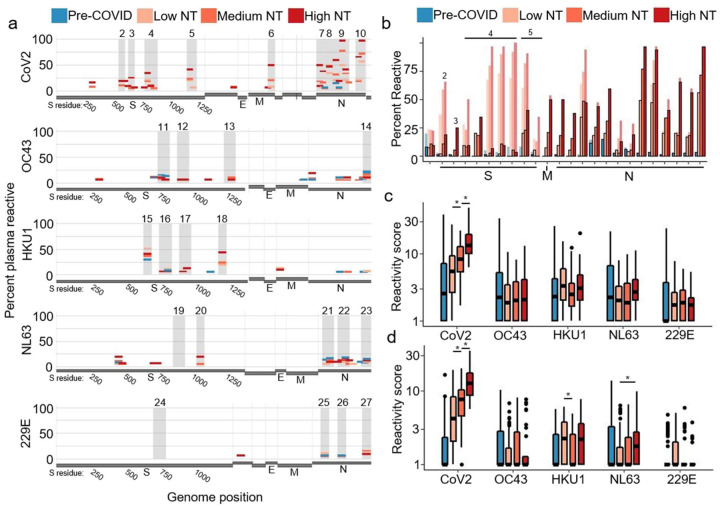
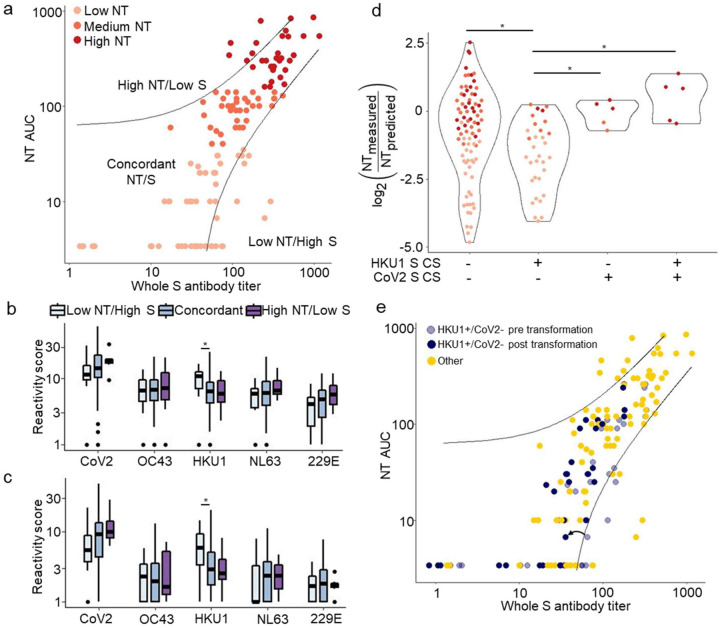
COVID-19 convalescent plasma, particularly plasma with high-titer SARS-CoV-2 (CoV2) antibodies, has been successfully used for treatment of COVID-19. The functionality of convalescent plasma varies greatly, but the association of antibody epitope specificities with plasma functionality remains uncharacterized. We assessed antibody functionality and reactivities to peptides across the CoV2 and the four endemic human coronavirus (HCoV) genomes in 126 COVID-19 convalescent plasma donations. We found strong correlation between plasma functionality and polyclonal antibody targeting of CoV2 spike protein peptides. Antibody reactivity to many HCoV spike peptides also displayed strong correlation with plasma functionality, including pan-coronavirus cross-reactive epitopes located in a conserved region of the fusion peptide. After accounting for antibody cross-reactivity, we identified an association between greater alphacoronavirus NL63 antibody responses and development of highly neutralizing antibodies to SARS-CoV-2. We also found that plasma preferentially reactive to the CoV2 receptor binding domain (RBD), versus the betacoronavirus HKU1 RBD, had higher neutralizing titer. Finally, we developed a two-peptide serosignature that identifies plasma donations with high anti-S titer but that suffer from low neutralizing activity. These results suggest that analysis of coronavirus antibody fine specificities may be useful for selecting therapeutic plasma with desired functionalities.


Conflict of interest statement

Conflicts of Interest

H.B.L. and S.J.E. are inventors on a patent application (US20160320406A) filed by Brigham and Women’s Hospital that covers the use of the VirScan technology to identify pathogen antibodies and are founders of ImmuneID. H.B.L. is a founder of Alchemab and is an advisor to CDI Laboratories and TSCAN Therapeutics. S.J.E. is a founder of TSCAN Therapeutics, MAZE Therapeutics and Mirimus. S.J.E. serves on the scientific advisory board of Homology Medicines, TSCAN Therapeutics, MAZE, XChem, and is an advisor for MPM. S.S. has received grants from Ansun, Astrellas, Cidara, F2G, Merck, T2, Reviral, Shire, Shionogi, and Scynexis. S.S has received personal fees from Acidophil, Amplyx, Janssen, Merck, Reviral, Karyopharm, Intermountain Health, and Immunome.

Figures

Figure 1.
Figure 1.. Correlating coronavirus peptide reactivity and neutralizing titer of COVID-19 convalescent plasma
a. 126 COVID-19 convalescent plasma donations underwent functional analysis and antibody profiling via VirScan with a comprehensive coronavirus peptide library. Functionalities included neutralizing titer (NT), antibody dependent cellular cytotoxicity (ADCC), antibody dependent cellular phagocytosis (ADCP), and antibody dependent complement deposition (ADCD). Plasma from 87 pre-pandemic controls were additionally analyzed via VirScan. b. Convalescent plasma was divided into groups based on NT AUC (Low NT: <40 − n=55, Medium NT: 40 to 160 − n=39, and High NT: ≥160 − n=32). The percentages of samples in each group with reactivity to a particular peptide were plotted according to the peptide’s position along each viral genome. Regions with most consistent reactivity were shaded and were located in S and N. Amino acid residue number is included for S. Full genome plots are shown in Figure S1. c. Immunodominant regions of CoV2 S are mapped onto the CoV2 S structure. (31) Trimeric spike is colored by S1 subunit and S2 subunit with the entire receptor binding domain (RBD) indicated. d. Aggregate virus score was calculated as the sum of all log-transformed fold changes of peptides designed for a given virus. Bars with an asterisk indicate convalescent plasma groups that had significantly different scores (two sided Wilcox test, p<0.05) e. Aggregate virus scores from peptides defining dominant regions.
Figure 2.
Figure 2.. Reactivities against some CoV2 peptides are highly correlated with reactivities against homologous HCoV peptides
a. Spearman correlation coefficient matrix between dominant CoV2 peptides and dominant HCoV peptides is shown in the form of a clustered heatmap. CoV2 peptides (y-axis) are ordered by genomic location from top to bottom, while HCoV peptides (x-axis) were clustered according to their correlations. The heatmap annotations depict peptides’ overall frequency of antibody reactivity, protein of origin, and virus of origin. Highly correlated peptides map to Fusion Peptide (FP) or Heptad Repeat 2 (HR2) b. Sequence similarity (as defined by the negative log of the blastp evalue) between dominant CoV2 peptides in CoV2 and dominant HCoV peptides is shown. The rows and columns of the heatmap match those of the correlation heatmap to facilitate comparison. The regions of highest correlation (boxes as in a) show strongest alignment. c-e. Antibody reactivity (measured as fold changes) to three HKU1 S peptides are plotted against reactivity to homologous peptides of CoV2 S. The two CS peptides have no sequence homology and their reactivity is not correlated. The two RBD peptides have moderate homology and show frequent co-reactivity but no strong correlation. The two FP peptides have high sequence homology and strong correlation among all sample groups. Asterisks indicate Pearson correlation with nonzero coefficient for a given plasma group (p<0.05).
Figure 3.
Figure 3.. Deconvolution of convalescent plasma reactivities
a. Following deconvolution, the percentage of samples in each sample group with target-preferred peptide reactivities were plotted along the viral genomes. Amino acid residue number is included for S. b. The percentage of plasma in each sample group that had reactivity to dominant CoV2 peptides is shown before (light bars) and after (dark bars with outline) deconvolution. c-d. Aggregate virus scores were calculated following deconvolution, using all peptides (c) or using only peptides from immunodominant regions (d). Bars with an asterisk indicate convalescent plasma groups that show significantly different scores (two sided wilcox test, p<0.05)
Figure 4.
Figure 4.. VirScan identifies features associated with discordance between whole spike titer and NT AUC
a. NT AUC was plotted against whole S antibody titer. A linear regression was performed between whole S and NT AUC to establish a predicted NT AUC; guidelines were plotted to indicate samples displaying large discordance between NT AUC and whole S titer (Methods). b-c. Aggregate virus scores were calculated for plasma donations with concordant NT/S, discordantly Low NT/S, and discordantly High NT/S using pre (b) and post (c) deconvolution peptide reactivity. Bars indicate differences in aggregate scores between groups (Wilcox Rank Sum, p<0.05) d. Ratio of measured NT AUC to predicted NT AUC, versus CoV2 CS and HKU1 CS reactivities. Bars with an asterisk indicate plasma groups that show significantly different scores (Two sided wilcox test, p<0.05) e. Plasma defined by the HKU1 CS+/CoV2 CS− reactivity pattern are shown on the scatter plot in a. A correction factor (example indicated by arrow) was applied to these plasma to account for the association with NT/S discordance.

References

    1. Dong E, Du H, and Gardner L. An interactive web-based dashboard to track COVID-19 in real time. The Lancet Infectious Diseases. 2020;20(5):533–4. - PMC - PubMed
    1. Bloch EM, Goel R, Montemayor C, Cohn C, and Tobian AAR. Promoting access to COVID-19 convalescent plasma in low- and middle-income countries. Transfus Apher Sci. 2020:102957. - PMC - PubMed
    1. Bloch EM, Shoham S, Casadevall A, Sachais BS, Shaz B, Winters JL, et al. Deployment of convalescent plasma for the prevention and treatment of COVID-19. J Clin Invest. 2020;130(6):2757–65. - PMC - PubMed
    1. Duan K, Liu B, Li C, Zhang H, Yu T, Qu J, et al. Effectiveness of convalescent plasma therapy in severe COVID-19 patients. Proc Natl Acad Sci U S A. 2020;117(17):9490–6. - PMC - PubMed
    1. Joyner MJ, Senefeld JW, Klassen SA, Mills JR, Johnson PW, Theel ES, et al. Effect of Convalescent Plasma on Mortality among Hospitalized Patients with COVID-19: Initial Three-Month Experience. medRxiv. 2020.

Publication types