

Real-World Infliximab Pharmacokinetic Study Informs an Electronic Health Record-Embedded Dashboard to Guide Precision Dosing in Children with Crohn's Disease
- PMID: 33354765
- PMCID: PMC8159860
- DOI: 10.1002/cpt.2148
Real-World Infliximab Pharmacokinetic Study Informs an Electronic Health Record-Embedded Dashboard to Guide Precision Dosing in Children with Crohn's Disease
Abstract
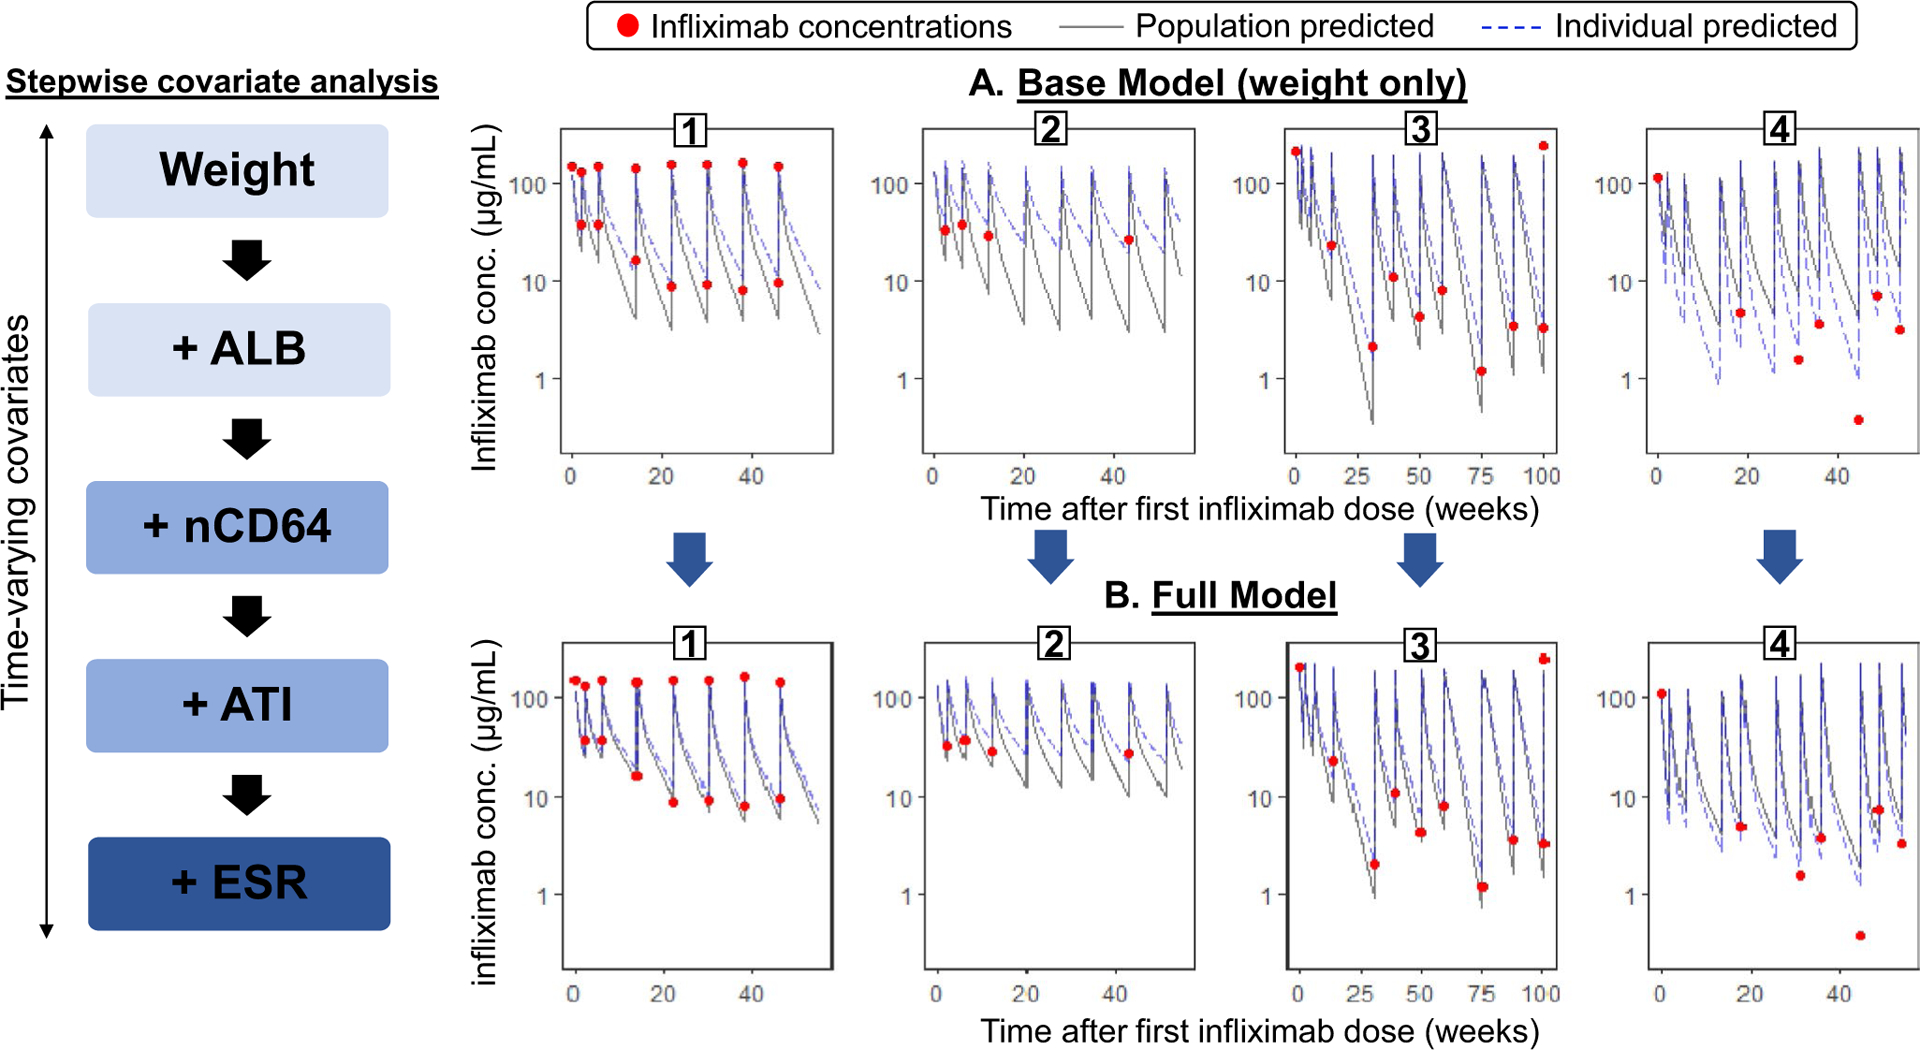
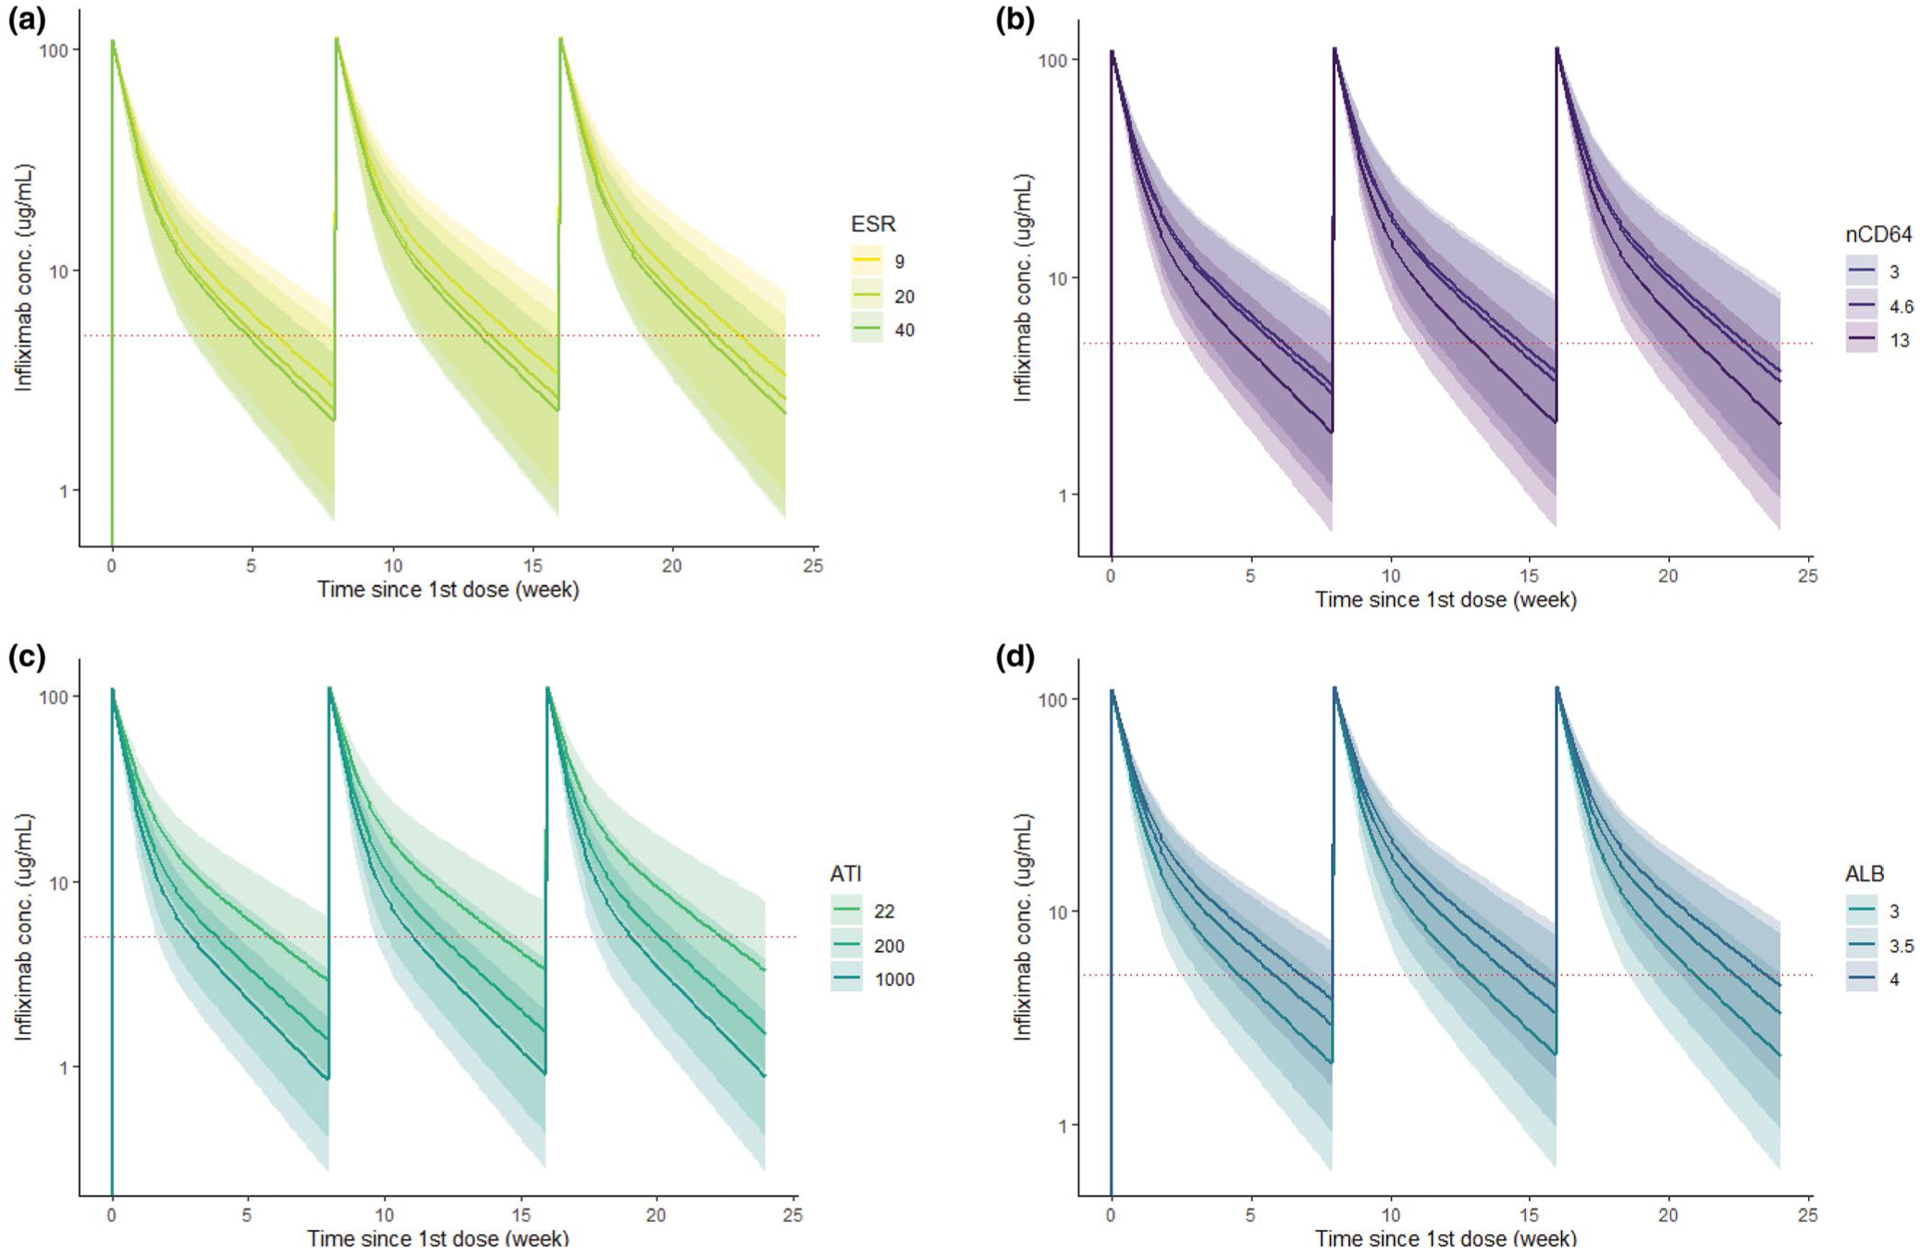
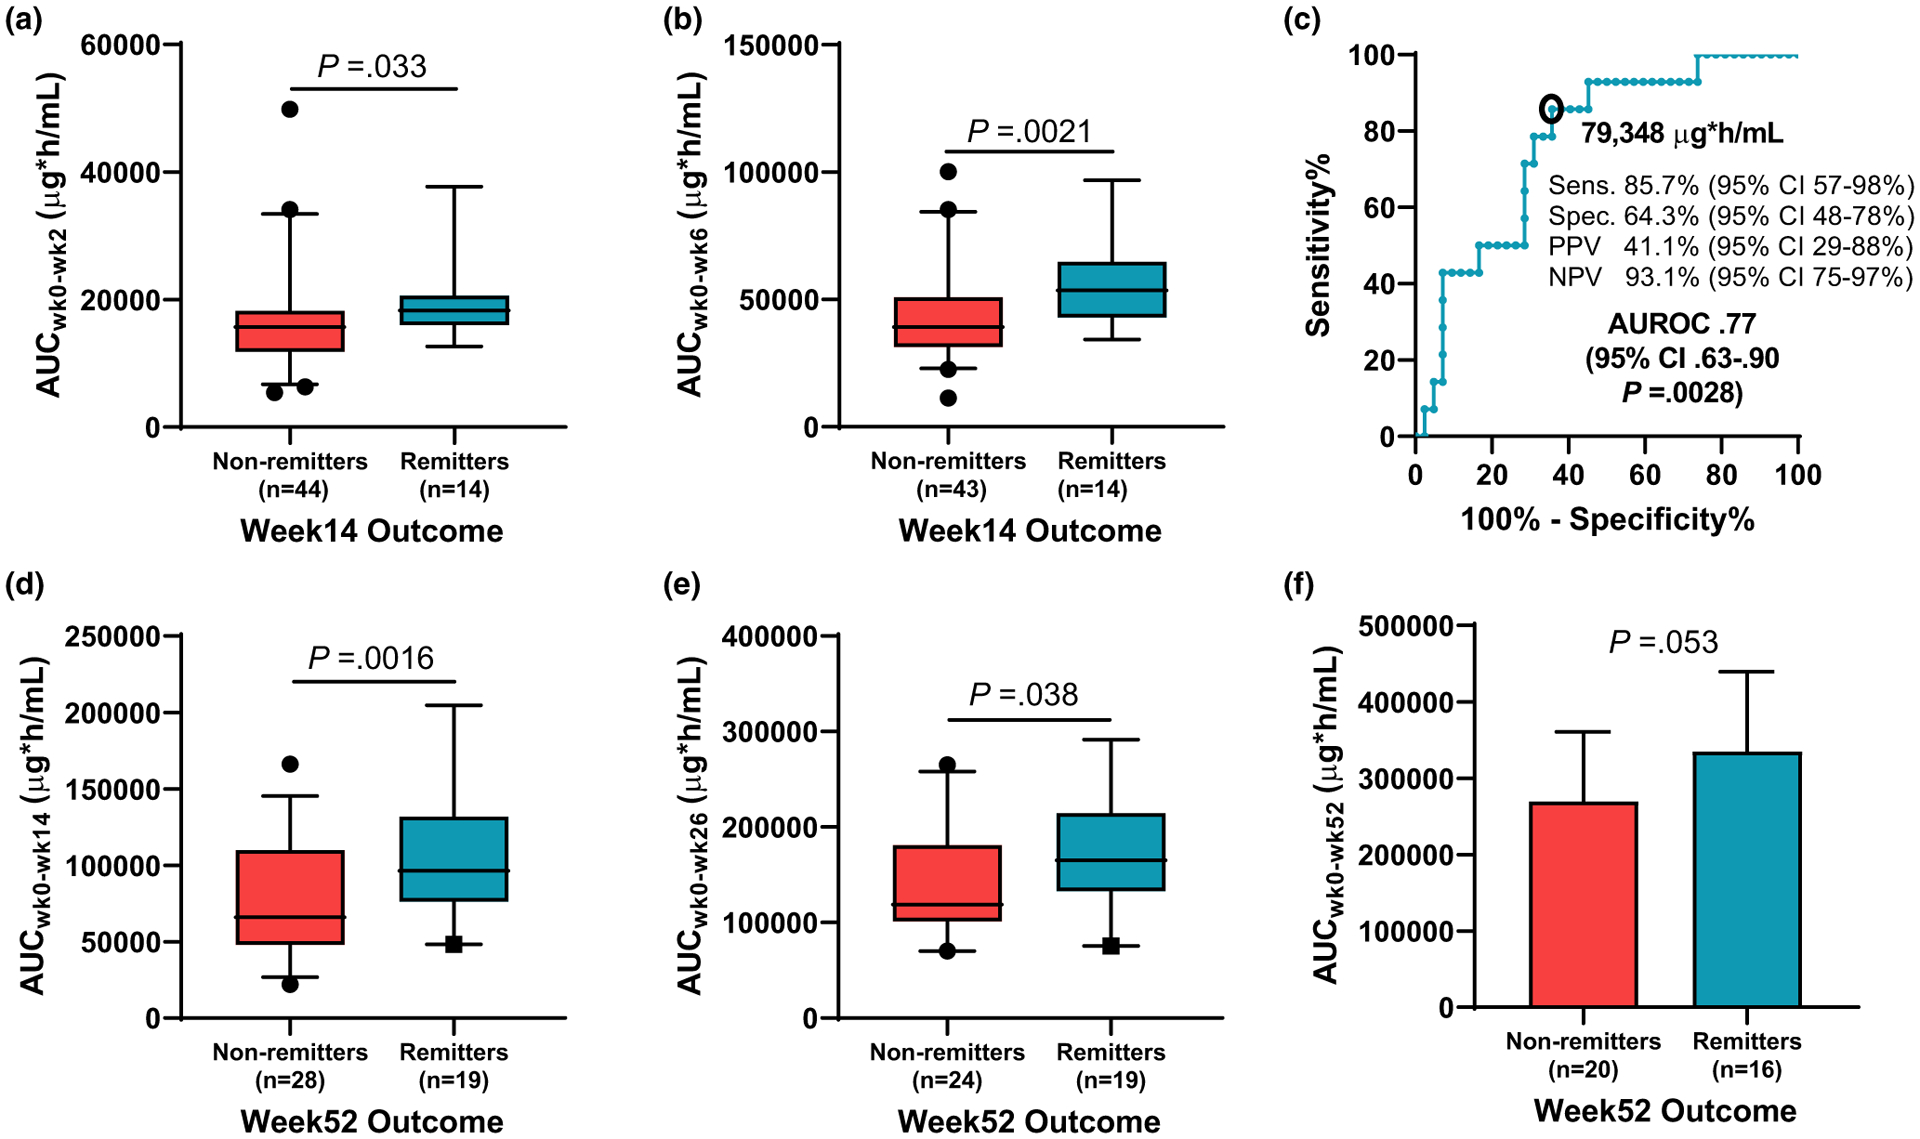
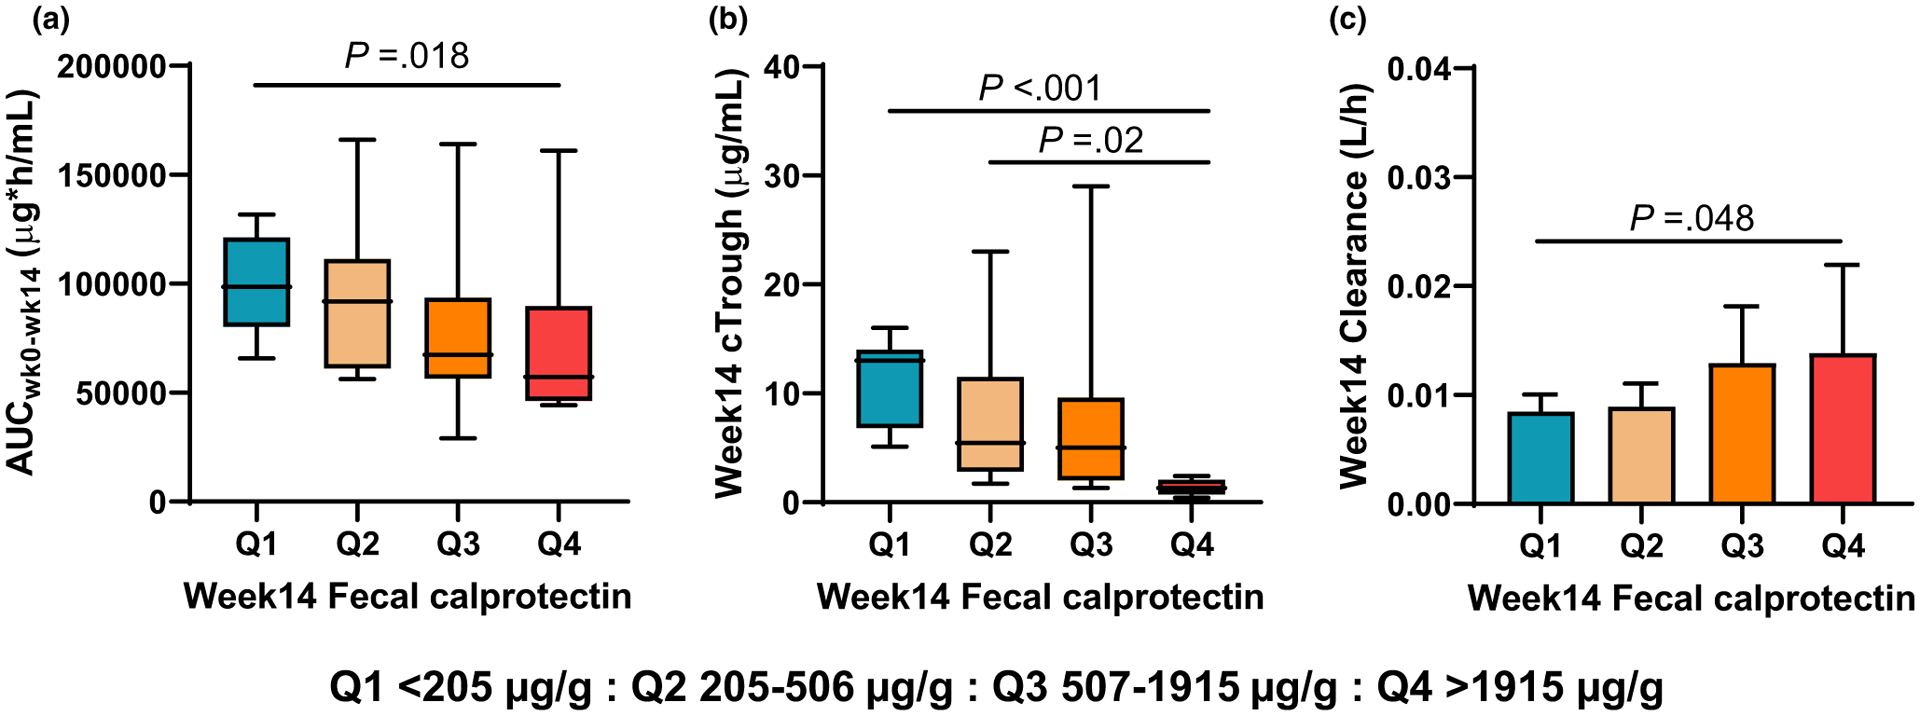
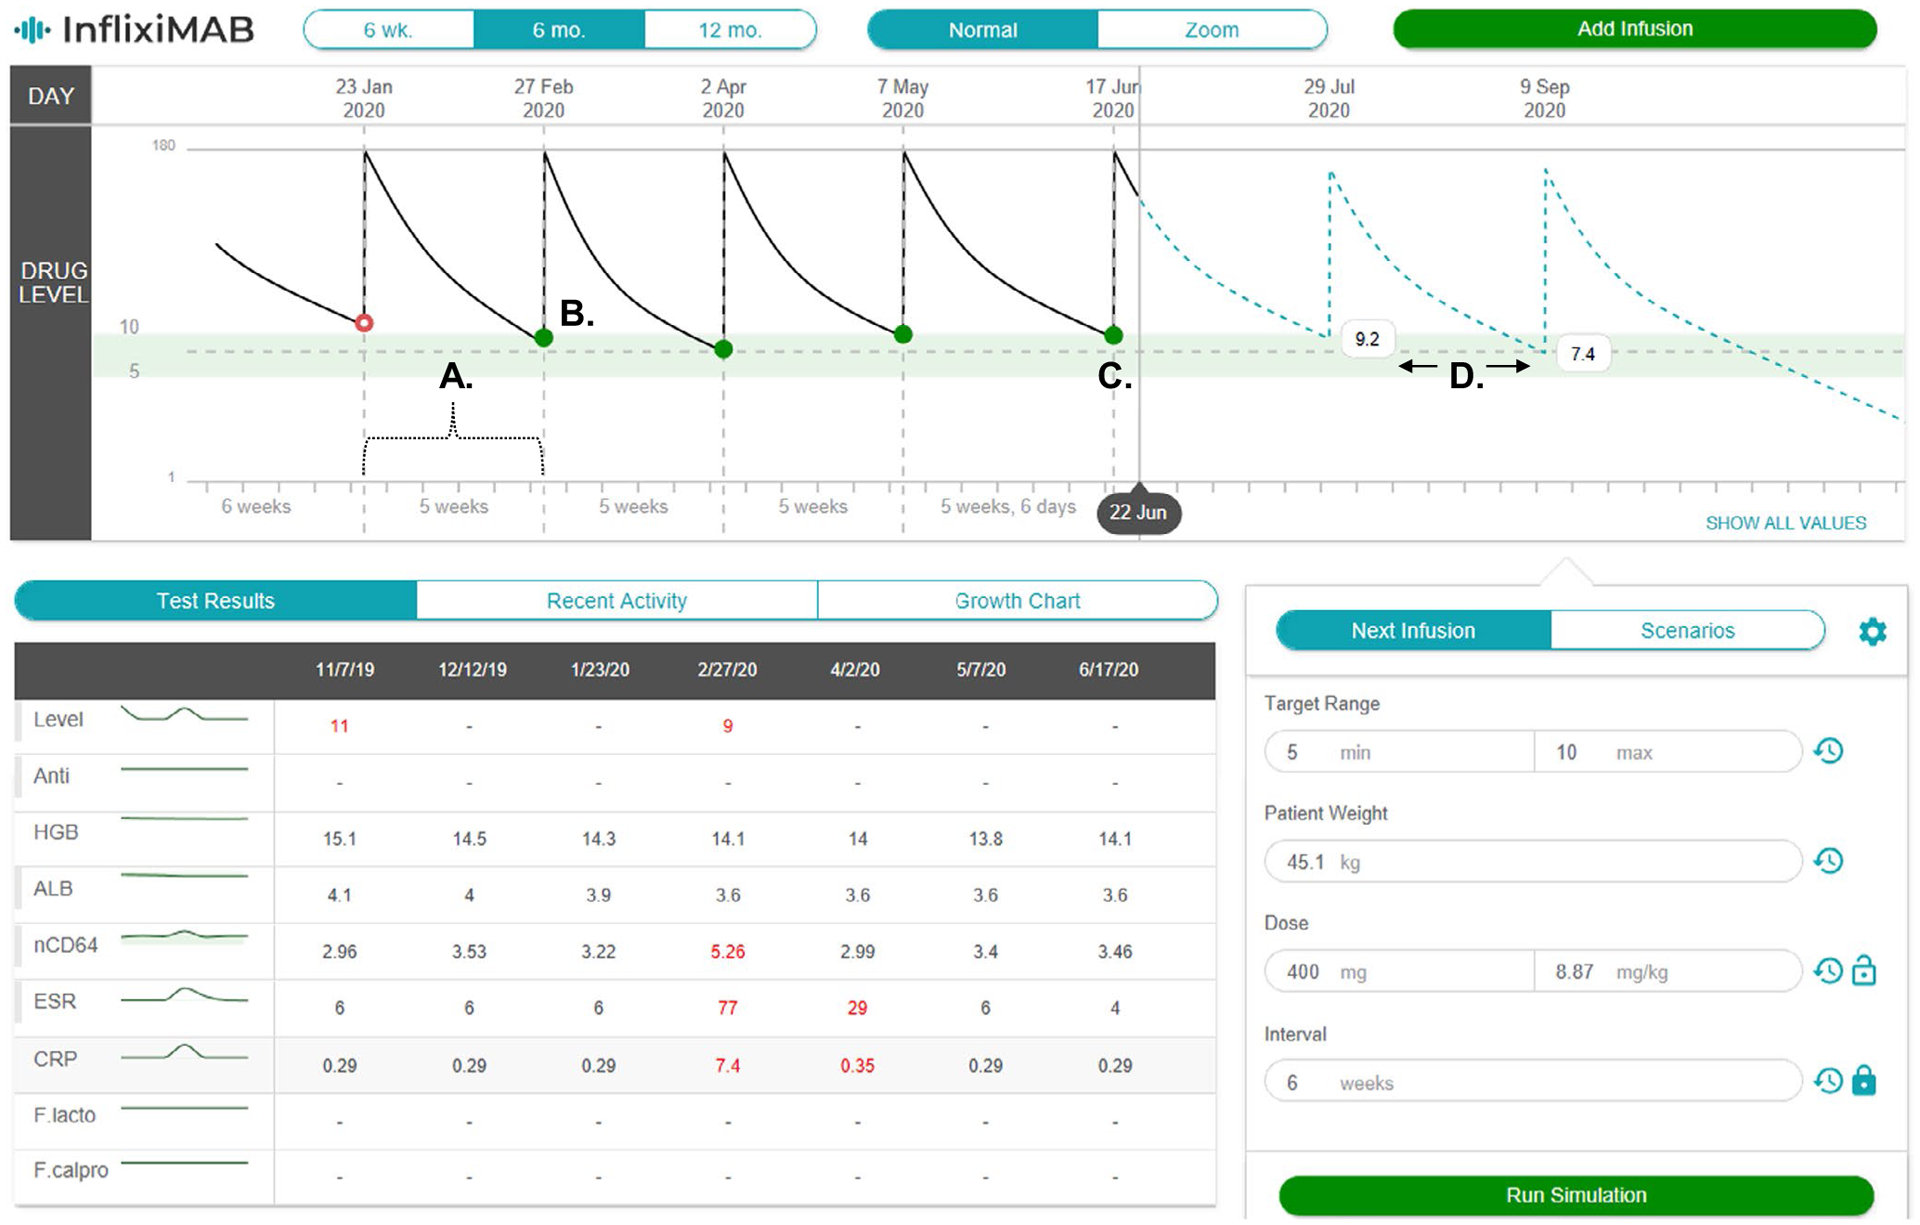
Standard-of-care infliximab dosing regimens were developed prior to the routine use of therapeutic drug monitoring and identification of target concentrations. Not surprisingly, subtherapeutic infliximab concentrations in pediatric Crohn's disease (CD) are common. The primary aim was to conduct a real-world pharmacokinetic (PK) evaluation to discover blood biomarkers of rapid clearance, identify exposure targets, and a secondary aim to translate PK modeling to the clinic. In a multicenter observational study, 671 peak and trough infliximab concentrations from 78 patients with CD were analyzed with a drug-tolerant assay (Esoterix; LabCorp, Calabasas, CA). Individual area under the curve (AUC) estimates were generated as a measure of drug exposure over time. Population PK modeling (nonlinear mixed-effect modeling) identified serum albumin, antibody to infliximab, erythrocyte sedimentation rate (ESR), and neutrophil CD64 as biomarkers for drug clearance. Week 14 and week 52 biochemical remitters (fecal calprotectin < 250 µg/g) had higher infliximab exposure (AUC) throughout induction. The optimal infliximab AUC target during induction for week 14 biochemical remission was 79,348 µg*h/mL (area under the receiver operating characteristic curve (AUROC) 0.77, [0.63-0.90], 85.7% sensitive, and 64.3% specific) with those exceeding the AUC target more likely to achieve a surgery-free week 52 biochemical remission (OR 4.3, [1.2-14.6]). Pretreatment predictors for subtherapeutic week 14 AUC included neutrophil CD64 > 6 (OR 4.5, [1.4-17.8]), ESR > 30 mm/h (OR 3.8, [1.4-11]), age < 10 years old (OR 4.2, [1.2-20]), and weight < 30 kg (OR 6.6, [2.1-25]). We created a decision-support PK dashboard with an iterative process and embedded the modeling program within the electronic health record. Model-informed precision dosing guided by real-world PKs is now available at the bedside in real-time.
© 2020 The Authors. Clinical Pharmacology & Therapeutics © 2020 American Society for Clinical Pharmacology and Therapeutics.
Conflict of interest statement
CONFLICT OF INTEREST
N.P. is president of Medimatics, a company that provides consulting services on medical information systems. All other authors declared no competing interests for this work.
Figures
References
-
- Cosnes J, Gower-Rousseau C, Seksik P & Cortot A Epidemiology and natural history of inflammatory bowel diseases. Gastroenterology 140, 1785–1794 (2011). - PubMed
-
- Hyams J et al. Induction and maintenance infliximab therapy for the treatment of moderate-to-severe Crohn’s disease in children. Gastroenterology 132, 863–873 (2007), quiz 1165–1166. - PubMed
-
- Casellas F et al. Restoration of quality of life of patients with inflammatory bowel disease after one year with antiTNFalpha treatment. J. Crohns Colitis 6, 881–886 (2012). - PubMed
Publication types
MeSH terms
Substances
Supplementary concepts
Grants and funding
LinkOut - more resources
Full Text Sources
Other Literature Sources
Medical
Research Materials
Miscellaneous
