

Mitochondrial DNA variants in inclusion body myositis characterized by deep sequencing
- PMID: 33354847
- PMCID: PMC8412083
- DOI: 10.1111/bpa.12931
Mitochondrial DNA variants in inclusion body myositis characterized by deep sequencing
Abstract
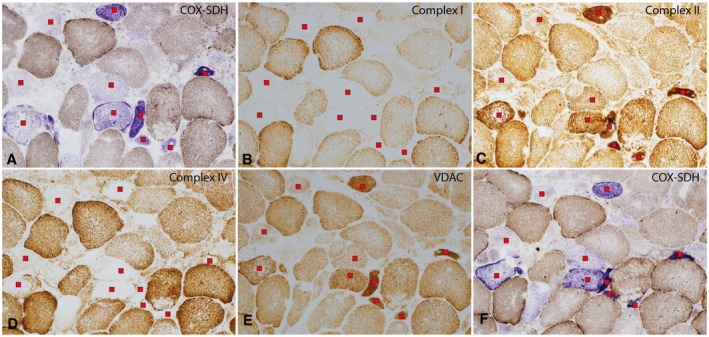
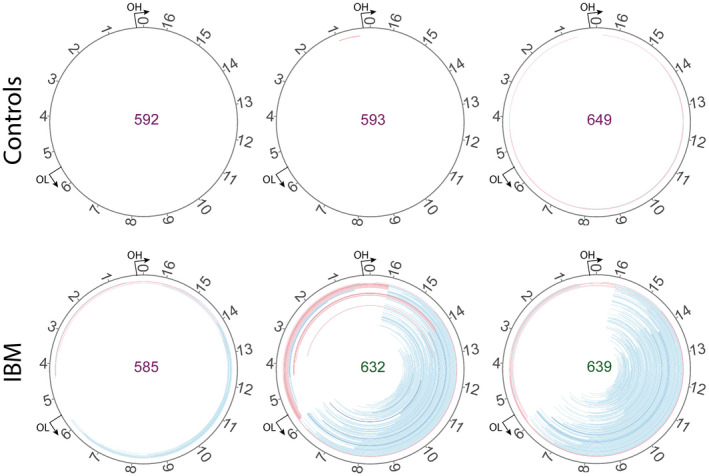
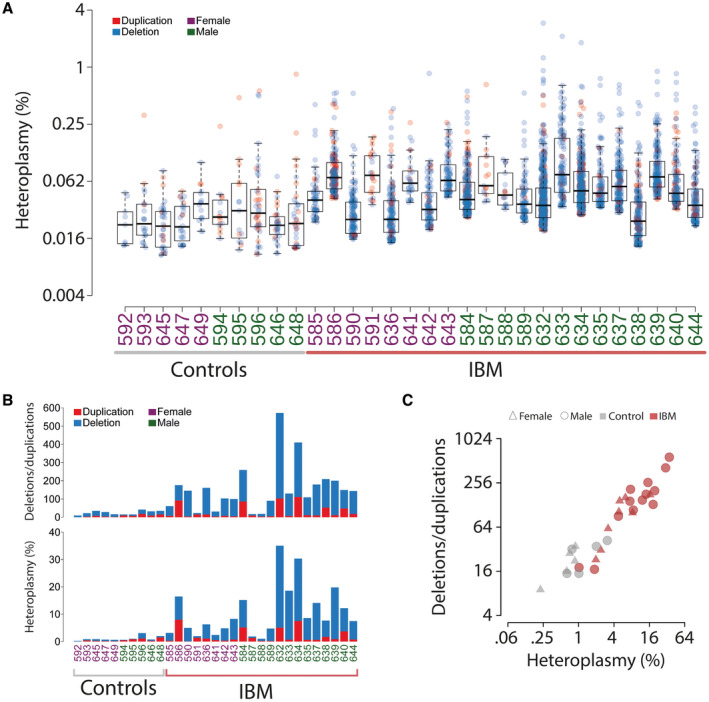
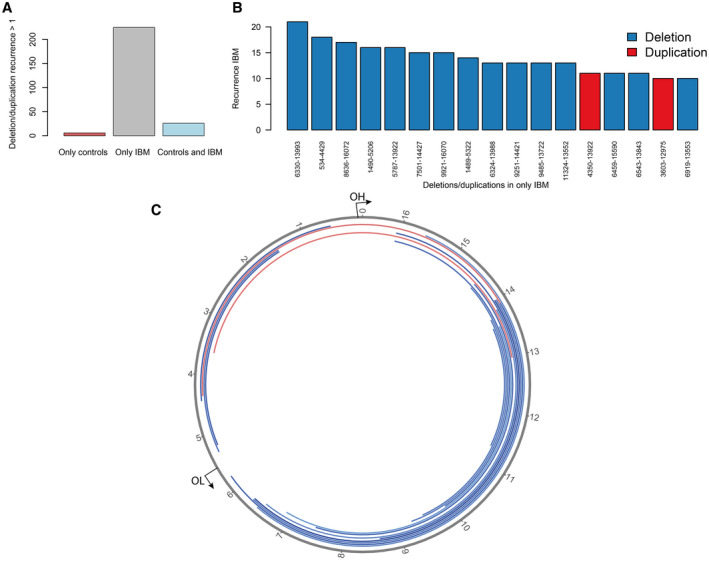
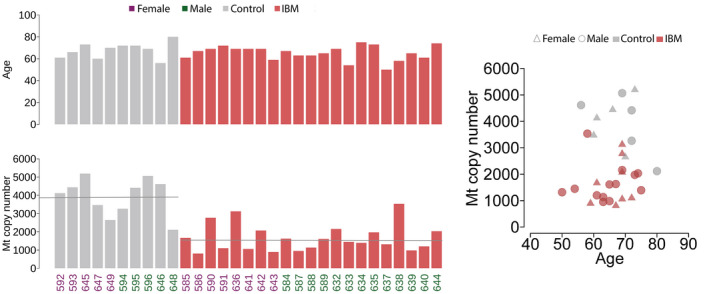
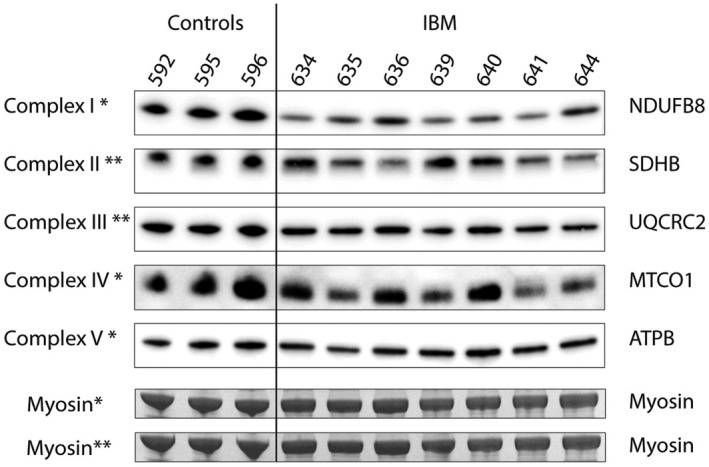
Muscle pathology in inclusion body myositis (IBM) typically includes inflammatory cell infiltration, muscle fibers with rimmed vacuoles and cytochrome c oxidase (COX)-deficient fibers. Previous studies have revealed clonal expansion of large mitochondrial DNA (mtDNA) deletions in the COX-deficient muscle fibers. Technical limitations have prevented complete investigations of the mtDNA deletions and other mtDNA variants. Detailed characterization by deep sequencing of mtDNA in muscle samples from 21 IBM patients and 10 age-matched controls was performed after whole genome sequencing with a mean depth of mtDNA coverage of 46,000x. Multiple large mtDNA deletions and duplications were identified in all IBM and control muscle samples. In general, the IBM muscles demonstrated a larger number of deletions and duplications with a mean heteroplasmy level of 10% (range 1%-35%) compared to controls (1%, range 0.2%-3%). There was also a small increase in the number of somatic single nucleotide variants in IBM muscle. More than 200 rearrangements were recurrent in at least two or more IBM muscles while 26 were found in both IBM and control muscles. The deletions and duplications, with a high recurrence rate, were mainly observed in three mtDNA regions, m.534-4429, m.6330-13993, and m.8636-16072, where some were flanked by repetitive sequences. The mtDNA copy number in IBM muscle was reduced to 42% of controls. Immunohistochemical and western blot analyses of IBM muscle revealed combined complex I and complex IV deficiency affecting the COX-deficient fibers. In conclusion, deep sequencing and quantitation of mtDNA variants revealed that IBM muscles had markedly increased levels of large deletions and duplications, and there were also indications of increased somatic single nucleotide variants and reduced mtDNA copy numbers compared to age-matched controls. The distribution and type of variants were similar in IBM muscle and controls indicating an accelerated aging process in IBM muscle, possibly associated with chronic inflammation.
Keywords: inclusion body myositis; mitochondrial DNA; mtDNA deletions; mtDNA duplications; mtDNA point mutations; mtDNA rearrangements; muscle disease.
© 2020 The Authors. Brain Pathology published by John Wiley & Sons Ltd on behalf of International Society of Neuropathology.
Conflict of interest statement
The authors declare no conflict of interest.
Figures
References
-
- Tawil R, Griggs RC. Inclusion body myositis. Curr Opin Rheumatol. 2002;14(6):653–7. - PubMed
-
- Benveniste O, Guiguet M, Freebody J, Dubourg O, Squier W, Maisonobe T, et al. Long‐term observational study of sporadic inclusion body myositis. Brain. 2011;134(Pt 11):3176–84. - PubMed
-
- Greenberg SA. Inclusion body myositis: clinical features and pathogenesis. Nat Rev Rheumatol. 2019;15(5):257–72. - PubMed
-
- Lindberg C, Persson L, Björkander J, Oldfors A. Inclusion body myositis ‐ clinical, morphological, physiological and laboratory findings in 18 cases. Acta Neurol Scand. 1994;89(2):123–31. - PubMed
-
- Mastaglia FL, Needham M. Inclusion body myositis: a review of clinical and genetic aspects, diagnostic criteria and therapeutic approaches. J Clin Neurosci. 2015;22(1):6–13. - PubMed
Publication types
MeSH terms
Substances
LinkOut - more resources
Full Text Sources
Other Literature Sources
