. 2021 Feb 15;34(2):529-540.
doi: 10.1021/acs.chemrestox.0c00368. Epub 2020 Dec 23.

Impact of Sequencing Depth and Library Preparation on Toxicological Interpretation of RNA-Seq Data in a "Three-Sample" Scenario

Affiliations

Impact of Sequencing Depth and Library Preparation on Toxicological Interpretation of RNA-Seq Data in a "Three-Sample" Scenario

Dongying Li et al. Chem Res Toxicol. .

Abstract

While RNA-sequencing (RNA-seq) has emerged as a standard approach in toxicogenomics, its full potential in gaining underlying toxicological mechanisms is still not clear when only three biological replicates are used. This "three-sample" study design is common in toxicological research, particularly in animal studies during preclinical drug development. Sequencing depth (the total number of reads in an experiment) and library preparation are critical to the resolution and integrity of RNA-seq data and biological interpretation. We used aflatoxin b1 (AFB1), a model toxicant, to investigate the effect of sequencing depth and library preparation in RNA-seq on toxicological interpretation in the "three-sample" scenario. We also compared different gene profiling platforms (RNA-seq, TempO-seq, microarray, and qPCR) using identical liver samples. Well-established mechanisms of AFB1 toxicity served as ground truth for our comparative analyses. We found that a minimum of 20 million reads was sufficient to elicit key toxicity functions and pathways underlying AFB1-induced liver toxicity using three replicates and that identification of differentially expressed genes was positively associated with sequencing depth to a certain extent. Further, our results showed that RNA-seq revealed toxicological insights from pathway enrichment with overall higher statistical power and overlap ratio, compared with TempO-seq and microarray. Moreover, library preparation using the same methods was important to reproducing the toxicological interpretation.


Conflict of interest statement

The authors declare no competing financial interest.

Figures
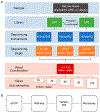
Figure 1.
Figure 1.
Overview of study design. (A) RNA samples were extracted from livers of Sprague–Dawley rats exposed for 5 days to 0.3 mg/kg AFB1 or vehicle control at three rats per group. Two libraries were constructed in two separate batches, one month apart. RNA-seq was performed using Illumina HiSeq2000 for Lib1 and Illumina HiScanSQ for both Lib1 and Lib2. HiSeq2000 yielded approximately twice as many reads as HiScanSQ. The resulting three data sets, Lib1_HiSeq2000, Lib1_HiScanSQ, and Lib2_HiScanSQ, were combined to create the Combo data set. The aggregated reads in the Combo data set were used for subsampling to produce 20, 40, 60, 80, and 100 M reads per sample, respectively. (B) As a reference point, results from RNA-seq plotted against those from TempO-seq and microarray and verified with qPCR.
Figure 2.
Figure 2.
Comparison of DEG identification in the three RNA-seq datasets and Combo. (A) Comparison of the number of DEGs. The numbers of both up-regulated and down-regulated DEGs decreased along with decreased sequencing depths in the compared data sets. Down-regulated DEGs were more influenced by changes in sequencing depths than up-regulated DEGs. Numbers of DEGs identified in the three datasets and Combo datasets are indicated by bars (left y-axis), while percentages of the number of DEGs compared to that in Combo are indicated by dots (right y-axis). (B) Comparison of the number of DEGs within four ranges of |log2FC|. DEGs with |log2FC| between 0.5 and 1 were most affected by the change of sequencing depths in RNA-seq. The larger the fold change of DEGs, the less affected DEG identification was by sequencing depths. (C) Overlap of DEGs in the three datasets and Combo. A total of 467 common DEGs were identified, accounting for about 50% of total DEGs in each dataset. (D) Overlap of DEGs in Lib1_HiSeq2000 and Lib1_HiScanSQ. Lib1_HiSeq2000 had a higher sequencing depth and identified more DEGs than Lib1_HiScanSQ. (E) Overlap of DEGs in Lib1_HiScanSQ and Lib2_HiScanSQ. Lib1_HiScanSQ and Lib2_HiScanSQ identified comparable numbers of DEGs and shared 505 of them.
Figure 3.
Figure 3.
Comparison of DEG-driven toxicological pathway analysis in the three datasets and Combo. Tox Analysis in the IPA system was carried out for each individual dataset, and the analysis results were then compared using Comparison Analysis. As the overlap p-value became smaller, the pathway became more significantly enriched. Pathways with a p-value <0.01 [i.e., −log(p-value) > 2] were considered significantly enriched due to AFB1 treatment. The heatmaps and bar chart show the top 10 significantly enriched toxicity functions (A), canonical pathways (B), and toxicity lists (C).
Figure 4.
Figure 4.
Comparison of DEG identification and pathway analyses with increasing sequencing depths. (A) Comparison of the number of DEGs. The numbers of DEGs increased along with increased sequencing depths. Down-regulated DEGs were more influenced by changes in sequencing depths than up-regulated DEGs. The numbers of DEGs identified at various sequencing depths in the subsampled data sets are indicated by bars (left y-axis), whereas the fold differences of the number of DEGs compared to that at 20 M are indicated by dots (right y-axis). (B) Distribution of DEGs within four ranges of |log2FC|. DEGs with |log2FC| between 0.5 and 1 were most affected by the change of sequencing depths in RNA-seq (red line). As the fold change of DEGs became larger, DEG identification became less affected by sequencing depths. (C) Overlap of DEGs in the five subsampled data sets. A total of 491 common DEGs were identified.
Figure 5.
Figure 5.
Comparison of DEG-driven toxicological pathway analysis in the subsampled datasets. Tox Analysis in the IPA system was carried out for each individual dataset, and the analysis results were then compared using Comparison Analysis. Pathways with a p-value < 0.01 [i.e., −log(p-value) > 2] were considered significantly enriched due to AFB1 treatment. The heatmaps and bar chart show the top 10 significantly enriched toxicity functions (A), canonical pathways (B), and toxicity lists (C).
Figure 6.
Figure 6.
Comparison of three high-throughput platforms. (A) Overlap of DEGs identified by RNA-seqin the Lib1_HiSeq2000 dataset, TempO-seq, and microarray analysis. Areas in the Venn diagram are proportional to the number of DEGs. The number of DEGs identified by RNA-seq was much greater than that by TempO-seq or microarray analysis. The three platforms shared 25 common DEGs. (B) Top 10 enriched toxicity functions using DEGs from RNA-seq, TempO-seq, and microarray analysis. A −log(p-value) > 2 was considered significantly enriched. Gray dots mark insignificantly enriched toxicity functions. (C) Top 10 enriched toxicity lists using DEGs from RNA-seq, TempO-seq, and microarray analyses. RNA-seq yielded higher overlap ratios for all top 10 pathways and higher significance powers in 6 out of 10 pathways, compared to TempO-seq and microarray. Bars indicate −log(p-value), while dots indicate overlap ratios. A −log(p-value) > 2 was considered significantly enriched.
Figure 7.
Figure 7.
Comparison of high-throughput platforms with qPCR. (A) Relative mRNA expression of the 18 genes tested in qPCR analysis. Fgf15 and Fgf22 were undetectable from qPCR reactions. A total of 12 tested genes were differentially expressed (p < 0.05, n = 3) in AFB1-treated rat livers compared to vehicle control. (B) Overlap of DEGs identified in qPCR and four RNA-seq datasets with varying sequencing depth. Seven out of 12 DEGs identified by qPCR were identified by all four RNA-seq datasets, while the remaining five DEGs were not identified in any RNA-seq datasets despite differences in sequencing depth. (C) DEGs identified in qPCR analysis and their differential expression analysis results in RNA-seq, TempO-seq, and microarray. Red squares indicate significantly different expression. (D) Ingenuity Toxicity Lists significantly enriched by DEGs from qPCR analysis and their enrichment results in RNA-seq, TempO-seq, and microarray. Red squares indicate significant enrichment.

Similar articles

Cited by

References

    1. Mortazavi A, Williams BA, McCue K, Schaeffer L, and Wold B (2008) Mapping and quantifying mammalian transcriptomes by RNA-Seq. Nat. Methods 5, 621–628. - PubMed
    1. Wang Z, Gerstein M, and Snyder M (2009) RNA-Seq: a revolutionary tool for transcriptomics. Nat. Rev. Genet 10, 57–63. - PMC - PubMed
    1. Wang C, Gong B, Bushel PR, Thierry-Mieg J, Thierry-Mieg D, Xu J, Fang H, Hong H, Shen J, Su Z, Meehan J, Li X, Yang L, Li H, Labaj PP, Kreil DP, Megherbi D, Gaj S, Caiment F, van Delft J, Kleinjans J, Scherer A, Devanarayan V, Wang J, Yang Y, Qian HR, Lancashire LJ, Bessarabova M, Nikolsky Y, Furlanello C, Chierici M, Albanese D, Jurman G, Riccadonna S, Filosi M, Visintainer R, Zhang KK, Li J, Hsieh JH, Svoboda DL, Fuscoe JC, Deng Y, Shi L, Paules RS, Auerbach SS, and Tong W (2014) The concordance between RNA-seq and microarray data depends on chemical treatment and transcript abundance. Nat. Biotechnol 32, 926–932. - PMC - PubMed
    1. Nagalakshmi U, Wang Z, Waern K, Shou C, Raha D, Gerstein M, and Snyder M (2008) The transcriptional landscape of the yeast genome defined by RNA sequencing. Science 320, 1344–1349. - PMC - PubMed
    1. Bullard JH, Purdom E, Hansen KD, and Dudoit S (2010) Evaluation of statistical methods for normalization and differential expression in mRNA-Seq experiments. BMC Bioinf. 11, 94. - PMC - PubMed

Publication types