

Integrated RNA-seq and Proteomic Studies Reveal Resource Reallocation towards Energy Metabolism and Defense in Skeletonema marinoi in Response to CO2 Increase
- PMID: 33355106
- PMCID: PMC8090871
- DOI: 10.1128/AEM.02614-20
Integrated RNA-seq and Proteomic Studies Reveal Resource Reallocation towards Energy Metabolism and Defense in Skeletonema marinoi in Response to CO2 Increase
Abstract
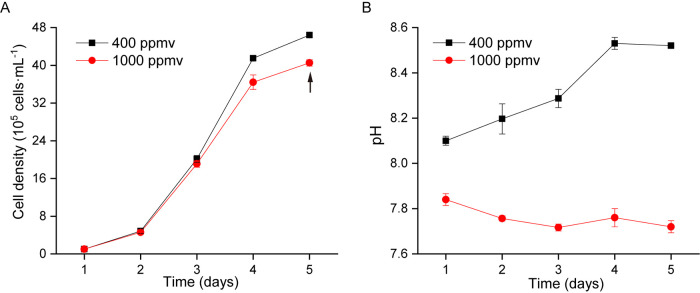
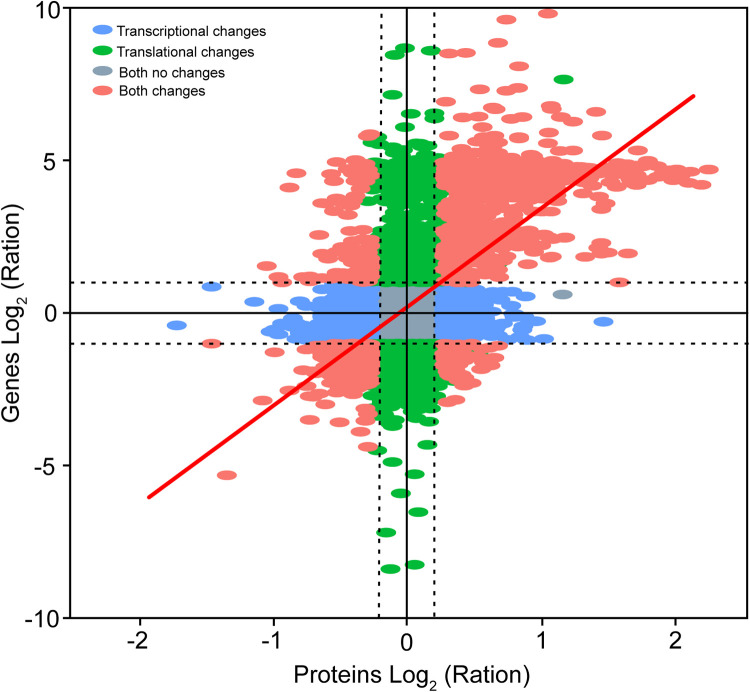
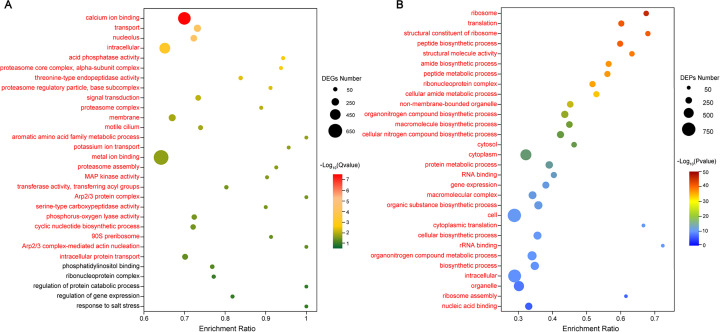
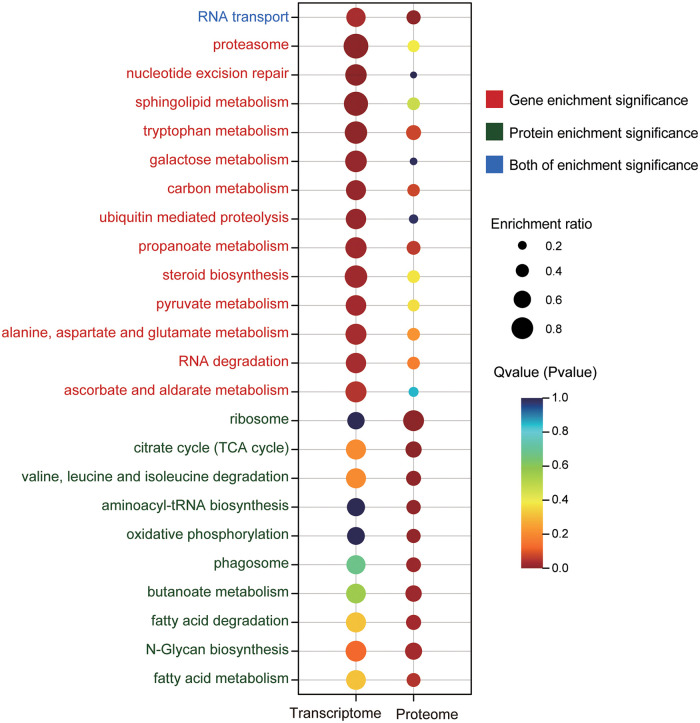
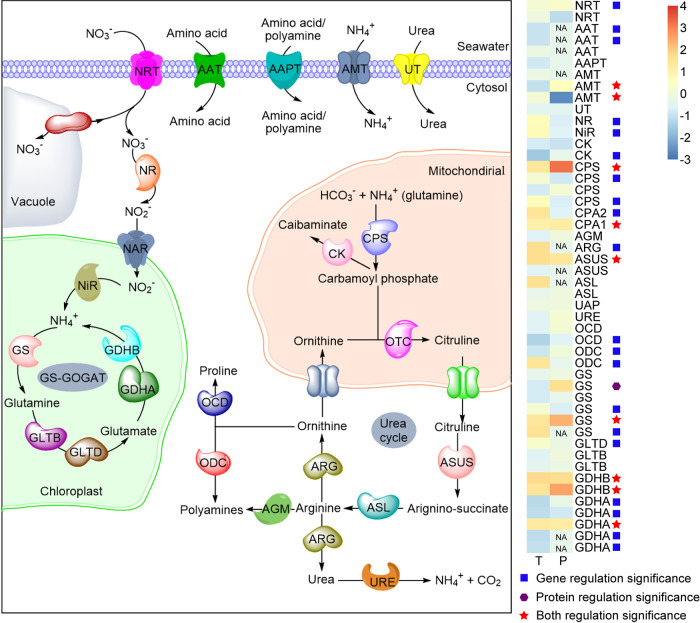
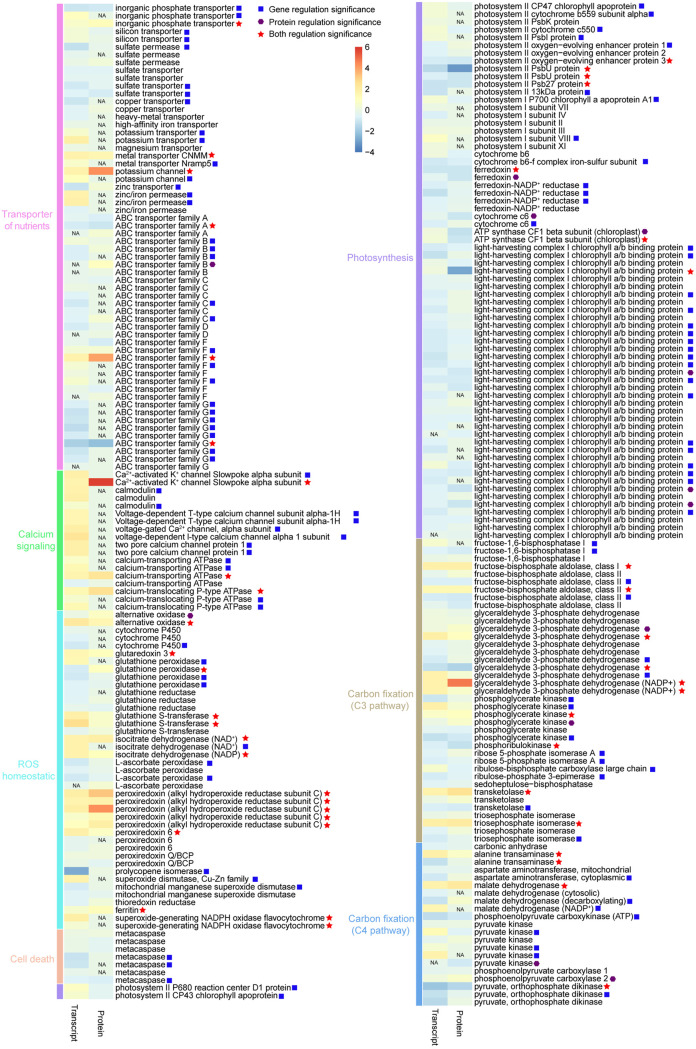
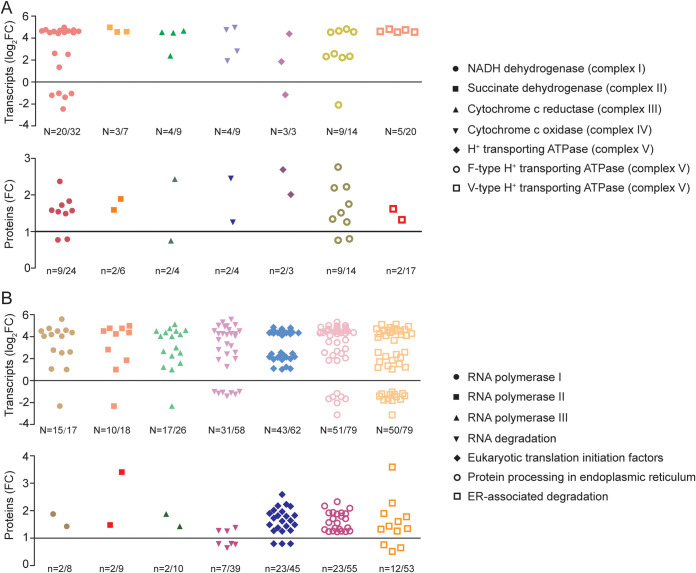
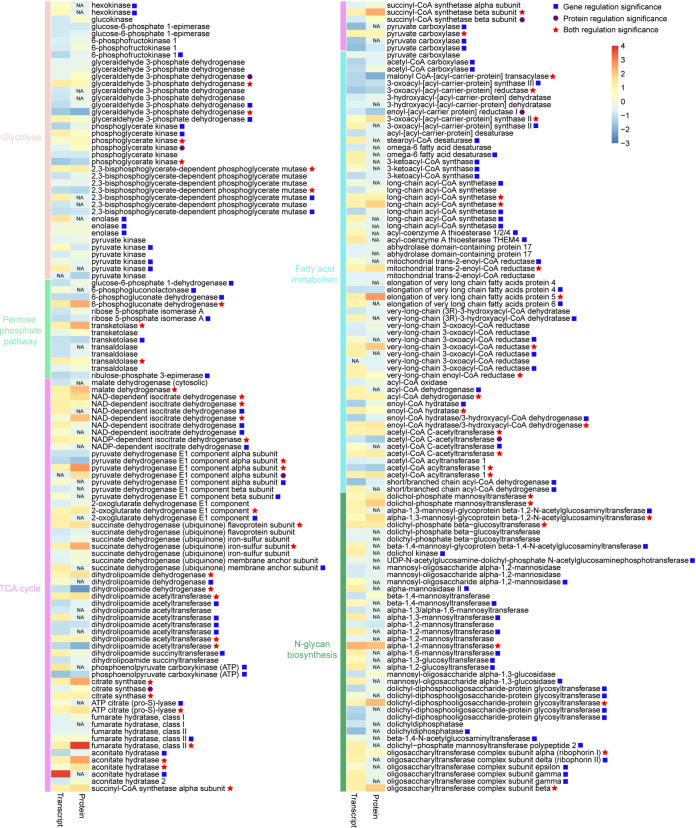
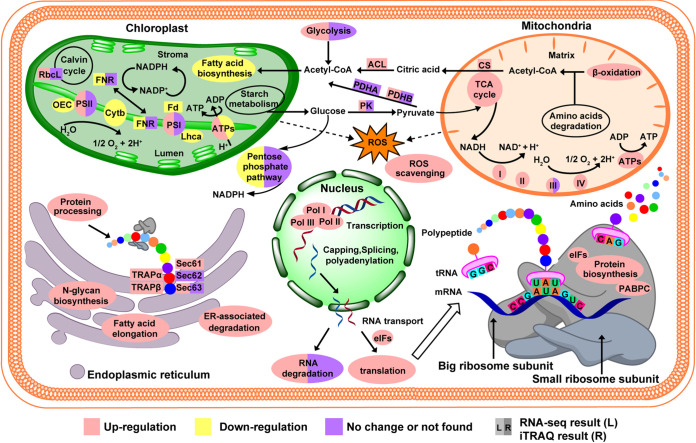
Rising atmospheric CO2 concentrations are causing ocean acidification (OA) with significant consequences for marine organisms. Because CO2 is essential for photosynthesis, the effect of elevated CO2 on phytoplankton is more complex and the mechanism is poorly understood. Here we applied RNA-seq and iTRAQ proteomics to investigate the impacts of CO2 increase (from ∼400 to 1000 ppm) on the temperate coastal marine diatom Skeletonema marinoi We identified 32,389 differentially expressed genes (DEGs) and 1,826 differentially expressed proteins (DEPs) from elevated CO2 conditions, accounting for 48.5% of total genes and 25.9% of total proteins we detected, respectively. Elevated pCO2 significantly inhibited the growth of S marinoi, and the 'omic' data suggested that this might be due to compromised photosynthesis in the chloroplast and raised mitochondrial energy metabolism. Furthermore, many genes/proteins associated with nitrogen metabolism, transcriptional regulation, and translational regulation were markedly up-regulated, suggesting enhanced protein synthesis. In addition, S marinoi exhibited higher capacity of ROS production and resistance to oxidative stress. Overall, elevated pCO2 seems to repress photosynthesis and growth of S marinoi, and through massive gene expression reconfiguration induce cells to increase investment in protein synthesis, energy metabolism and antioxidative stress defense, likely to maintain pH homeostasis and population survival. This survival strategy may deprive this usually dominant diatom in temperate coastal waters of its competitive advantages in acidified environments.Importance Rising atmospheric CO2 concentrations are causing ocean acidification with significant consequences for marine organisms. Chain-forming centric diatoms of Skeletonema is one of the most successful groups of eukaryotic primary producers with widespread geographic distribution. Among the recognized 28 species, S. marinoi can be a useful model for investigating the ecological, genetic, physiological, and biochemical characteristics of diatoms in temperate coastal regions. In this study, we found that the elevated pCO2 seems to repress photosynthesis and growth of S. marinoi, and through massive gene expression reconfiguration induce cells to increase investment in protein synthesis, energy metabolism and antioxidative stress defense, likely to maintain pH homeostasis and population survival. This survival strategy may deprive this usually dominant diatom in temperate coastal waters of its competitive advantages in acidified environments.
Copyright © 2020 American Society for Microbiology.
Figures
Similar articles
-
Skeletonema marinoi as a new genetic model for marine chain-forming diatoms.Sci Rep. 2019 Apr 2;9(1):5391. doi: 10.1038/s41598-019-41085-5. Sci Rep. 2019. PMID: 30940823 Free PMC article.
-
Responses of Marine Diatom Skeletonema marinoi to Nutrient Deficiency: Programmed Cell Death.Appl Environ Microbiol. 2020 Jan 21;86(3):e02460-19. doi: 10.1128/AEM.02460-19. Print 2020 Jan 21. Appl Environ Microbiol. 2020. PMID: 31757826 Free PMC article.
-
Expansion of photoreception-related gene families may drive ecological adaptation of the dominant diatom species Skeletonema marinoi.Sci Total Environ. 2023 Nov 1;897:165384. doi: 10.1016/j.scitotenv.2023.165384. Epub 2023 Jul 7. Sci Total Environ. 2023. PMID: 37422237
-
Friends With Benefits: Exploring the Phycosphere of the Marine Diatom Skeletonema marinoi.Front Microbiol. 2019 Aug 6;10:1828. doi: 10.3389/fmicb.2019.01828. eCollection 2019. Front Microbiol. 2019. PMID: 31447821 Free PMC article.
-
Climate change and ocean acidification effects on seagrasses and marine macroalgae.Glob Chang Biol. 2013 Jan;19(1):103-32. doi: 10.1111/j.1365-2486.2012.02791.x. Epub 2012 Sep 24. Glob Chang Biol. 2013. PMID: 23504724 Review.
Cited by
-
Time-resolved transcriptome analysis of Scenedesmus obliquus HTB1 under 10% CO2 condition.Microb Biotechnol. 2023 Feb;16(2):448-462. doi: 10.1111/1751-7915.14100. Epub 2022 Aug 1. Microb Biotechnol. 2023. PMID: 35914242 Free PMC article.
-
Transcriptome and proteome analyses reveal high nitrate or ammonium applications alleviate photosynthetic decline of Phoebe bournei seedlings under elevated carbon dioxide by regulating glnA and rbcS.Physiol Mol Biol Plants. 2024 Jul;30(7):1085-1097. doi: 10.1007/s12298-024-01481-2. Epub 2024 Jul 18. Physiol Mol Biol Plants. 2024. PMID: 39100876 Free PMC article.
References
-
- Stocker TF, Qin D, Plattner G-K, Tignor M, Allen SK, Boschung J, Nauels A, Xia Y, Bex V, Midgley PM. 2013. Climate change 2013: the physical science basis. Working Group Contribution I to the Fifth Assessment Report of the Intergovernmental Panel on Climate Change 1535. Cambridge University Press, Cambridge, United Kingdom.
-
- Torstensson A, Chierici M, Wulff A. 2012. The influence of increased temperature and carbon dioxide levels on the benthic/sea ice diatom Naviculadirecta. Polar Biol 35:205–214. doi:10.1007/s00300-011-1056-4. - DOI
-
- Sarthou G, Timmermans KR, Blain S, Tréguer P. 2005. Growth physiology and fate of diatoms in the ocean: a review. J Sea Res 53:25–42. doi:10.1016/j.seares.2004.01.007. - DOI
LinkOut - more resources
Full Text Sources
Other Literature Sources
