. 2020 Dec 18;6(51):eabb7187.
doi: 10.1126/sciadv.abb7187. Print 2020 Dec.

Network structure of the mouse brain connectome with voxel resolution

Affiliations

Network structure of the mouse brain connectome with voxel resolution

Ludovico Coletta et al. Sci Adv. .

Abstract

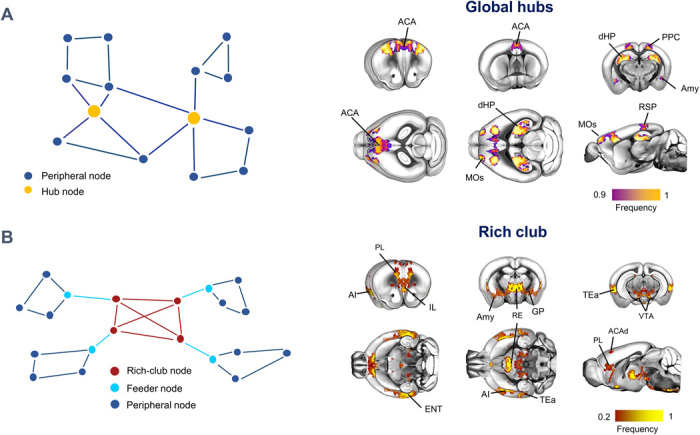
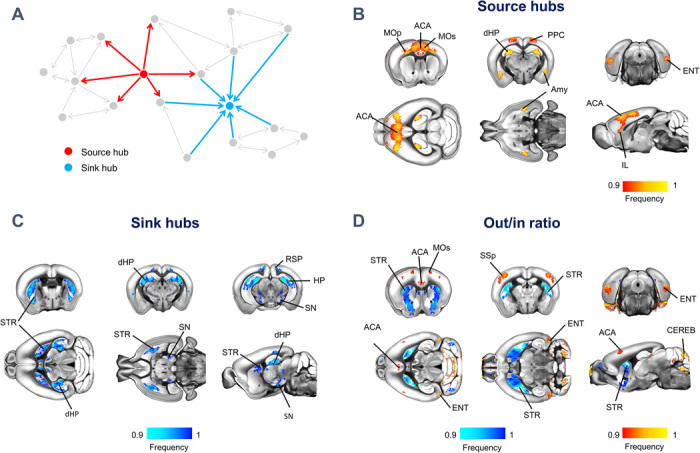
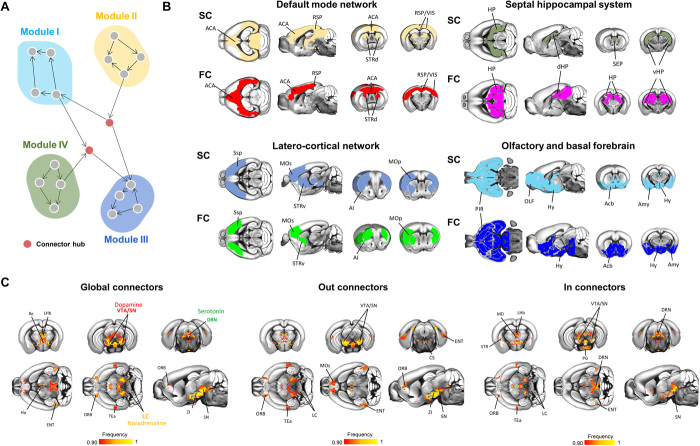
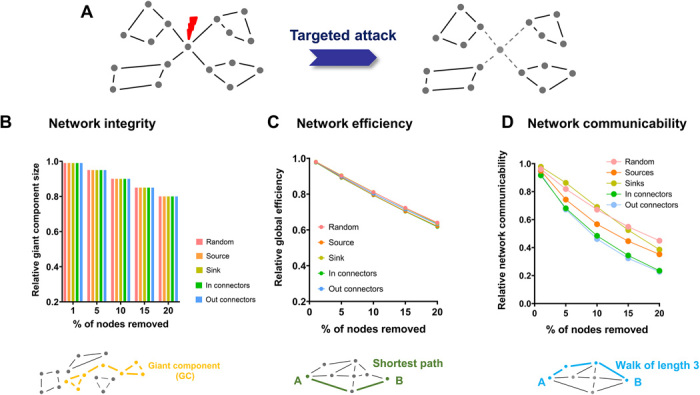
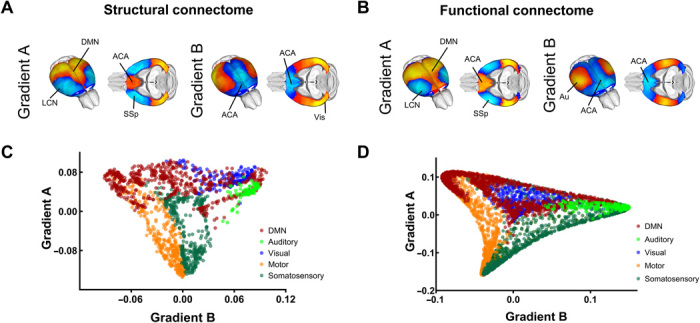
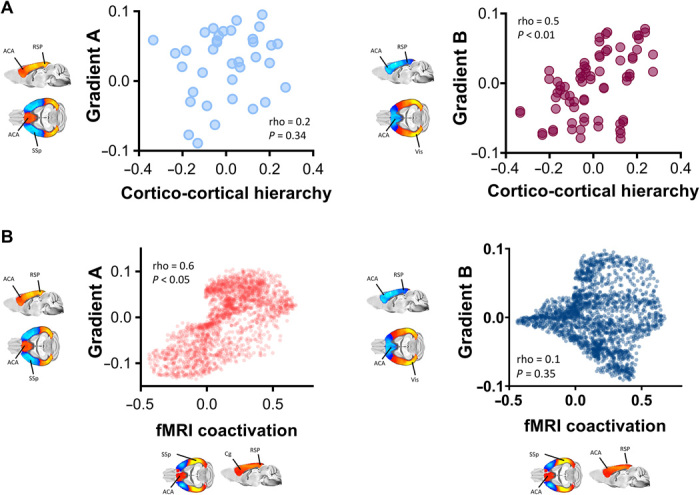
Fine-grained descriptions of brain connectivity are required to understand how neural information is processed and relayed across spatial scales. Previous investigations of the mouse brain connectome have used discrete anatomical parcellations, limiting spatial resolution and potentially concealing network attributes critical to connectome organization. Here, we provide a voxel-level description of the network and hierarchical structure of the directed mouse connectome, unconstrained by regional partitioning. We report a number of previously unappreciated organizational principles in the mammalian brain, including a directional segregation of hub regions into neural sink and sources, and a strategic wiring of neuromodulatory nuclei as connector hubs and critical orchestrators of network communication. We also find that the mouse cortical connectome is hierarchically organized along two superimposed cortical gradients reflecting unimodal-transmodal functional processing and a modality-specific sensorimotor axis, recapitulating a phylogenetically conserved feature of higher mammals. These findings advance our understanding of the foundational wiring principles of the mammalian connectome.


Figures

Fig. 1
Fig. 1. Global hubs and rich club of the mouse connectome.
(A) Anatomical distribution of global hubs of the voxel-wise mouse connectome. Global hubs (yellow nodes on the left panel) were defined on the basis of nodal total strength. A frequency map was obtained by computing the fraction of times a node scored among the highest-ranking strength nodes, limiting the visualization to the nodes that were classified as hubs at least 90% of the time. (B) Anatomical distribution of the rich club (red nodes on the left panel) of the voxel-wise mouse connectome. The frequency map indicates fraction of times high-degree nodes were retained as significant with respect to a set of random networks. ACA, anterior cingulate area; ACAd, anterior cingulate area, dorsal part; AI, agranular insular area; Amy, Amygdala; dHP, dorsal hippocampal area; ENT, entorhinal area; GP, globus pallidus; IL, infralimbic area; MOs, secondary motor area; PL, prelimbic area; PPC, posterior parietal cortex; RE, nucleus reuniens; RSP, retrosplenial area; TEa, temporal association areas.
Fig. 2
Fig. 2. Source and sink hubs of the mouse connectome are spatially segregable.
(A) Network schematic illustrating our topological classification of high strength regions into neural sources (red) and sinks (light blue). Source (B) and sink (C) hubs were defined on the basis of the voxel-wise strength of outgoing and incoming connectivity, respectively. Frequency maps were obtained by computing the fraction of times a node scored among the highest-ranking strength nodes, limiting the visualization to the nodes that were classified as hubs at least 90% of the time. (D) Out/in ratio mapping. For each node, we computed the ratio between the strength of the outgoing and incoming connectivity. Frequency maps were obtained by computing the fraction of times a node scored among the highest (red/yellow) or lowest ranking (light blue/blue) nodes as in (C) and (D). ACA, anterior cingulate area; Amy, Amygdala; CEREB, cerebellum; dHP, dorsal hippocampal area; ENT, entorhinal area; HP, hippocampus; MOp, primary motor areas; MOs, secondary motor area; PPC, posterior parietal cortex; RSP, retrosplenial area; SN, substantia nigra; SSp, primary somatosensory area; STR, striatum.
Fig. 3
Fig. 3. Connector hubs encompass key ascending neuromodulatory nuclei.
(A) Network schematic illustrating a graph-based definition of communities and connector hubs. (B) Structural communities anatomically recapitulate functional (rsfMRI) networks of the mouse brain. Structural communities (SC; top row; see Materials and Methods) were matched to corresponding functional communities [FC; bottom row; Liska et al. (19)]. (C) Neuromodulatory nuclei are configured as connector hubs. Global (left), out-connector (middle), and in-connector (right) hubs were computed on the basis of the participation coefficient metric, accounting for outgoing or incoming connections only. ACA, anterior cingulate area; Acb, nucleus accumbens; AI, agranular insular area; Amy, amygdala; CS, superior central nucleus raphe; DRN, dorsal nucleus raphe; ENT, entorhinal area; HP, hippocampus; Ha, habenula; Hy, hypothalamus; LC, locus coeruleus; LHb, lateral habenula; MD, mediodorsal nucleus of the thalamus; MOp, primary motor areas; MOs, secondary motor area; OLF, olfactory areas; ORB, orbital areas; PG, pontine gray; PIR, piriform area; RE, nucleus reuniens; RSP, retrosplenial area; SEP, septal complex; STRd, striatum dorsal region; STRv, striatum ventral region; TEa, temporal association areas; vHP, ventral hippocampal area; VIS, visual areas; VTA, ventral tegmental area; ZI, zona incerta.
Fig. 4
Fig. 4. Connector hubs are critical effectors of network communicability.
(A) Schematic illustration of targeted node removal and its effect on network integrity. (B to D) Effect of targeted hub removal on different network properties.
Fig. 5
Fig. 5. Gradients of SC and FC in the mouse cortex exhibit comparable topology.
Structural (A) and functional (B) gradients of cortical organization in the mouse connectome. Gradient A encompasses a unimodal-polymodal spectrum of cortical regions extending from motor-sensory LCN (light blue/blue) to the DMN (yellow/red). Gradient B extends antero-posteriorly across primary sensorimotor (yellow) and transmodal associative regions (blue). (C and D) Regional scatter plots of gradient organization for SC (C) and FC (D). ACA, anterior cingulate area; Au, auditory area; DMN, default mode network; LCN, latero-cortical network; SSp, primary somatosensory area; Vis, Visual areas.
Fig. 6
Fig. 6. Gradients of SC reflect cortico-cortical laminar hierarchy and constrain fMRI network dynamics.
(A) Modality-specific gradient B (right), but not polymodal-unimodal gradient A (left), reflects hierarchical intra-laminar organization of the mouse cortex. (B) Unimodal-polymodal DMN-LCN gradient A, but not modality-specific gradient B, closely recapitulates the spatial topography of dominant cortical CAPs governing fMRI dynamics in the mouse. ACA, anterior cingulate area; RSP, retrosplenial area; SSp, primary somatosensory area; Vis, Visual areas.

Similar articles

Cited by

References

    1. van den Heuvel M. P., Sporns O., A cross-disorder connectome landscape of brain dysconnectivity. Nat. Rev. Neurosci. 20, 435–446 (2019). - PMC - PubMed
    1. van den Heuvel M. P., Sporns O., Network hubs in the human brain. Trends Cogn. Sci. 17, 683–696 (2013). - PubMed
    1. Wang X., Lin Q., Xia M., He Y., Differentially categorized structural brain hubs are involved in different microstructural, functional, and cognitive characteristics and contribute to individual identification. Hum. Brain Mapp. 39, 1647–1663 (2018). - PMC - PubMed
    1. Towlson E. K., Vértes P. E., Ahnert S. E., Schafer W. R., Bullmore E. T., The rich club of the C. elegans neuronal connectome. J. Neurosci. 33, 6380–6387 (2013). - PMC - PubMed
    1. Rubinov M., Ypma R. J. F., Watson C., Bullmore E. T., Wiring cost and topological participation of the mouse brain connectome. Proc. Natl. Acad. Sci. U.S.A. 112, 10032–10037 (2015). - PMC - PubMed

Publication types

LinkOut - more resources