. 2020 Dec 18;6(51):eabd0263.
doi: 10.1126/sciadv.abd0263. Print 2020 Dec.

Structural basis of client specificity in mitochondrial membrane-protein chaperones

Affiliations

Structural basis of client specificity in mitochondrial membrane-protein chaperones

Iva Sučec et al. Sci Adv. .

Abstract

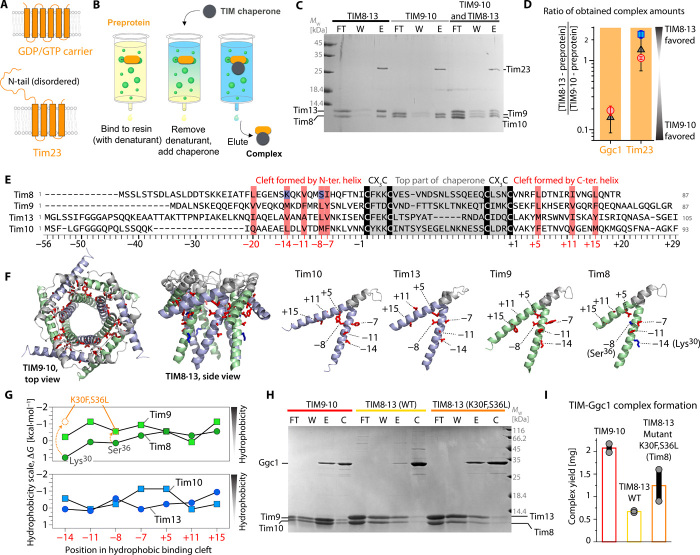
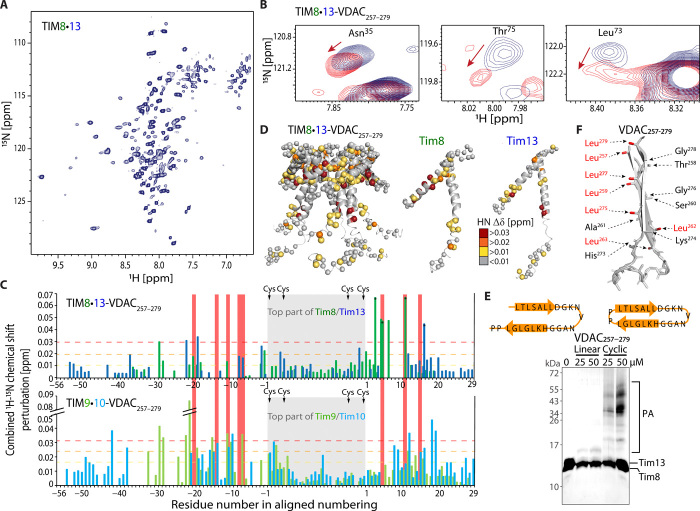
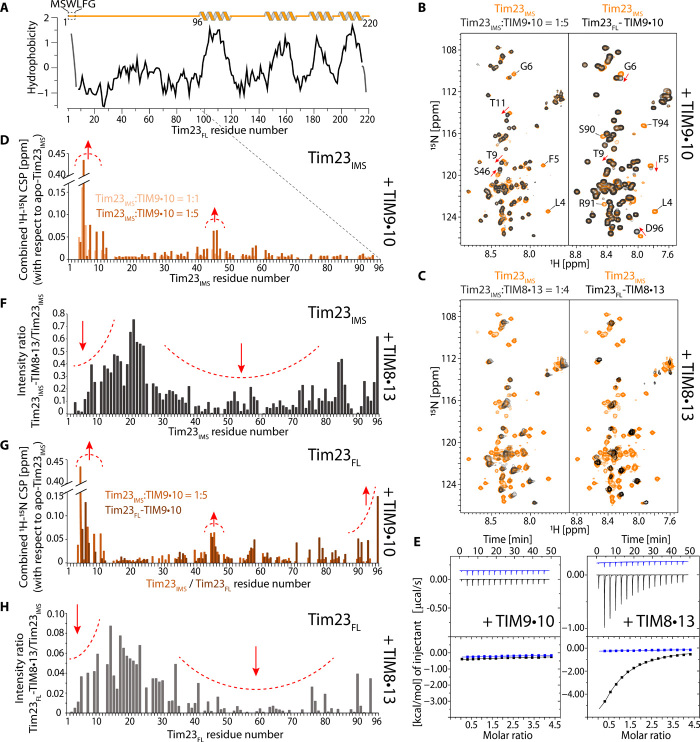
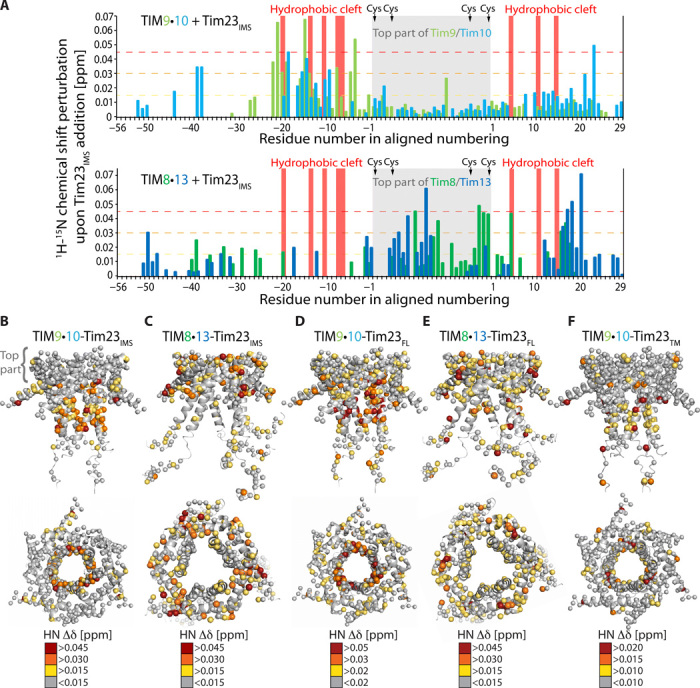
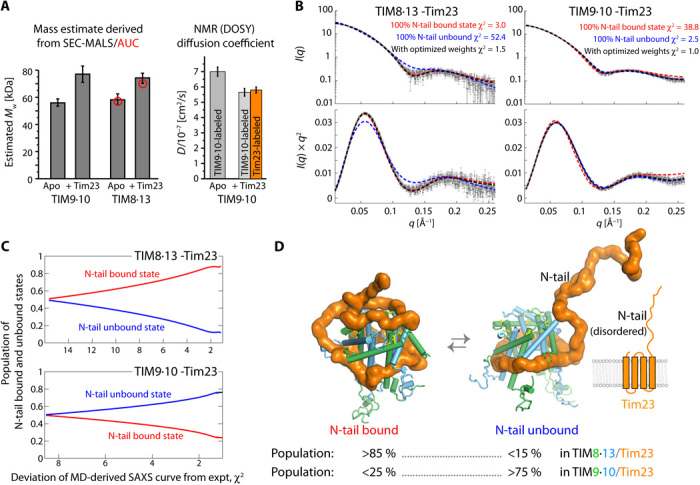
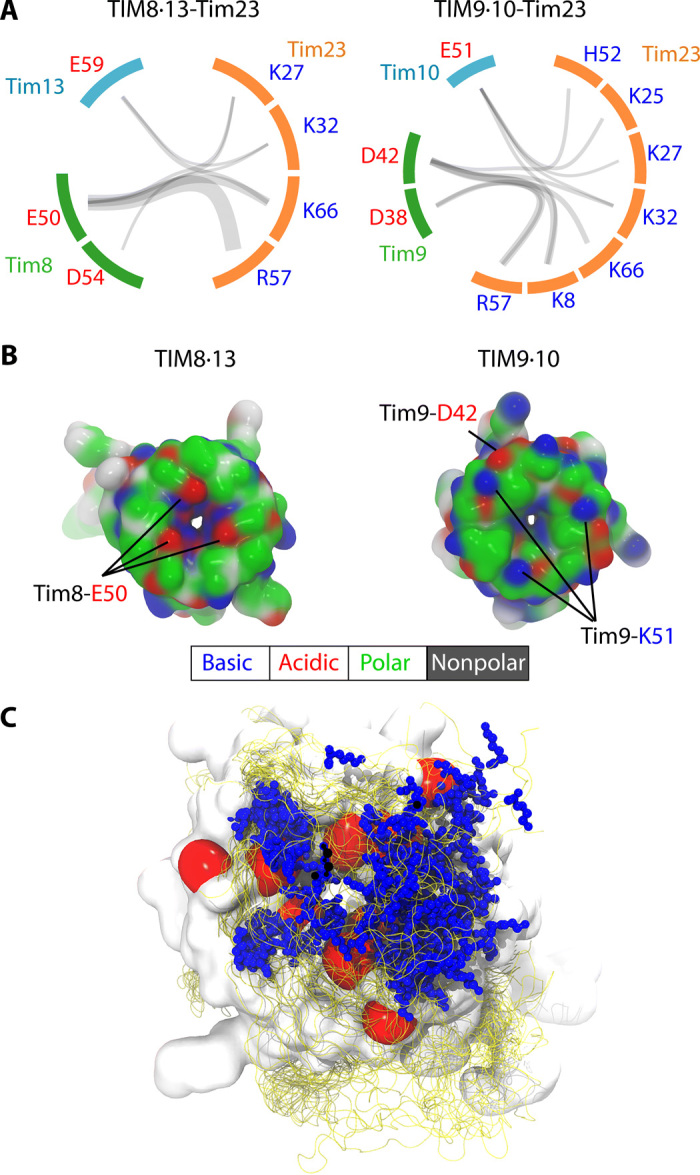
Chaperones are essential for assisting protein folding and for transferring poorly soluble proteins to their functional locations within cells. Hydrophobic interactions drive promiscuous chaperone-client binding, but our understanding of how additional interactions enable client specificity is sparse. Here, we decipher what determines binding of two chaperones (TIM8·13 and TIM9·10) to different integral membrane proteins, the all-transmembrane mitochondrial carrier Ggc1 and Tim23, which has an additional disordered hydrophilic domain. Combining NMR, SAXS, and molecular dynamics simulations, we determine the structures of Tim23/TIM8·13 and Tim23/TIM9·10 complexes. TIM8·13 uses transient salt bridges to interact with the hydrophilic part of its client, but its interactions to the transmembrane part are weaker than in TIM9·10. Consequently, TIM9·10 outcompetes TIM8·13 in binding hydrophobic clients, while TIM8·13 is tuned to few clients with both hydrophilic and hydrophobic parts. Our study exemplifies how chaperones fine-tune the balance of promiscuity versus specificity.


Figures

Fig. 1
Fig. 1. Biochemical characterization of TIM chaperone-membrane protein complexes.
(A) Native topology of the two precursor proteins used in this study. (B) Schematic view of the pull-down experiment used to prepare chaperone-precursor complexes. (C) Formation of Tim23-chaperone complexes, monitored by SDS-PAGE. Either TIM8·13, TIM9·10, or a 1:1 mixture was added to NiNTA-bound Tim23. The lanes correspond to flow-through after applying chaperone (FT), additional wash (W), and imidazole elution (E). Protein bands corresponding to Tim10 and Tim8 overlap. Mw, molecular weight. (D) Relative amounts of complexes with Ggc1 and Tim23, obtained from three different experiments: (i) a pull-down assay where both chaperones were applied to bound precursor protein (black); (ii) preparation of a TIM9·10-precursor protein complex and addition of TIM8·13, and SDS-PAGE and MS analysis after 1 and 3 hours (red); (iii) preparation of TIM8·13-Tim23 followed by TIM9·10 addition and SDS-PAGE (blue) as in (ii). The protein amounts were determined from LC–ESI-TOF–MS (fig. S4); error estimates from two or more experiments. (E) Sequence alignment of the small Tims, numbered from the N- and C-terminal conserved Cys residues (“0”). Red, conserved hydrophobic residues; blue, hydrophilic Tim8 residues, K30 and S36L. See fig. S5 for comprehensive alignment. (F) Location of the residues in the hydrophobic cleft. (G) Comparison of Kyte-Doolittle hydrophobicity of the residues in the binding cleft of wild-type (WT) native Tim proteins and Tim8K30F,S36L. (H) Pull-down experiment of Ggc1 with TIM9·10, TIM8·13, and TIM8·13 (Tim8K30F,S36L). Lane descriptions are as in (C); in addition, the fraction obtained after final wash with urea and imidazole, to control the Ggc1 initially loaded onto the column, is shown [control (C)]. (I) Amount of complex obtained from pull-down experiments of WT and mutant chaperones; the same amount of Ggc1 was applied in all three experiments, and the total amount of eluted complex was determined spectroscopically.
Fig. 2
Fig. 2. Solution-NMR and binding of a VDAC fragment to TIM8·13.
(A) 1H-15N NMR spectrum of TIM8·13 at 35°C. (B) CSP in TIM8·13 upon addition of five molar equivalents of cyclic VDAC257–279. (C) CSP effects of VDAC257–279 binding. The data for TIM9·10 are from (23). (D) Plot of CSP data on the TIM8·13 structure. (E) Photo-induced cross-linking of the linear (left) and cyclic (right) VDAC257–279 peptides to TIM8·13. While hardly any adducts are observed for the linear one, the cyclic peptide forms cross-linking photo-adducts (PA), including of higher molecular weight, resulting from multiple cross-links, as reported earlier (23, 34, 35). (F) Schematic structure of the two last strands of VDAC, as found in the NMR structure (61) of the full β barrel, showing that the hydrophobic and hydrophilic side chains cluster on the two opposite faces of the β-turn.
Fig. 3
Fig. 3. Tim23 has markedly different properties when binding to TIM8·13 and to TIM9·10.
(A) Hydrophobicity of Tim23 (Kyte-Doolittle). (B) NMR spectra of the 15N-labeled soluble Tim23IMS fragment in the presence of TIM9·10 (left, black) and of FL Tim23 bound to TIM9·10 (right, black) are compared to the Tim23IMS fragment in isolation (orange), under identical buffer conditions and NMR parameters. (C) As in (B) but with TIM8·13 instead of TIM9·10. (D) CSP of residues in Tim23IMS upon addition of one (light orange) or five (dark orange) molar equivalents of TIM9·10. (E) Calorimetric titrations for the interaction of TIM9·10 or TIM8·13 (54 μM in the calorimetric cell) with Tim23IMS (1.15 mM in the injecting syringe). Thermograms are displayed in the upper plots, and binding isotherms (ligand-normalized heat effects per injection as a function of the molar ratio, [Tim23IMS]/[chaperone]) are displayed in the lower plots. Control experiments, injecting into a buffer, are shown in blue. (F) Intensity ratio of residues in Tim23IMS in the presence of four molar equivalents of TIM8·13 compared to Tim23IMS alone. (G) CSP of the detectable residues in FL Tim23 attached to TIM9·10 (brown), compared to the soluble Tim23IMS fragment. (H) Intensity ratio of detectable residues in Tim23FL attached to TIM8·13. Note that the ratio was not corrected for differences in sample concentration, and the scale cannot be compared to the one in (G).
Fig. 4
Fig. 4. Tim23IMS and FL Tim23 differ in their interactions with TIM9·10 and TIM8·13 chaperones.
(A) CSPs observed upon addition of the Tim23IMS fragment to TIM9·10 (top) and TIM8·13 (bottom). The chaperone:Tim23IMS ratios were 1:1 (TIM8·13) and 1:3 (TIM9·10). Mapping of Tim23IMS-induced CSPs on TIM9·10 (B) and TIM8·13 (C), showing that while the top part of TIM9·10 does not show any significant CSPs, the corresponding part is the main interacting region of TIM8·13. CSP in complexes of TIM9·10 (D) and TIM8·13 (E) bound to FL Tim23. Tim23TM-induced CSP mapped on TIM9·10 (F), showing similar binding as the FL Tim23.
Fig. 5
Fig. 5. Architecture of the TIM8·13 and TIM9·10 holdases in complex with FL Tim23.
(A) Left: Apparent molecular weights of apo and holo chaperone complexes from SEC-MALS and AUC (red) circles. Right: Translational diffusion coefficients of TIM9·10 (apo) and TIM9·10-Tim23FL from NMR DOSY measurements. Two independent samples were used for the complex, in which either the chaperone or the precursor protein was labeled, as indicated. See also fig. S13. (B) Small-angle x-ray scattering (SAXS) curves (top) and Kratky plot representations thereof for the two chaperone-precursor complexes. The lines are SAXS curves calculated from structural ensembles obtained over 4.25-μs-long MD trajectories, in which the N-terminal half of Tim23 was either in a conformation bound to the top part of the chaperone (red) or in a loose unbound conformation (blue), or from an ensemble in which these two classes of states were present with optimized weights. (C) Goodness of fit of the back-calculated SAXS curves to the experimental SAXS data as a function of the relative weights of the two classes of conformations (bound/unbound). (D) Snapshots of conformations in which Tim23N-tail is either bound or unbound and the best-fit relative weights of the two classes of states as derived from SAXS/MD. More SAXS/MD data and ensemble views are provided in fig. S14 and in movies S1 and S2.
Fig. 6
Fig. 6. Tentative identification of electrostatic interactions from the MD ensemble.
(A) The charged residue pairs forming salt bridges are connected by gray semitransparent lines whose thickness linearly scales with the frequency of the corresponding salt bridge observed in MD simulations. Although more diverse salt bridges were observed in TIM9·10-Tim23 (10 in TIM9·10-Tim23 and 7 in TIM8·13-Tim23), these salt bridges were, on average, less stable than the ones in TIM8·13-Tim23, likely resulting in overall weaker interactions. (B) Snapshots of top views of the two chaperones along MD simulations of their holo forms in complex with TIM23. The top views of the chaperones in the apo forms are shown in fig. S14 (E and F). Residues are color-coded according to the scheme reflected below the figure. (C) Ensemble view of the N-tail bound state of TIM8·13-Tim23. The red surface represents the negatively charged E59 of Tim13 and E50 and D54 of Tim8. Blue stick and ball represents the side chain of positively charged residues (K8, K25, K27, K32, R57, and K66) of Tim23, which is shown as an ensemble of 25 structures. Ensemble view of the N-tail bound state of TIM9·10-Tim23 is shown in fig. S14G.

References

    1. Powers E. T., Morimoto R. I., Dillin A., Kelly J. W., Balch W. E., Biological and chemical approaches to diseases of proteostasis deficiency. Annu. Rev. Biochem. 78, 959–991 (2009). - PubMed
    1. Kim Y. E., Hipp M. S., Bracher A., Hayer-Hartl M., Hartl F. U., Molecular chaperone functions in protein folding and proteostasis. Annu. Rev. Biochem. 82, 323–355 (2013). - PubMed
    1. Kim D. H., Lee J.-E., Xu Z.-Y., Geem K. R., Kwon Y., Park J. W., Hwang I., Cytosolic targeting factor AKR2A captures chloroplast outer membrane-localized client proteins at the ribosome during translation. Nat. Commun. 6, 6843 (2015). - PubMed
    1. Bose D., Chakrabarti A., Substrate specificity in the context of molecular chaperones. IUBMB Life 69, 647–659 (2017). - PubMed
    1. Rüdiger S., Germeroth L., Schneider-Mergener J., Bukau B., Substrate specificity of the DnaK chaperone determined by screening cellulose-bound peptide libraries. EMBO J. 16, 1501–1507 (1997). - PMC - PubMed

Publication types

MeSH terms

Substances

LinkOut - more resources