. 2020 Dec 18;6(51):eabd6078.
doi: 10.1126/sciadv.abd6078. Print 2020 Dec.

CRL4DCAF1/VprBP E3 ubiquitin ligase controls ribosome biogenesis, cell proliferation, and development

Affiliations

CRL4DCAF1/VprBP E3 ubiquitin ligase controls ribosome biogenesis, cell proliferation, and development

Xiao-Ran Han et al. Sci Adv. .

Abstract

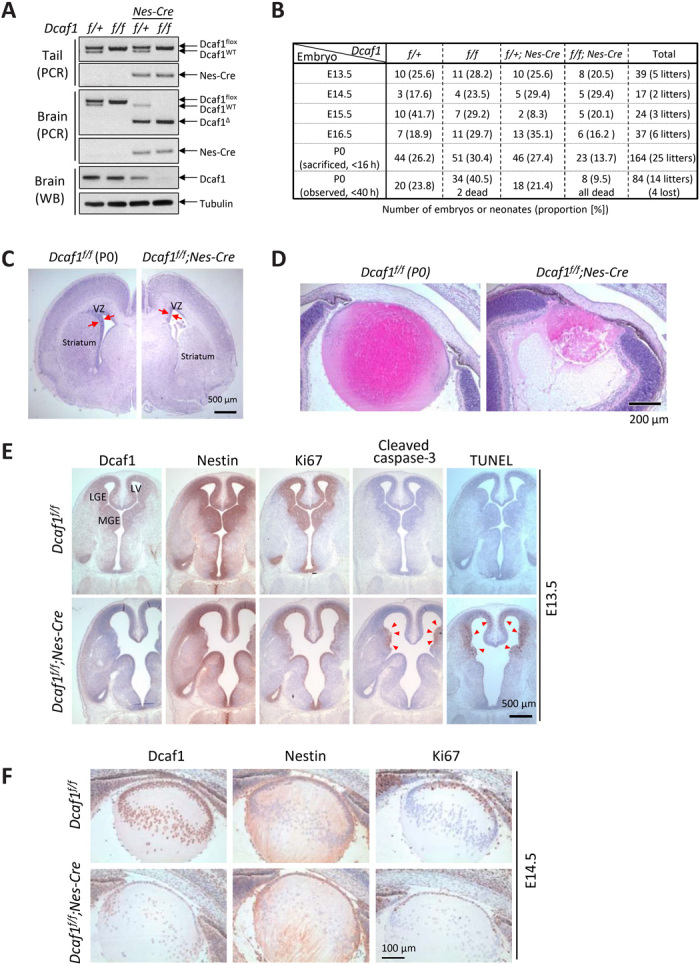
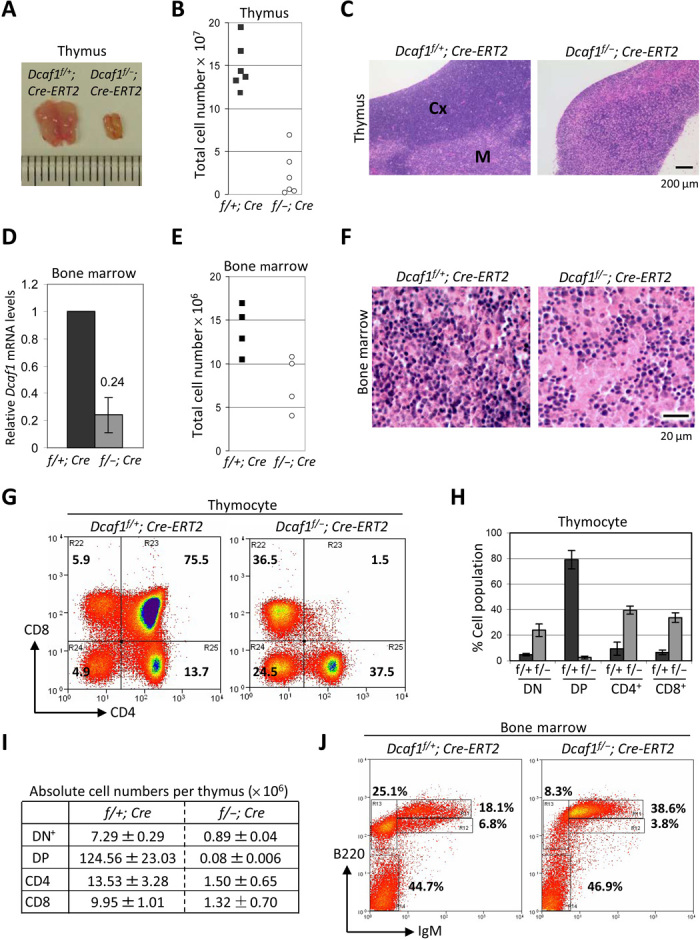
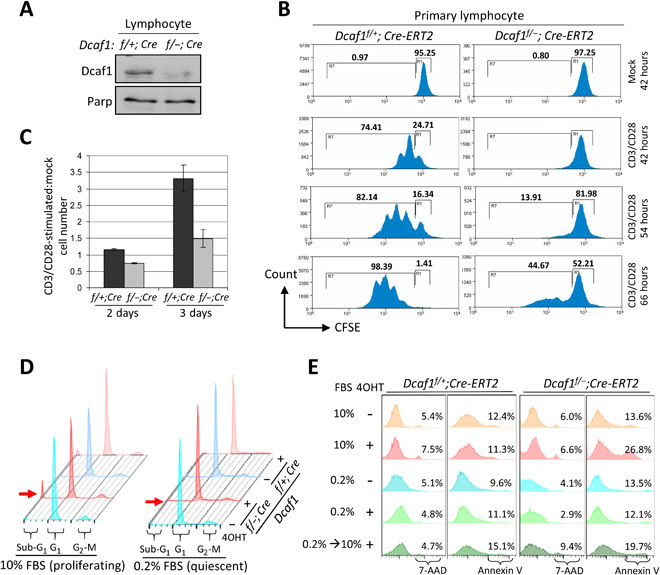
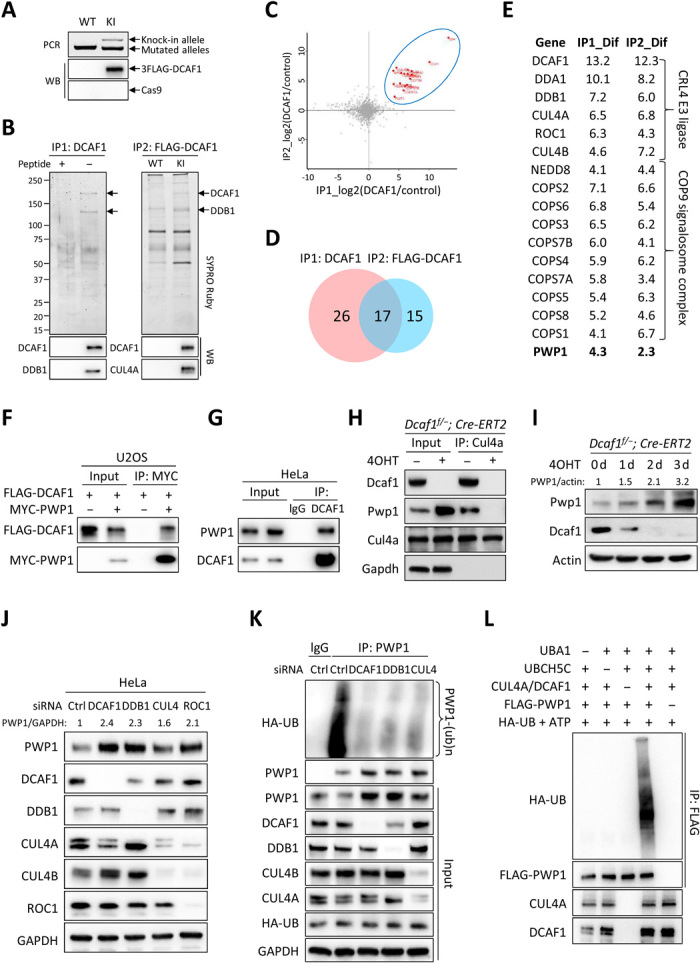
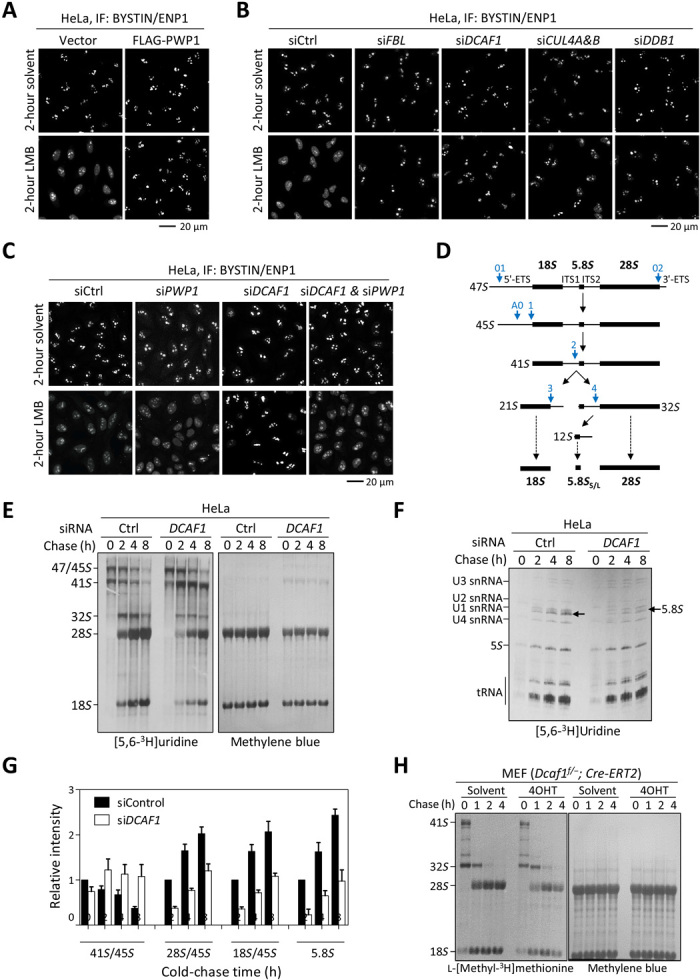
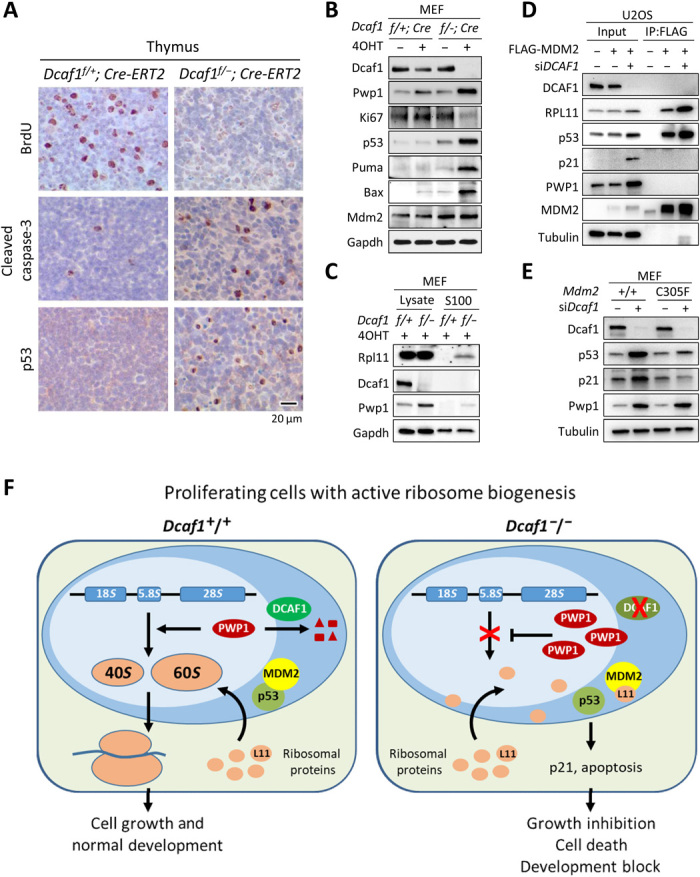
Evolutionarily conserved DCAF1 is a major substrate receptor for the DDB1-CUL4-ROC1 E3 ubiquitin ligase (CRL4) and controls cell proliferation and development. The molecular basis for these functions is unclear. We show here that DCAF1 loss in multiple tissues and organs selectively eliminates proliferating cells and causes perinatal lethality, thymic atrophy, and bone marrow defect. Inducible DCAF1 loss eliminates proliferating, but not quiescent, T cells and MEFs. We identify the ribosome assembly factor PWP1 as a substrate of the CRL4DCAF1 ligase. DCAF1 loss results in PWP1 accumulation, impairing rRNA processing and ribosome biogenesis. Knockdown or overexpression of PWP1 can rescue defects or cause similar defects as DCAF1 loss, respectively, in ribosome biogenesis. DCAF1 loss increases free RPL11, resulting in L11-MDM2 association and p53 activation. Cumulatively, these results reveal a critical function for DCAF1 in ribosome biogenesis and define a molecular basis of DCAF1 function in cell proliferation and development.


Figures

Fig. 1
Fig. 1. Conditional brain-specific Dcaf1 knockout in mice results in perinatal death and defects in brain and lens development.
(A) Dcaf1 gene deletion and protein depletion in neonatal mouse brains were confirmed by genomic PCR and immunoblotting. (B) Brain-specific Dcaf1 knockout mice died perinatally within 40 hours of birth. Summary of the numbers of embryos and neonates and their proportion (numbers in the brackets) in each age from the mating of Dcaf1f/+;Nestin-Cre and Dcaf1f/f mice. Neonates were sacrificed soon after delivery (<16 hours after birth) for analysis or observed overnight (<40 hours). Four neonates were lost because of cannibalization. (C) H&E staining of the coronal brain sections from control and Dcaf1 knockout P0 mice. VZ, ventricular zone. (D) H&E staining of the horizontal lens sections. (E) IHC staining of the control and Dcaf1 knockout brains at E13.5. Arrowheads indicate the cleaved caspase-3 and TUNEL (terminal deoxynucleotidyl transferase–mediated deoxyuridine triphosphate nick end labeling)–positive cells. (F) IHC staining of the control and Dcaf1 knockout lens at E14.5.
Fig. 2
Fig. 2. Inducible disruption of Dcaf1 in adult mice results in marked thymic atrophy and bone marrow defect.
(A) Thymi were isolated from Dcaf1f/+;Cre-ERT2 and Dcaf1f/−;Cre-ERT2 mice 6 days after tamoxifen injection (Photo credit: Sarah C. Jackson, taken at University of North Carolina at Chapel Hill). (B) Total thymic cellularity was quantified using a hemocytometer (n = 6). (C) H&E staining of formalin-fixed, paraffin-embedded thymus sections. Cortex (Cx) and medulla (M) are indicated in control mice, but are not well defined in Dcaf1 knockout mice. (D) Bone marrow cells from femur were isolated 6 days after tamoxifen injection, and Dcaf1 mRNA levels were determined by RT-qPCR in triplicate. (E) Total bone marrow cellularity was quantified using a hemocytometer (n = 4). (F) H&E staining of decalcified, paraffin-embedded bone marrow sections. (G) Flow cytometric analysis of thymocytes from tamoxifen-treated control and Dcaf1 knockout mice, stained with CD8 and CD4 antibodies. (H) Bar diagram showing average percentages for CD4CD8 (DN), CD4+CD8+ (DP), CD4+ SP, and CD8+ SP subpopulations. Error bars represent ±SEM for triplicate experiments. (I) Absolute cell numbers for thymocyte subsets in (H) were calculated by multiplying percentages by total cell numbers. (J) Flow cytometric analysis of bone marrow cells from tamoxifen-treated control and Dcaf1 knockout mice, stained with B220 antibody and immunoglobulin M (IgM) antibody.
Fig. 3
Fig. 3. Deletion of Dcaf1 selectively eliminates proliferating cells in vitro.
(A) Immunoblotting of primary lymphocyte lysates derived from Dcaf1f/+;Cre-ERT2 and Dcaf1f/−;Cre-ERT2 mice 6 days after tamoxifen injection. (B) Primary lymphocytes were labeled with CFSE and followed by CD3/CD28 stimulation or mock. Cells were cultured in vitro for 42, 54, or 66 hours before collection. Flow cytometric analysis for CFSE was used to determine the proliferation, gated by the 7-AAD–negative T cells. (C) Primary T cells were costimulated with CD3/CD28 or mock-treated and then plated at equal cell numbers. The total cell numbers following activation, expressed relative to the numbers of mock-treated cells, are reported at 2 and 3 days after stimulation. (D) MEFs were cultured in 10 or 0.2% FBS 1 day before 4OHT treatment for 3 days. DNA content was analyzed by PI staining followed by flow cytometry. Red arrow indicates sub-G1 population, representing apoptotic cells. (E) MEFs were cultured in 10 or 0.2% FBS 1 day before 4OHT treatment for 4 days. One group of MEFs was restimulated by 10% FBS after 2-day serum starvation. Cell death and apoptosis analysis was carried out by staining with 7-AAD and annexin V, respectively.
Fig. 4
Fig. 4. Ribosome assembly factor PWP1 is a substrate of CRL4DCAF1 E3 ubiquitin ligase.
(A) 3xFLAG knock-in (KI) to endogenous DCAF1 in HeLa cells verified by genomic PCR and immunoblotting. WT, wild type; WB, Western blot. (B) Immunopurification of two endogenous DCAF1 complexes from HeLa cells. Molar excess competing antigen peptides added in control immunocomplexes. (C) Scatter plot of log2 ratios of 626 proteins identified by mass spectrometry analyses of two DCAF1 immunocomplexes. (D) Venn diagram of proteins with greater than fourfold abundance change. (E) List of 17 DCAF1-interacting proteins identified in both DCAF1 immunocomplexes. (F) Interaction between ectopically expressed PWP1 and DCAF1 in U2OS cells by coimmunoprecipitation (co-IP). (G) Endogenous interaction between DCAF1 and PWP1 in HeLa cells treated with 20 μM MG132 for 6 hours. (H) Dcaf1f/−;Cre-ERT2 MEFs with 200 nM 4OHT or dimethyl sulfoxide (DMSO) for 2 days. Protein-protein interactions by co-IP. (I) MEFs with 200 nM 4OHT for indicated days. (J) HeLa cells transfected with small interfering RNAs (siRNAs) targeting indicated genes individually. (K) HeLa cells stably expressing HA-tagged ubiquitin transfected with siRNAs targeting indicated genes and treated with MG132. Endogenous PWP1 was immunoprecipitated and immunoblotted. (L) Immunopurified PWP1 protein incubated with CRL4DCAF1 E3 immune complex in the presence or absence of UBA1 (E1), UBCH5C (E2), adenosine triphosphate (ATP), and ubiquitin in vitro for 1 hour. Ubiquitylated PWP1 was immunoprecipitated and immunoblotted.
Fig. 5
Fig. 5. Loss of function of DCAF1 results in defects in ribosome biogenesis.
(A) HeLa cells stably expressing PWP1 or empty vector were treated with 20 nM LMB or solvent for 2 hours. The subcellular distribution of BYSTIN/ENP1 was determined by IF. (B and C) HeLa cells were transfected with siRNAs targeting indicated genes individually or in combination and then treated with 20 nM LMB or solvent for 2 hours. (D) Diagram illustrating the major steps of mammalian rRNA processing. Blue arrows indicate the major cleavage sites in human cells. (E and F) HeLa cells were transfected with siRNAs targeting DCAF1 or control siRNA and then followed by pulse-chase analysis of the [3H]uridine-labeled rRNAs. The newly synthesized and total rRNAs were determined by autoradiography and methylene blue staining, respectively. (G) The relative intensities of newly synthesized 41S, 28S, and 18S rRNAs compared to 45S precursors at 0 hours in (E) were quantified. The intensities of newly synthesized 5.8S rRNAs in (F) were quantified and normalized against 5S rRNAs. Error bars represent ±SD for duplicate experiments. (H) Dcaf1f/−;Cre-ERT2 MEFs were treated with 200 nM 4OHT or solvent for 3 days, followed by pulse-chase analysis of the l-[methyl-3H]methionine–labeled rRNAs.
Fig. 6
Fig. 6. Loss of Dcaf1 impairs ribosome biogenesis and activates RP-Mdm2-p53 checkpoint pathway.
(A) IHC staining of BrdU, cleaved caspase-3, and p53 from sections of formalin-fixed, paraffin-embedded thymus tissue following tamoxifen treatment. Positive staining is indicated by brown color; sections were counterstained with hematoxylin. (B) Dcaf1f/+;Cre-ERT2 and Dcaf1f/−;Cre-ERT2 MEFs were treated with 200 nM 4OHT for 3 days. (C) 4OHT-treated Dcaf1f/+;Cre-ERT2 and Dcaf1f/−;Cre-ERT2 MEFs were homogenized in hypotonic buffer (designated as total cell lysates). Ribosomes were pelleted from lysates by ultracentrifugation at 100,000g for 3 hours at 4°C, and the ribosome-free supernatants were collected (designated as the S100 fractions). (D) U2OS cells stably expressing FLAG-tagged MDM2 or empty vector were transfected with siRNAs targeting DCAF1 or control siRNAs. The interactions between MDM2 and RPL11 proteins were determined by co-IP analysis. (E) Activation of p53 by loss of DCAF1 depends on intact RP-MDM2-p53 pathway. Primary Mdm2+/+ or Mdm2C305F/C305F MEFs were transfected with siRNAs targeting Dcaf1 or control siRNAs. (F) Schematic model for the function of DCAF1-based E3 ubiquitin ligase in the regulation of PWP1 protein, ribosome biogenesis, cell proliferation, and development.

Similar articles

Cited by

References

    1. Warner J. R., The economics of ribosome biosynthesis in yeast. Trends Biochem. Sci. 24, 437–440 (1999). - PubMed
    1. Marygold S. J., Roote J., Reuter G., Lambertsson A., Ashburner M., Millburn G. H., Harrison P. M., Yu Z., Kenmochi N., Kaufman T. C., Leevers S. J., Cook K. R., The ribosomal protein genes and Minute loci of Drosophila melanogaster. Genome Biol. 8, R216 (2007). - PMC - PubMed
    1. Lambertsson A., The Minute genes in Drosophila and their molecular functions. Adv. Genet. 38, 69–134 (1998). - PubMed
    1. Freed E. F., Bleichert F., Dutca L. M., Baserga S. J., When ribosomes go bad: Diseases of ribosome biogenesis. Mol. Biosyst. 6, 481–493 (2010). - PMC - PubMed
    1. Teng T., Thomas G., Mercer C. A., Growth control and ribosomopathies. Curr. Opin. Genet. Dev. 23, 63–71 (2013). - PubMed

Publication types

MeSH terms