

Racial/Ethnic Disparities in Survival after Breast Cancer Diagnosis by Estrogen and Progesterone Receptor Status: A Pooled Analysis
- PMID: 33355191
- PMCID: PMC7867638
- DOI: 10.1158/1055-9965.EPI-20-1291
Racial/Ethnic Disparities in Survival after Breast Cancer Diagnosis by Estrogen and Progesterone Receptor Status: A Pooled Analysis
Abstract
Background: Limited studies have investigated racial/ethnic survival disparities for breast cancer defined by estrogen receptor (ER) and progesterone receptor (PR) status in a multiethnic population.
Methods: Using multivariable Cox proportional hazards models, we assessed associations of race/ethnicity with ER/PR-specific breast cancer mortality in 10,366 California women diagnosed with breast cancer from 1993 to 2009. We evaluated joint associations of race/ethnicity, health care, sociodemographic, and lifestyle factors with mortality.
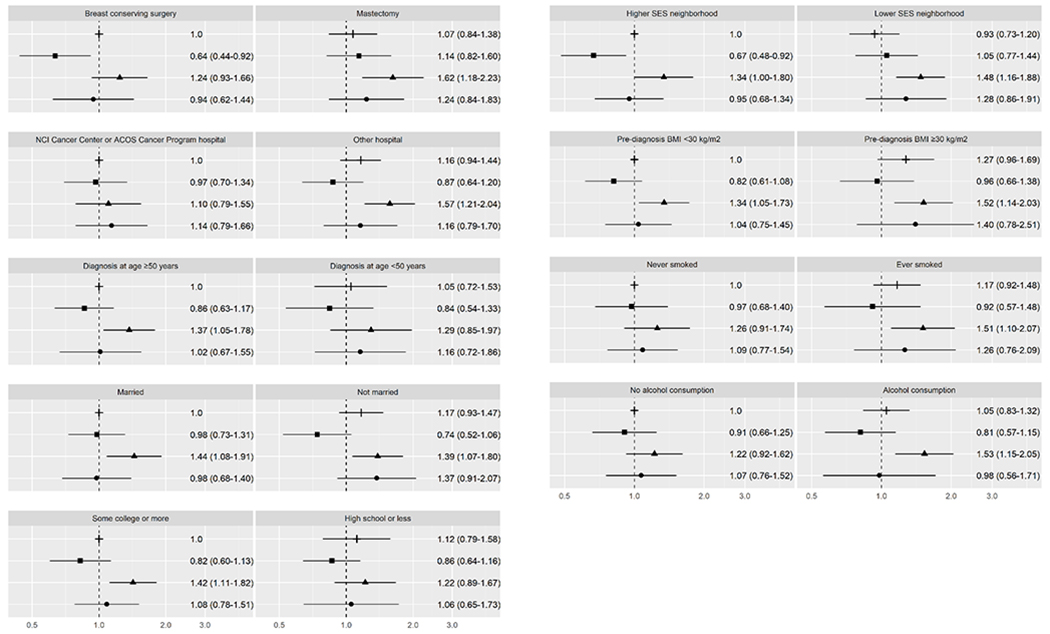
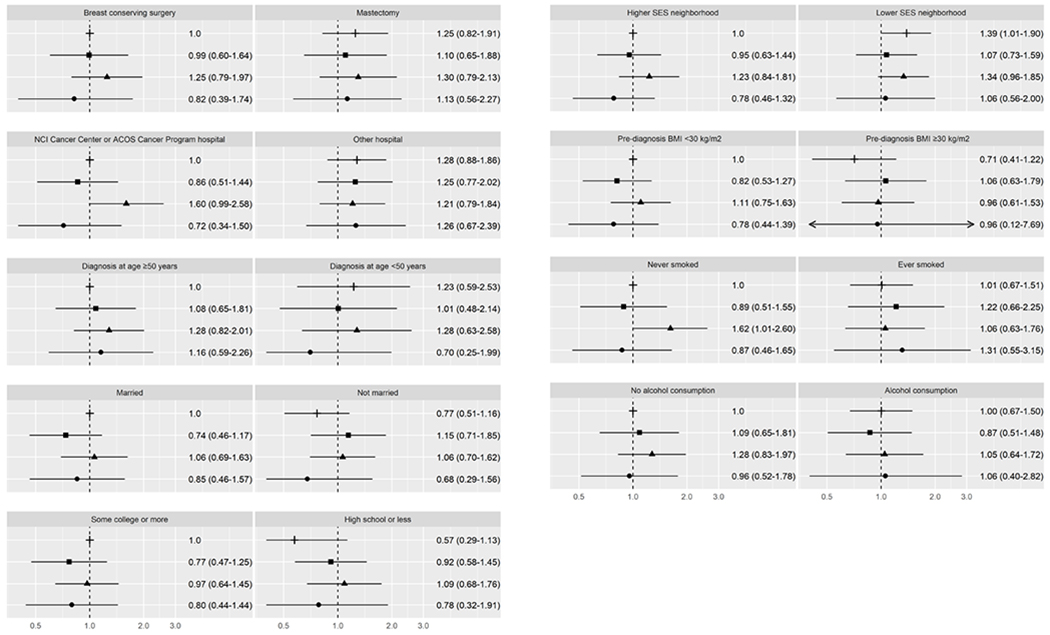
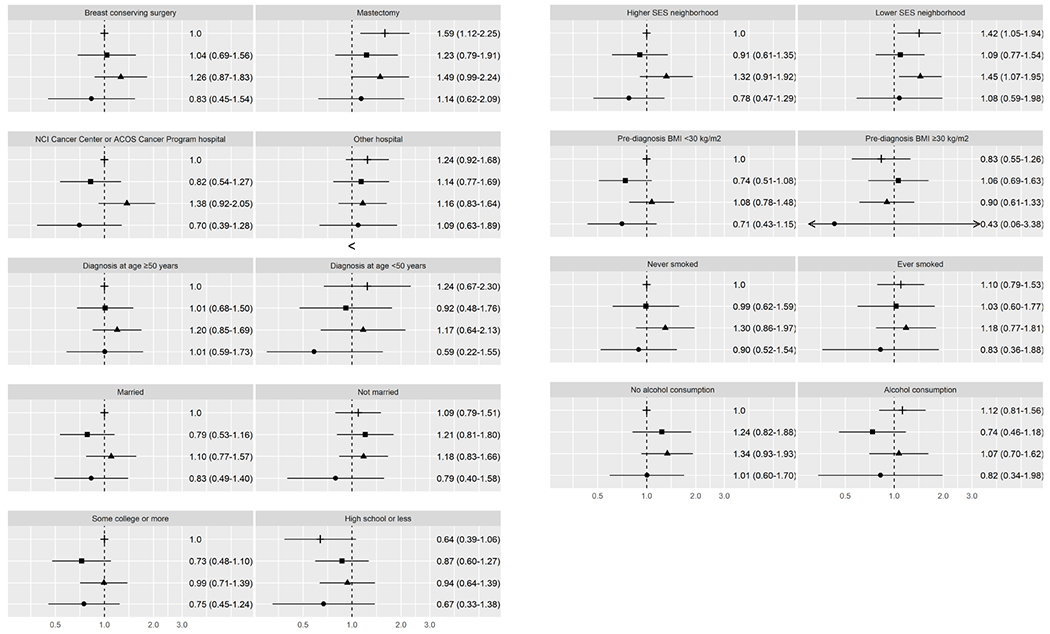
Results: Among women with ER/PR+ breast cancer, breast cancer-specific mortality was similar among Hispanic and Asian American women, but higher among African American women [HR, 1.31; 95% confidence interval (CI), 1.05-1.63] compared with non-Hispanic White (NHW) women. Breast cancer-specific mortality was modified by surgery type, hospital type, education, neighborhood socioeconomic status (SES), smoking history, and alcohol consumption. Among African American women, breast cancer-specific mortality was higher among those treated at nonaccredited hospitals (HR, 1.57; 95% CI, 1.21-2.04) and those from lower SES neighborhoods (HR, 1.48; 95% CI, 1.16-1.88) compared with NHW women without these characteristics. Breast cancer-specific mortality was higher among African American women with at least some college education (HR, 1.42; 95% CI, 1.11-1.82) compared with NHW women with similar education. For ER-/PR- disease, breast cancer-specific mortality did not differ by race/ethnicity and associations of race/ethnicity with breast cancer-specific mortality varied only by neighborhood SES among African American women.
Conclusions: Racial/ethnic survival disparities are more striking for ER/PR+ than ER-/PR- breast cancer. Social determinants and lifestyle factors may explain some of the survival disparities for ER/PR+ breast cancer.
Impact: Addressing these factors may help reduce the higher mortality of African American women with ER/PR+ breast cancer.
©2020 American Association for Cancer Research.
Conflict of interest statement
Conflict of interest:
The authors declare no potential conflicts of interest.
Figures

Similar articles
-
Racial/ethnic differences in breast cancer survival by inflammatory status and hormonal receptor status: an analysis of the Surveillance, Epidemiology, and End Results data.Cancer Causes Control. 2014 Aug;25(8):959-68. doi: 10.1007/s10552-014-0395-1. Epub 2014 May 17. Cancer Causes Control. 2014. PMID: 24839049 Free PMC article.
-
Disparities in race/ethnicity and socioeconomic status: risk of mortality of breast cancer patients in the California Cancer Registry, 2000-2010.BMC Cancer. 2013 Oct 2;13:449. doi: 10.1186/1471-2407-13-449. BMC Cancer. 2013. PMID: 24083624 Free PMC article.
-
Risk factors for second primary breast cancer by laterality, age, and race and ethnicity.J Natl Cancer Inst. 2025 Mar 1;117(3):436-449. doi: 10.1093/jnci/djae254. J Natl Cancer Inst. 2025. PMID: 39392427
-
The influence of socioeconomic disparities on breast cancer tumor biology and prognosis: a review.J Womens Health (Larchmt). 2009 Jun;18(6):883-93. doi: 10.1089/jwh.2008.1127. J Womens Health (Larchmt). 2009. PMID: 19514831 Review.
-
Risk factors for breast cancer subtypes by race and ethnicity: A scoping review of the literature.medRxiv [Preprint]. 2024 Mar 19:2024.03.18.24304210. doi: 10.1101/2024.03.18.24304210. medRxiv. 2024. Update in: J Natl Cancer Inst. 2024 Dec 1;116(12):1992-2002. doi: 10.1093/jnci/djae172. PMID: 39108508 Free PMC article. Updated. Preprint.
Cited by
-
Racial Differences in ctDNA Profiles, Targeted Therapy Use, and Outcomes in Metastatic Breast Cancer.JAMA Netw Open. 2025 Feb 3;8(2):e2461899. doi: 10.1001/jamanetworkopen.2024.61899. JAMA Netw Open. 2025. PMID: 40009379 Free PMC article.
-
Racial Disparity in Anthracycline-induced Cardiotoxicity in Breast Cancer Patients.Biomedicines. 2023 Aug 17;11(8):2286. doi: 10.3390/biomedicines11082286. Biomedicines. 2023. PMID: 37626782 Free PMC article. Review.
-
Association of Cigarette Smoking and Alcohol Consumption With Subsequent Mortality Among Black Breast Cancer Survivors in New Jersey.JAMA Netw Open. 2023 Jan 3;6(1):e2252371. doi: 10.1001/jamanetworkopen.2022.52371. JAMA Netw Open. 2023. PMID: 36692882 Free PMC article.
-
Racial Differences in Breast Cancer Survival Between Black and White Women According to Tumor Subtype: A Systematic Review and Meta-Analysis.J Clin Oncol. 2024 Nov 10;42(32):3867-3879. doi: 10.1200/JCO.23.02311. Epub 2024 Sep 17. J Clin Oncol. 2024. PMID: 39288352
-
Building research infrastructure to advance precision medicine in colorectal cancer.JNCI Cancer Spectr. 2025 Apr 30;9(3):pkaf027. doi: 10.1093/jncics/pkaf027. JNCI Cancer Spectr. 2025. PMID: 40111849 Free PMC article.
References
-
- Siegel RL, Miller KD, Jemal A. Cancer statistics, 2020. CA Cancer J Clin 2020;701:7–30. - PubMed
-
- DeSantis CE, Ma J, Goding Sauer A, Newman LA, Jemal A. Breast cancer statistics, 2017, racial disparity in mortality by state. CA Cancer J Clin 2017;676:439–48. - PubMed
-
- Hunt BR, Hurlbert MS. Black:white disparities in breast cancer mortality in the 50 largest cities in the United States, 2005–2014. Cancer Epidemiol 2016. - PubMed
-
- Li CI, Malone KE, Daling JR. Differences in breast cancer stage, treatment, and survival by race and ethnicity. Arch Intern Med 2003;1631:49–56. - PubMed
Publication types
MeSH terms
Substances
Grants and funding
- HHSN261201800032C/CA/NCI NIH HHS/United States
- HHSN261201800009C/CA/NCI NIH HHS/United States
- NU58DP006344/DP/NCCDPHP CDC HHS/United States
- HHSN261201800015I/CA/NCI NIH HHS/United States
- K05 CA136967/CA/NCI NIH HHS/United States
- U01 CA164920/CA/NCI NIH HHS/United States
- HHSN261201800032I/CA/NCI NIH HHS/United States
- HHSN261201800015C/CA/NCI NIH HHS/United States
- HHSN261201800009I/CA/NCI NIH HHS/United States
- KL2 TR001874/TR/NCATS NIH HHS/United States
- R01 CA129059/CA/NCI NIH HHS/United States
- R01 CA063446/CA/NCI NIH HHS/United States
- R01 CA077398/CA/NCI NIH HHS/United States
- R01 CA054281/CA/NCI NIH HHS/United States
- U01 CA164973/CA/NCI NIH HHS/United States
- R37 CA054281/CA/NCI NIH HHS/United States
LinkOut - more resources
Full Text Sources
Medical
Research Materials
