. 2021 May 11;62(2):229-247.
doi: 10.1093/pcp/pcaa162.

Autophagy Contributes to the Quality Control of Leaf Mitochondria

Affiliations

Autophagy Contributes to the Quality Control of Leaf Mitochondria

Sakuya Nakamura et al. Plant Cell Physiol. .

Abstract

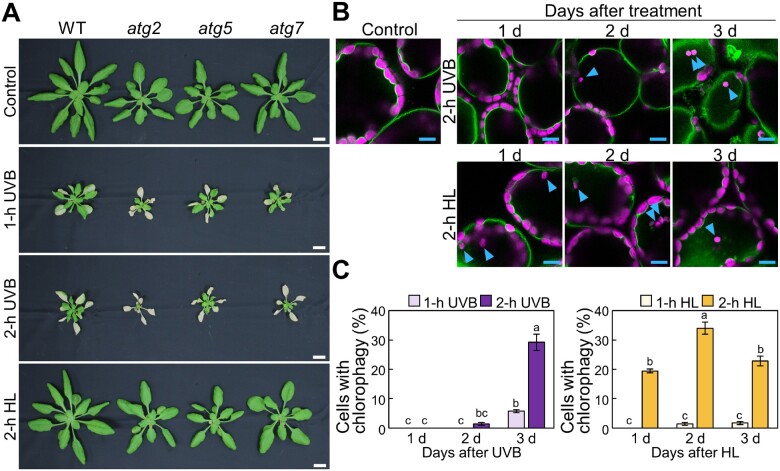
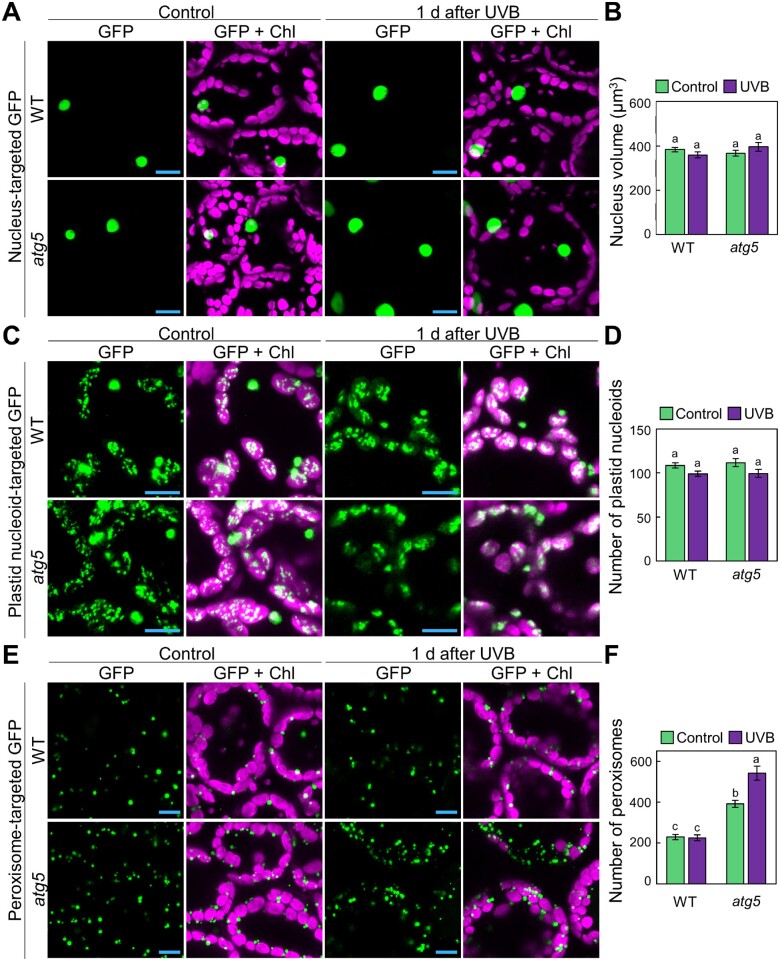
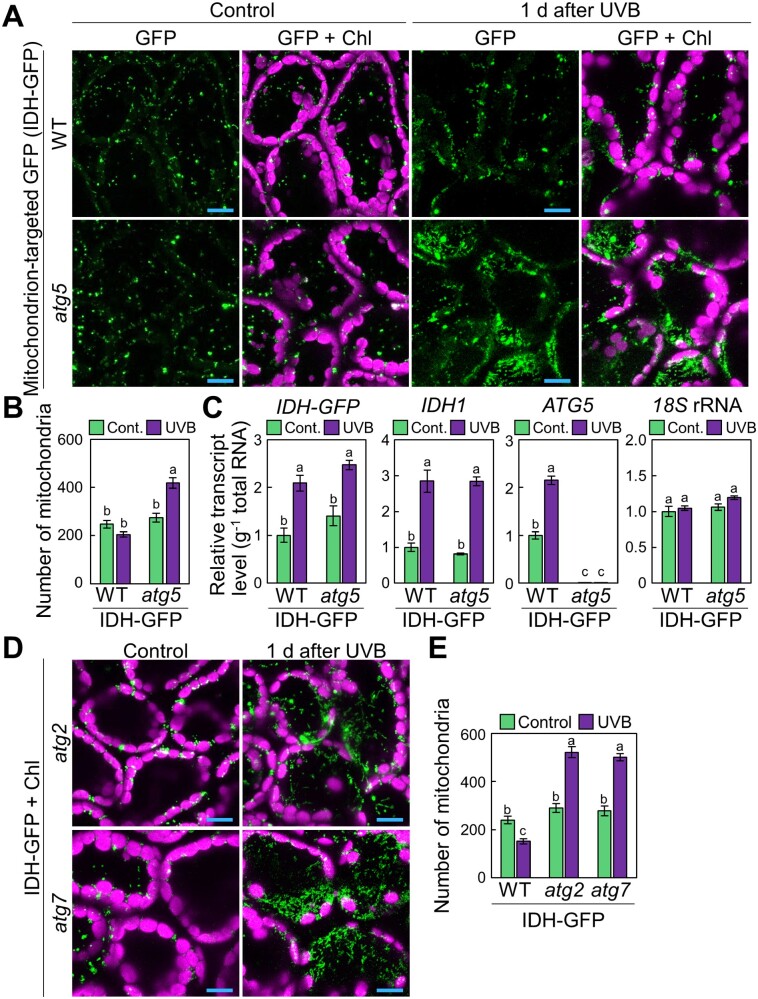
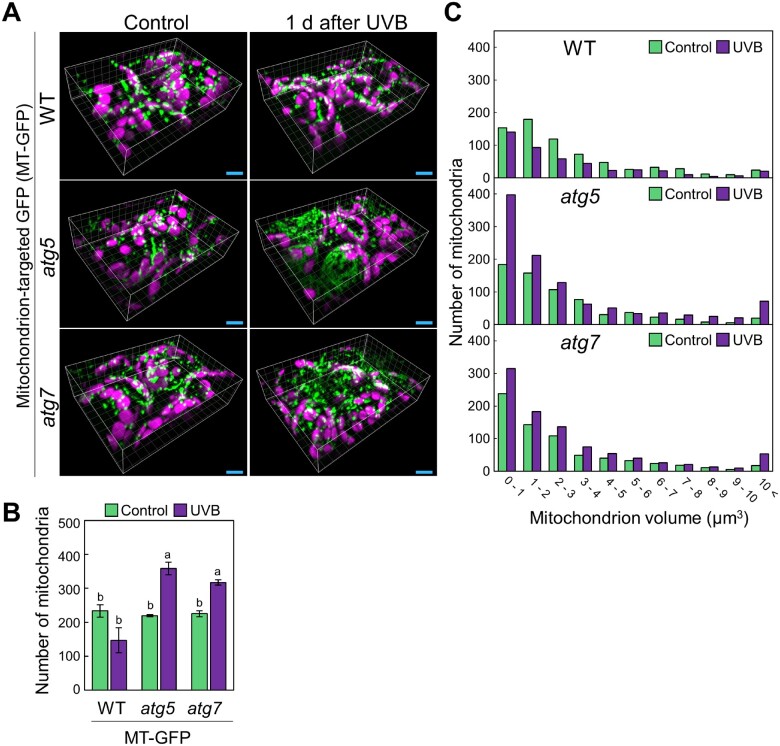
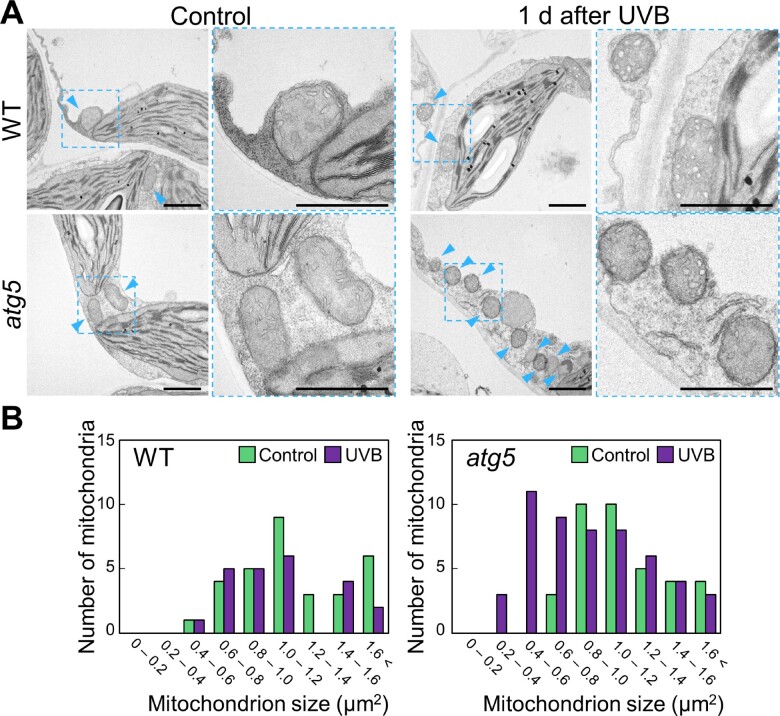
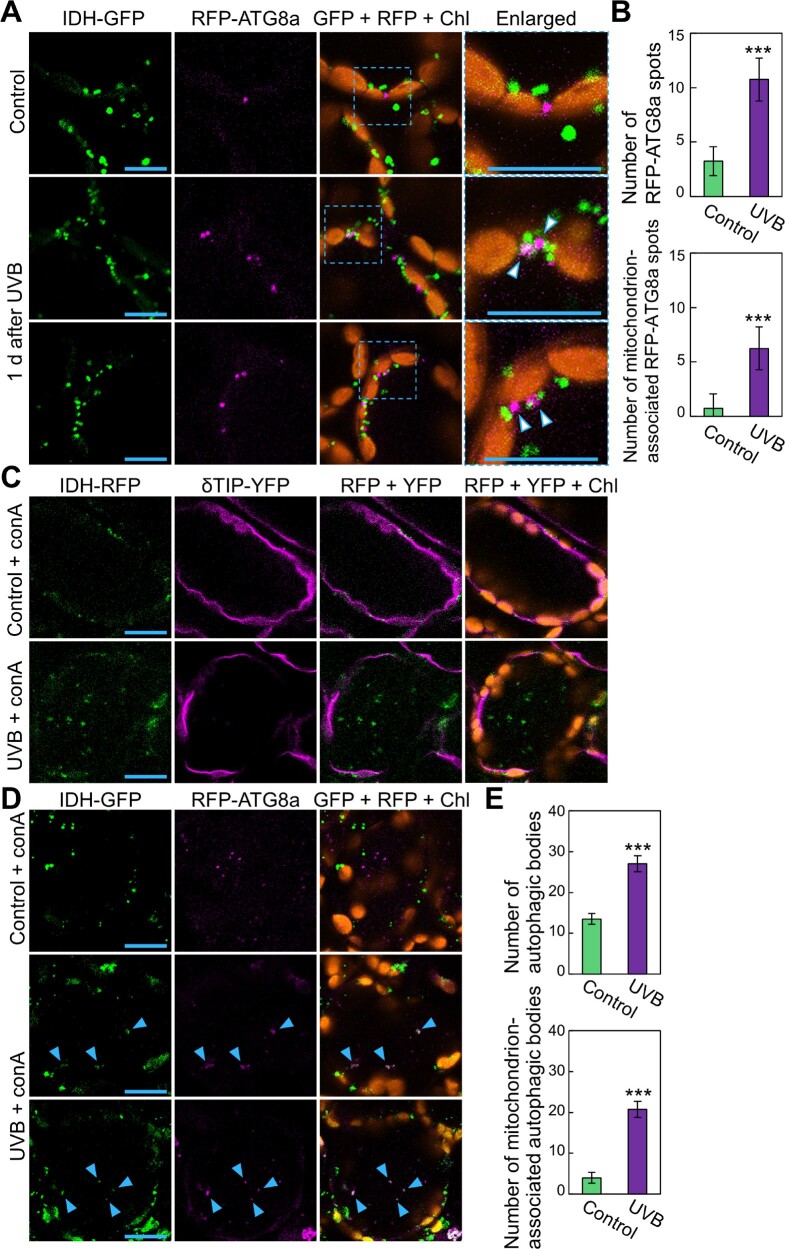
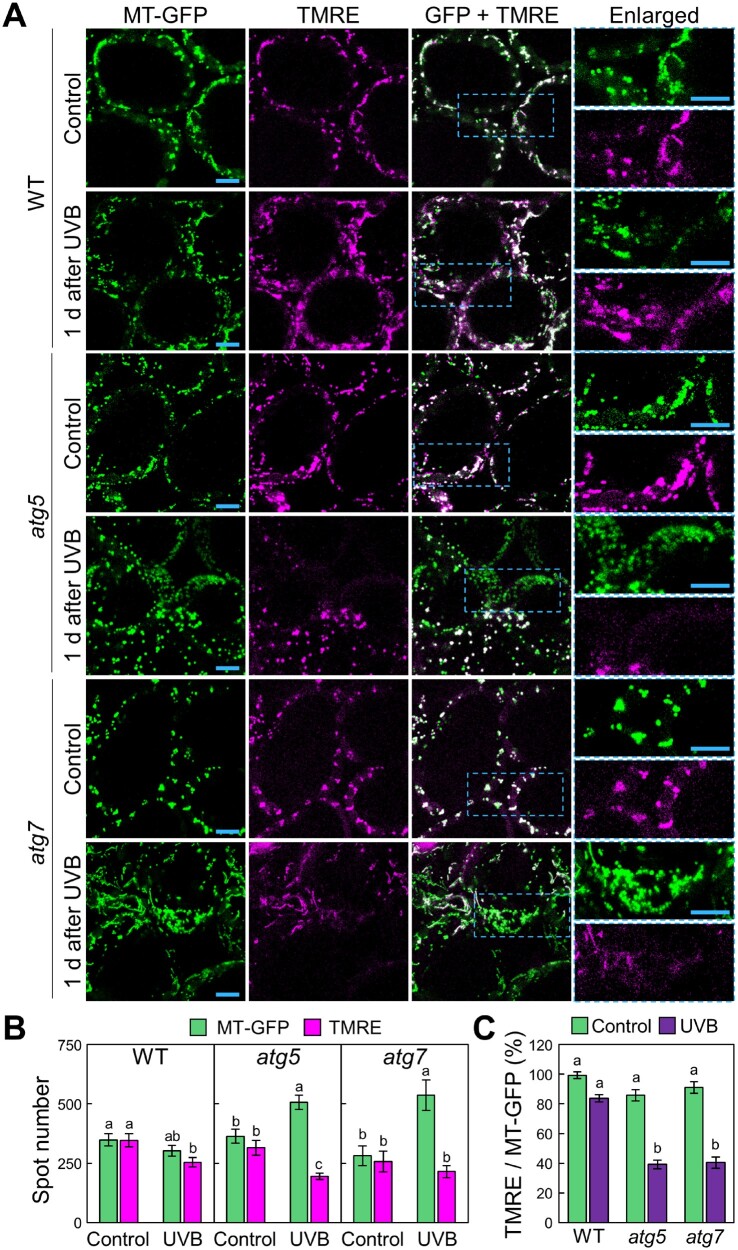
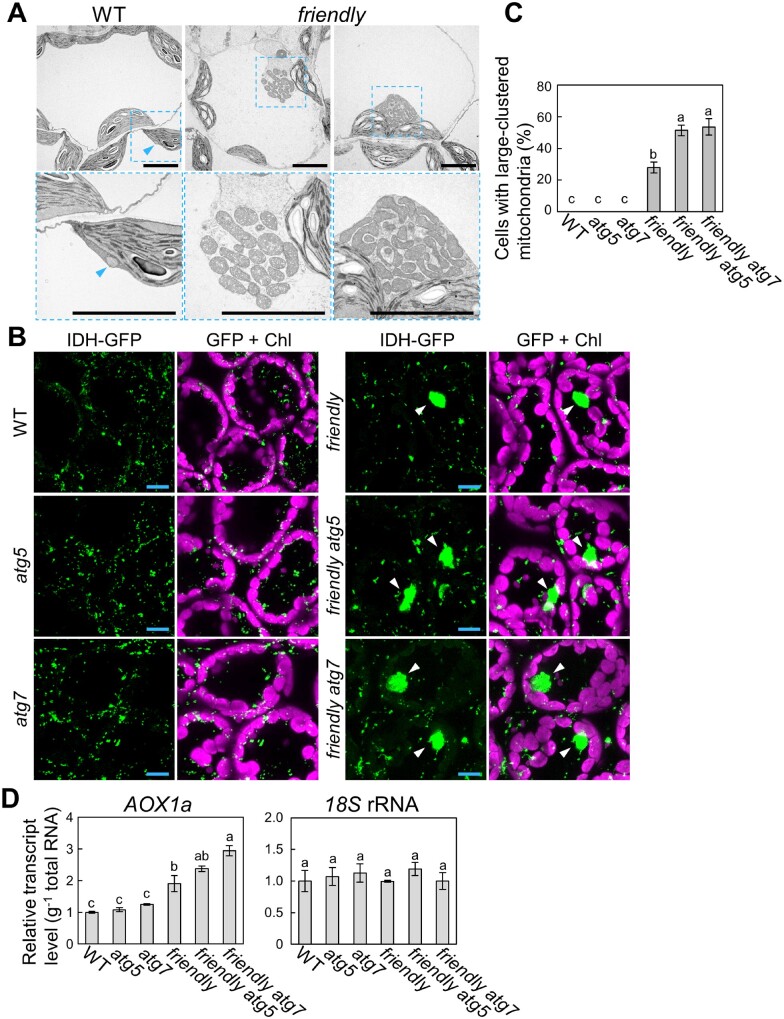
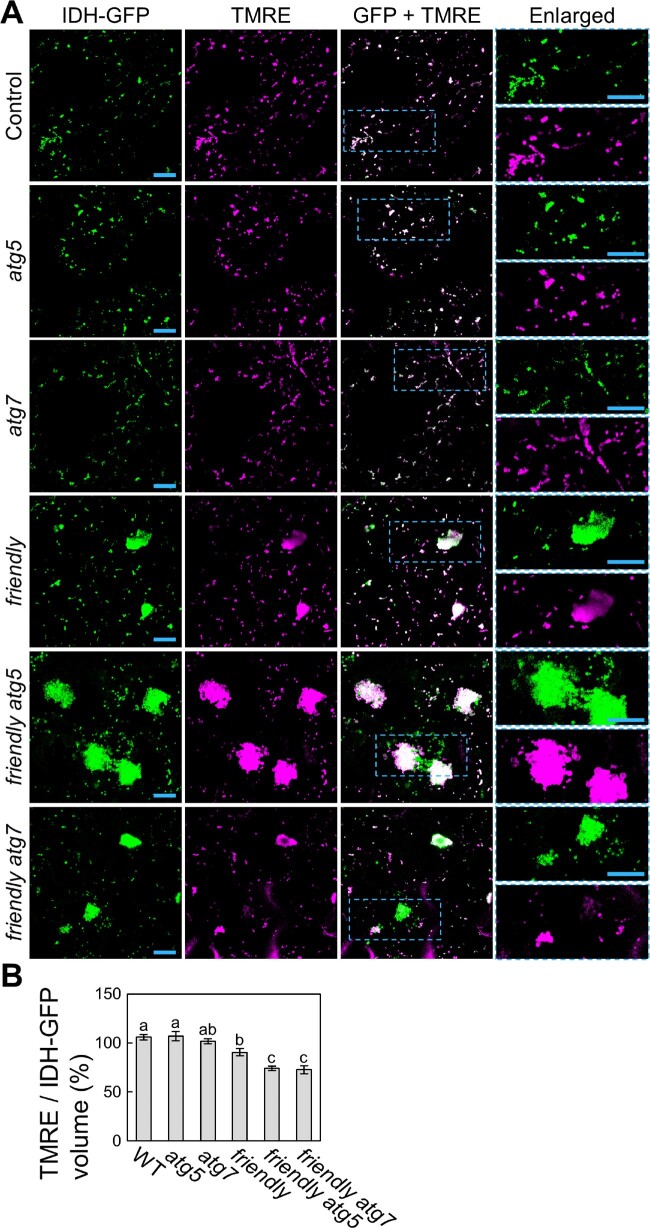
In autophagy, cytoplasmic components of eukaryotic cells are transported to lysosomes or the vacuole for degradation. Autophagy is involved in plant tolerance to the photooxidative stress caused by ultraviolet B (UVB) radiation, but its roles in plant adaptation to UVB damage have not been fully elucidated. Here, we characterized organellar behavior in UVB-damaged Arabidopsis (Arabidopsis thaliana) leaves and observed the occurrence of autophagic elimination of dysfunctional mitochondria, a process termed mitophagy. Notably, Arabidopsis plants blocked in autophagy displayed increased leaf chlorosis after a 1-h UVB exposure compared to wild-type plants. We visualized autophagosomes by labeling with a fluorescent protein-tagged autophagosome marker, AUTOPHAGY8 (ATG8), and found that a 1-h UVB treatment led to increased formation of autophagosomes and the active transport of mitochondria into the central vacuole. In atg mutant plants, the mitochondrial population increased in UVB-damaged leaves due to the cytoplasmic accumulation of fragmented, depolarized mitochondria. Furthermore, we observed that autophagy was involved in the removal of depolarized mitochondria when mitochondrial function was disrupted by mutation of the FRIENDLY gene, which is required for proper mitochondrial distribution. Therefore, autophagy of mitochondria functions in response to mitochondrion-specific dysfunction as well as UVB damage. Together, these results indicate that autophagy is centrally involved in mitochondrial quality control in Arabidopsis leaves.

Keywords: Arabidopsis (Arabidopsis thaliana); Autophagy; Mitochondria; Mitophagy; Organelle quality control; Ultraviolet B.


Figures

Fig. 1
Fig. 1
The loss of chlorophagy is not sufficient to explain the UVB-sensitive phenotype of Arabidopsis mutants harboring mutations of core autophagy genes. (A) Visual phenotypes of Arabidopsis plants 7 d before (control), or after 1-h UVB, 2-h UVB or 2-h HL exposure. WT, atg2, atg5 and atg7 plants were exposed to UVB (wavelength 280–315 nm) of 1.5 W m−2 for 1 or 2 h, or to high visible light consisting of 2,000 �mol m−2 s−1. Scale bars = 10 mm. (B) Confocal images of mesophyll cells expressing the tonoplast marker VHP1-mGFP from either nontreated control leaves or leaves 1, 2 or 3 d after UVB treatment (1.5 W m−2) or HL (2,000 μmol m−2 s−1) treatment for 2 h. Blue arrowheads indicate vacuole-enclosed chloroplasts. Green, VHP1-mGFP; magenta, chlorophyll autofluorescence. Only merged images are shown. Scale bars = 10 �m. (C) Proportion of cells with vacuole-enclosed chloroplasts in a fixed region, obtained from images described in (B) (� SE, n = 4). Different letters in each graph denote significant differences based on Tukey’s test (P < 0.05).
Fig. 2
Fig. 2
Behavior of plastid nucleoids, nuclei and peroxisomes in UVB-damaged leaves. (A) Confocal images of mesophyll cells expressing nucleus-targeted GFP from WT and atg5 untreated control plants or plants 1 d after a 1-h UVB (1.5 W m−2) exposure. (B) Mean nucleus volumes obtained from the three-dimensional images described in (A) (� SE, n = 4). (C) Confocal images of mesophyll cells expressing plastid nucleoid-targeted GFP from WT or atg5 untreated control plants or plants 1 d after a 1-h UVB (1.5 W m−2) exposure. (D) Number of plastid nucleoids, obtained from the three-dimensional images described in (C) (� SE, n = 4). (E) Confocal images of mesophyll cells expressing peroxisome-targeted GFP from WT and atg5 untreated control plants or plants 1 d after a 1-h UVB (1.5 W m−2) exposure. (F) Number of peroxisomes obtained from the three-dimensional images described in (E) (� SE, n = 4). For confocal images, orthogonal projections created from z-stack images are shown. Green, GFP; magenta, chlorophyll autofluorescence (Chl). Scale bars = 10 �m. Different letters in each graph denote significant differences based on Tukey’s test (P < 0.05).
Fig. 3
Fig. 3
Autophagy deficiency causes an increase in mitochondrial population in UVB-damaged leaves. (A) Confocal images of mesophyll cells expressing mitochondrion-targeted isocitrate dehydrogenase-GFP (IDH-GFP) from WT and atg5 untreated control plants or plants 1 d after a 1-h UVB (1.5 W m−2) exposure. (B) Mean numbers of mitochondria obtained from the three-dimensional images described in (A) (� SE, n = 4). (C) Transcript levels for IDH-GFP, IDH1 and ATG5 in leaves of WT and atg5 untreated control plants or plants 1 d after a 1-h UVB exposure (� SE, n = 3). Transcript levels of the respective genes are shown relative to the values from WT control leaves, which are set to 1. The level of 18S rRNA was measured as an internal control. (D) Confocal images of mesophyll cells expressing IDH-GFP from atg2 and atg7 untreated control plants or plants 1 d after a 1-h UVB exposure. (E) Number of mitochondria obtained from the three-dimensional images described in (D) (� SE, n = 4). For confocal images, orthogonal projections created from z-stack images are shown. Green, GFP; magenta, chlorophyll autofluorescence (Chl). Scale bars = 10 �m in each image. Different letters in each graph denote significant differences based on Tukey’s test (P < 0.05).
Fig. 4
Fig. 4
Autophagy deficiency causes an increase in the fraction of small mitochondria in UVB-damaged leaves. (A) Three-dimensional images of mesophyll cells expressing mitochondrial matrix-targeted GFP (MT-GFP) from WT, atg5 and atg7 untreated control plants or plants 1 d after a 1-h UVB exposure (1.5 W m−2) obtained using a two-photon excitation confocal microscope equipped with a spinning-disc unit. Green, GFP; magenta, chlorophyll autofluorescence (Chl). Scale bars = 10 �m. (B) Mean number of mitochondria from observations described in (A) (� SE, n = 3). Different letters denote significant differences based on Tukey’s test (P < 0.05). (C) Histograms showing the distribution of mitochondrial volumes obtained from the three-dimensional images in (A).
Fig. 5
Fig. 5
Electron microscopy of the cytoplasmic accumulation of small mitochondria in UVB-damaged atg5 leaves. (A) Transmission electron micrographs from mesophyll cells of WT and atg5 untreated control plants or plants 1 d after UVB exposure (1.5 W m−2) for 1 h. Blue arrowheads indicate mitochondria in cytoplasm. Scale bars = 2 �m. The area indicated by a dashed blue box is expanded to the right of each panel. (B) Histograms showing the distribution of mitochondrial sizes obtained from the TEM images in (A).
Fig. 6
Fig. 6
UVB damage activates autophagosome-mediated transport of mitochondria to the central vacuole. (A) Confocal images of mesophyll cells expressing mitochondrial IDH-GFP and autophagosomal RFP-ATG8a from untreated control plants or plants 1 d after a 1-h UVB (1.5 W m−2) exposure. Green, IDH-GFP; magenta, RFP-ATG8a; orange, chlorophyll autofluorescence (Chl). For UVB treatment, two representative images are shown. (B) Number of autophagic structures (top) and mitochondrion-associated autophagic structures (bottom) from (A) (� SE, n = 4). (C) Confocal images of mesophyll cells expressing mitochondrial IDH-RFP and the tonoplast membrane marker δTIP-YFP from ConA-treated leaves. Leaves of untreated control plants or plants immediately after a 1-h UVB exposure were subjected to a 1-d incubation with ConA. Green, IDH-RFP; magenta, δTIP-YFP; orange, chlorophyll autofluorescence. (D) Confocal images of mesophyll cells expressing mitochondrial IDH-GFP and autophagosomal RFP-ATG8a from ConA-treated leaves. Leaves of untreated control plants or plants immediately after a 1-h UVB (1.5 W m−2) exposure were subjected to a 2-d incubation with ConA. Green, IDH-GFP; magenta, RFP-ATG8a; orange, chlorophyll autofluorescence (Chl). For UVB treatment, two representative images are shown. Blue arrowheads indicate mitochondria colocalized with autophagosomal RFP-ATG8a signals in the vacuole. (E) Number of autophagic bodies (top) and mitochondrion-associated autophagic bodies (bottom) from (D) (� SE, n = 4). Throughout, scale bars = 10 μm; asterisks denote significant differences between control and UVB-treated plants based on Student’s t-test (***P < 0.001). The area indicated by a dashed blue box is expanded to the right of each panel.
Fig. 7
Fig. 7
Autophagy reduces the fraction of depolarized mitochondria caused by UVB damage. (A) Confocal images of mesophyll cells expressing MT-GFP and stained with TMRE from WT, atg5 and atg7 untreated control plants or plants 1 d after a 1-h UVB (1.5 W m−2) exposure. Green, mitochondrial GFP; magenta, TMRE. Orthogonal projections created from z-stack images are shown. Scale bars = 10 μm. The area indicated by a dashed blue box is expanded to the right of each panel. (B) Number of MT-GFP-labeled or TMRE-labeled mitochondria obtained from the observation described in (A) (� SE, n = 4). (C) Proportion of the number of TMRE particles in MT-GFP particles in (B). Different letters in each graph denote significant differences based on Tukey’s test (P < 0.05).
Fig. 8
Fig. 8
Autophagy alleviates the appearance of clustered mitochondria due to the friendly mutation. (A) Ultrastructure of mitochondria in mesophyll cells from WT and friendly plants. Ultra-thin sections from third rosette leaves were viewed by TEM. Scale bars = 5 �m. For friendly mutants, two representative images are shown. The area indicated by a dashed blue box is expanded below each panel. Blue arrowheads indicate non-clustered mitochondria in the cytoplasm. (B) Confocal images of leaves from 18-day-old IDH-GFP-expressing WT, atg5, atg7, friendly, friendly atg5 and friendly atg7 plants. Green, IDH-GFP; magenta, chlorophyll autofluorescence (Chl). Scale bars = 10 �m. White arrowheads indicate clustered mitochondria in the cytoplasm. (C) Proportion of cells with clustered mitochondria measured in leaves of 18-day-old untreated plants (� SE, n = 4). Different letters denote significant differences based on Tukey’s test (P < 0.05). (D) Transcript levels for AOX1a in leaves of 18-day-old untreated plants of the various genotypes (� SE, n = 3), relative to the values from WT leaves, which were set to 1. The level of 18S rRNA was measured as an internal control. Different letters in each graph denote significant differences based on Tukey’s test (P < 0.05).
Fig. 9
Fig. 9
Autophagy alleviates the accumulation of depolarized mitochondria due to friendly mutation. (A) Confocal images of TMRE-stained mesophyll cells from WT, atg5, atg7, friendly, friendly atg5 and friendly atg7 plants expressing mitochondrial IDH-GFP. Green, IDH-GFP; magenta, TMRE. Orthogonal projections created from z-stack images are shown. Scale bars = 10 �m. The area indicated by a dashed blue box is expanded to the right of each panel. (B) Proportion of the total volume from TMRE signals in MT-GFP signals obtained from the observations described in (A) (� SE, n = 6). Different letters denote significant differences based on Tukey’s test (P < 0.05).

Comment in

Similar articles

Cited by

References

    1. Arimura S.I. (2018) Fission and fusion of plant mitochondria, and genome maintenance. Plant Physiol. 176: 152–161. - PMC - PubMed
    1. Bhujabal Z., Birgisdottir A.B., Sjottem E., Brenne H.B., Overvatn A., Habisov S., et al. (2017) FKBP8 recruits LC3A to mediate Parkin-independent mitophagy. EMBO Rep. 18: 947–961. - PMC - PubMed
    1. Boesch P., Weber-Lotfi F., Ibrahim N., Tarasenko V., Cosset A., Paulus F., et al. (2011) DNA repair in organelles: pathways, organization, regulation, relevance in disease and aging. Biochim. Biophys. Acta 1813: 186–200. - PubMed
    1. Chung T., Phillips A.R., Vierstra R.D. (2010) ATG8 lipidation and ATG8-mediated autophagy in Arabidopsis require ATG12 expressed from the differentially controlled ATG12A AND ATG12B loci. Plant J. 62: 483–493. - PubMed
    1. Clausen C., Ilkavets I., Thomson R., Philippar K., Vojta A., M�Hlmann T., et al. (2004) Intracellular localization of VDAC proteins in plants. Planta 220: 30–37. - PubMed

MeSH terms