Meta-Analysis
. 2020 Dec;128(12):126002.
doi: 10.1289/EHP7171. Epub 2020 Dec 23.

Microplastic Contamination of Seafood Intended for Human Consumption: A Systematic Review and Meta-Analysis

Affiliations
Meta-Analysis

Microplastic Contamination of Seafood Intended for Human Consumption: A Systematic Review and Meta-Analysis

Evangelos Danopoulos et al. Environ Health Perspect. 2020 Dec.

Abstract

Background: Microplastics (MPs) have contaminated all compartments of the marine environment including biota such as seafood; ingestion from such sources is one of the two major uptake routes identified for human exposure.

Objectives: The objectives were to conduct a systematic review and meta-analysis of the levels of MP contamination in seafood and to subsequently estimate the annual human uptake.

Methods: MEDLINE, EMBASE, and Web of Science were searched from launch (1947, 1974, and 1900, respectively) up to October 2020 for all studies reporting MP content in seafood species. Mean, standard deviations, and ranges of MPs found were collated. Studies were appraised systematically using a bespoke risk of bias (RoB) assessment tool.

Results: Fifty studies were included in the systematic review and 19 in the meta-analysis. Evidence was available on four phyla: mollusks, crustaceans, fish, and echinodermata. The majority of studies identified MP contamination in seafood and reported MP content <1 MP/g, with 26% of studies rated as having a high RoB, mainly due to analysis or reporting weaknesses. Mollusks collected off the coasts of Asia were the most heavily contaminated, coinciding with reported trends of MP contamination in the sea. According to the statistical summary, MP content was 0-10.5 MPs/g in mollusks, 0.1-8.6 MPs/g in crustaceans, 0-2.9 MPs/g in fish, and 1 MP/g in echinodermata. Maximum annual human MP uptake was estimated to be close to 55,000 MP particles. Statistical, sample, and methodological heterogeneity was high.

Discussion: This is the first systematic review, to our knowledge, to assess and quantify MP contamination of seafood and human uptake from its consumption, suggesting that action must be considered in order to reduce human exposure via such consumption. Further high-quality research using standardized methods is needed to cement the scientific evidence on MP contamination and human exposures. https://doi.org/10.1289/EHP7171.


Figures

Figure 1 is a horizontal stacked bar graph plotting overall rating, reporting, analysis, sampling, and study design (y-axis) across percentage, ranging from 0 to 100 in increments of 25 (x-axis) for low risk of bias, unclear risk of bias, and high risk of bias.
Figure 1.
Risk of bias (RoB) assessment seafood studies. The three ratings are illustrated by percentage. The numerical data for the figure is provided in Table S6. Individual rating per study and per domain is provided in Table S7. Rating was executed according to the RoB tool (see Table S4 and the “RoB tool additional explanation” section in the Supplemental Material).
Figure 2 is an error bar graph plotting microplastics per gram log to the base 10, ranging from 0.1 to 10.0 in increments of 0.9 (y-axis) across Webb and others (2019), Fang and others (2018), Cho and others (2019), Phuong and others (2018 lowercase a), Baechler and others (2020), Wu and others (2020), Nam and others (2019), Akoueson and others (2020), Thushari and others (2017), Hermabessiere and others (2019), Van Cauwenberghe and others (2014), Ding and others (2019), Zhao and others (2018 lowercase b), Teng and others (2019), Zhu and others (2019), Brate and others (2018), Abidli and others (2019), Ding and others (2020), Su and others (2018), Li J. and others (2018), Qu and others (2018), Naji and others (2018), Li J. and others (2016), Ding and others (2018), Li H X and others (2018), Li J and others (2015), and Wang and others (2019 lowercase a) (x-axis). Webb and others (2019), Fang and others (2018), Cho and others (2019), Phuong and others (2018 lowercase a), Baechler and others (2020), Wu and others (2020), Nam and others (2019), Akoueson and others (2020), Thushari and others (2017), Hermabessiere and others (2019), Van Cauwenberghe and others (2014), Ding and others (2019), Zhao and others (2018 lowercase b), Teng and others (2019), Zhu and others (2019), and Brate and others (2018) is 0 to 0.9 microplastics per gram and Abidli and others (2019), Ding and others (2020), Su and others (2018), Li J. and others (2018), Qu and others (2018), Naji and others (2018), Li J. and others (2016), Ding and others (2018), Li H X and others (2018), Li J and others (2015), and Wang and others (2019 lowercase a) are 1 to 10.5 microplastics per gram.
Figure 2.
The overall microplastics per gram (MPs/g) content for mollusks illustrated in a log10 scale. Points represent mean MPs/g values for the studies, where reported. Whiskers represent the reported ranges of MPs/g.
Figure 3 is a line graph that plots percentage of similarity index, ranging from 60 to 80 in increments of 10 (y-axis) across microplastics per gram, ranging from 0.5 to 2.0 in increments of 0.5 (x-axis) for Pearson correlation coefficient equals 0.75 and lowercase italic p equals 0.054.
Figure 3.
Pearson correlation analysis between the amount of microplastics per gram (MPs/g) in mussels and the percentage of similarity compared with the spectral library that has been used as the level of acceptance. R is the Pearson correlation coefficient with the corresponding p-value. The gray-shaded area represents the 95% confidence belt.
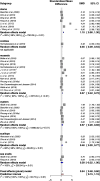
Figure 4 is a forest plot plotting Subgroup: Clams: Baechler and others (2020), Cho and others (2019), Ding and others (2019), Fang and others (2018), Li J and others (2015), Su and others (2018), Wang and others (2019 lowercase a), random effects model uppercase I squared equals 99 percent open bracket 99 percent; 99 percent closed bracket, lowercase chi from 2 to 6 equals 790.29 (lowercase italic p less than 0.01); cockles: Hermabessiere and others (2019), random effects model: not applicable; mussels: Brate and others (2018), Cho and others (2019), Ding and others (2019), Hermabessiere and others (2019), Li J and others (2018) lowercase a, Li J and others (2018) lowercase b, Li J and others (2015), Nam and others (2019), Phuong and others (2018) lowercase a, Van Cauwenberghe and Janssen (2014), Webb and others (2019), Zhao and others (2018 lowercase b), random effects model uppercase I squared equals 100 percent open bracket 99 percent; 100 percent closed bracket, lowercase chi from 2 to 11 equals 2373.34 (lowercase italic p less than 0.01); oysters: Abidli and others (2019), Baechler and others (2020), Cho and others (2019), Phuong and others (2018 lowercase a), Teng and others (2019), Van Cauwenberghe and Janssen (2014), Zhu and others (2019), random effects model uppercase I squared equals 100 percent open bracket 100 percent; 100 percent closed bracket, lowercase chi from 2 to 6 equals 10963.32 (lowercase italic p less than 0.01); scallops: Akoueson and others (2020), Cho and others (2019), Li J and others (2015), random effects model uppercase I squared equals 98 percent open bracket 96 percent; 99 percent closed bracket, lowercase chi from 2 to 2 equals 89.28 (lowercase italic p less than 0.01); Sea snails: Abidli and others (2019), ), Fang and others (2018), random effects model uppercase I squared equals 100 percent, lowercase chi from 2 to 1 equals 265.84 (lowercase italic p less than 0.01); Fixed effects (plural) model prediction interval, and random effects model uppercase I squared equals 100 percent open bracket 100 percent; 100 percent closed bracket, lowercase chi from 2 to 5 equals 33.73 (lowercase italic p less than 0.01) (y-axis) across standardized mean difference, ranging from negative 5 to 5 in increments of 5 (x-axis).
Figure 4.
Forest plot for subgroup analysis between six molluskan families using a mixed-effects model (random-effects model for studies within each category and fixed-effect model between family categories). Studies were weighted using the inverse of the variance method (Chen and Peace 2013). The x-axis represents the standardized mean difference expressed in microplastics per gram (MPs/g). The vertical line is the line of null effect where MP content is 0. The gray boxes represent the pooled effect estimate and the lines the 95% confidence interval (CI). The size of the boxes is proportional to the study weight. The diamonds are the combined point estimates and CI for each of the subgroups. The dotted line is the overall pooled effect for all subgroups with a corresponding diamond. The red box is the 95% prediction interval. The a (superscript) samples collected form the environment; b (superscript) samples collected form the market (J Li et al. 2018).
Figure 5 is a forest plot plotting Study with microplastics content reported by each study (T E) and calculated standard error (s e T E), including Brate and others (2018), 0.97 and 0.14; Cho and others (2019), 0.12, and 0.01; Ding and others (2019), 0.29 and 0.05; Li J and others (2018) lowercase a, 1.74 and 0.06; Li J and others (2018) lowercase b, 0.91 and 0.03; Li J and others (2015), 2.39 and 0.31; Nam and others (2019), 0.29 and 0.06; Phuong and others (2018 lowercase a), 0.23 and 0.02; Van Cauwenberghe and Janssen (2014), 0.36 and 0.01; and plotting Overall microplastics content (mussels risk of bias) prediction interval, Heterogeneity: I squared equals 99 percent, lowercase tau squared equals 0.10, lowercase italic p less than 0.01 (y-axis) across microplastics per gram, ranging from negative 2 to 2 in unit increments (x-axis) for standardized mean difference.
Figure 5.
Forest plot for random-effects model results for mussels without the two high risk of bias (RoB) studies (Hermabessiere et al. 2019; SY Zhao et al. 2018). The x-axis represents the standardized mean difference (SMD) expressed in microplastics per gram (MPs/g). TE is the MP content reported by each study, and seTE is the calculated standard error. The vertical line is the line of null effect where MP content is 0. The gray boxes represent the pooled effect estimate and the whiskers, the 95% confidence interval (CI). The size of the boxes is proportional to the study weight. The diamond is the combined point estimate and 95% CI, and the dotted line is the overall pooled effect. The black box represents the 95% prediction interval. The a (superscript) samples collected form the environment; b (superscript) samples collected form the market (J Li et al. 2018).
Figure 6 is a forest plot plotting Study with microplastics content reported by each study and calculated standard error, including Cho and others (2019), 0.07 and 0.01; Phuong and others (2018 lowercase a), 0.18 and 0.02; Teng and others (2019), 0.62 and 0.05; Van Cauwenberghe and Janssen (2014), 0.47 and 0.05; Zhu and others (2019), 0.80 and 0.04; Overall microplastics content (oysters sensitivity analysis) Prediction interval; Heterogeneity: I squared equals 99 percent, lowercase tau squared equals 0.07, lowercase italic p less than 0.01 (y-axis) across microplastics per gram, ranging from negative 1 to 1 in increments of 0.5 for standardized mean difference.
Figure 6.
Forest plot for random-effects model for oysters, sensitivity analysis results without the high-risk of bias study (Baechler et al. 2020), and the statistical outlier of extremely large effects (Abidli et al. 2019). The x-axis represents the standardized mean difference (SMD) expressed in microplastics per gram (MPs/g). TE is the MP content reported by each study, and seTE is the calculated standard error. The vertical line is the line of null effect where MP content is 0. The gray boxes represent the pooled effect estimate and the whiskers the 95% confidence interval (CI). The size of the boxes is proportional to the study weight. The diamond is the combined point estimate and 95% CI, and the dotted line is the overall pooled effect. The black box represents the 95% prediction interval. Note: an., analysis.
Figure 7 is an error bar graph plotting microplastics per gram log base 10, ranging from 0.1 to 1.0 in increments of 0.9 and 1.0 to 10.0 in increments of 9 (y-axis) across crabs, Fang and others (2018); shrimps, Fang and others (2018); shrimps, Wu and others (2020); barnacles, Thushari and others (2017); shrimps, Hossain and others (2020); and shrimps, J Wang and others (2019) (x-axis).
Figure 7.
The overall microplastics per gram (MPs/g) content for crustacean families of shrimps, barnacles, and crabs; illustrated in a log10 scale. Points represent mean MPs/g values and whiskers represent the corresponding standard deviations (SDs). The results of Hossain et al. (2020) and Thushari et al. (2017) have been pooled per family and species, respectively. A, shrimps; B, barnacles; C, crabs.
Figure 8 is a world map depicting maximum microplastic particles uptake through mollusk consumption. A color key depicting maximum yearly microplastic uptake ranges as follows: 0, 1 to 210, 211 to 630, 631 to 1,785, 1,786 to 3,780, 3,781 to 6,825, 6,826 to 9,030, 9,031 to 15,120, 15,121 to 38,535, and 38,536 to 104,790.
Figure 8.
Predicted global yearly maximum microplastic (MP) particles uptake through mollusk consumption. The data have been calculated using the FAO (2020a) consumption data for the different mollusks’ families per country and the maximum MPs/g content of mollusks derived from the statistical summary results herein. The numerical data is shown in Table S15. MP data were classified in 10 categories using quantile classification for illustration purposes. The hatched areas illustrate countries for which data on mollusk consumption were not available.

Comment in

References

    1. Abbasi S, Keshavarzi B, Moore F, Turner A, Kelly FJ, Dominguez AO, et al. . 2019. Distribution and potential health impacts of microplastics and microrubbers in air and street dusts from Asaluyeh County, Iran. Environ Pollut 244:153–164, PMID: 30326387, 10.1016/j.envpol.2018.10.039. - DOI - PubMed
    1. Abidli S, Lahbib Y, Trigui El Menif N. 2019. Microplastics in commercial molluscs from the lagoon of Bizerte (Northern Tunisia). Mar Pollut Bull 142:243–252, PMID: 31232300, 10.1016/j.marpolbul.2019.03.048. - DOI - PubMed
    1. Akhbarizadeh R, Dobaradaran S, Nabipour I, Tajbakhsh S, Darabi AH, Spitz J. 2020. Abundance, composition, and potential intake of microplastics in canned fish. Mar Pollut Bull 160:111633, PMID: 33181921, 10.1016/j.marpolbul.2020.111633. - DOI - PubMed
    1. Akoueson F, Sheldon LM, Danopoulos E, Morris S, Hotten J, Chapman E, et al. . 2020. A preliminary analysis of microplastics in edible versus non-edible tissues from seafood samples. Environ Pollut 263(pt A):114452, PMID: 32302891, 10.1016/j.envpol.2020.114452. - DOI - PubMed
    1. Avio CG, Gorbi S, Regoli F. 2015. Experimental development of a new protocol for extraction and characterization of microplastics in fish tissues: first observations in commercial species from Adriatic Sea. Mar Environ Res 111:18–26, PMID: 26210759, 10.1016/j.marenvres.2015.06.014. - DOI - PubMed

Publication types

MeSH terms