. 2021 Jan;21(1):109-118.
doi: 10.1080/14737159.2020.1865806. Epub 2020 Dec 28.

Predicting wet age-related macular degeneration (AMD) using DARC (detecting apoptosing retinal cells) AI (artificial intelligence) technology

Affiliations

Predicting wet age-related macular degeneration (AMD) using DARC (detecting apoptosing retinal cells) AI (artificial intelligence) technology

Paolo Corazza et al. Expert Rev Mol Diagn. 2021 Jan.

Abstract

Objectives: To assess a recently described CNN (convolutional neural network) DARC (Detection of Apoptosing Retinal Cells) algorithm in predicting new Subretinal Fluid (SRF) formation in Age-related-Macular-Degeneration (AMD).

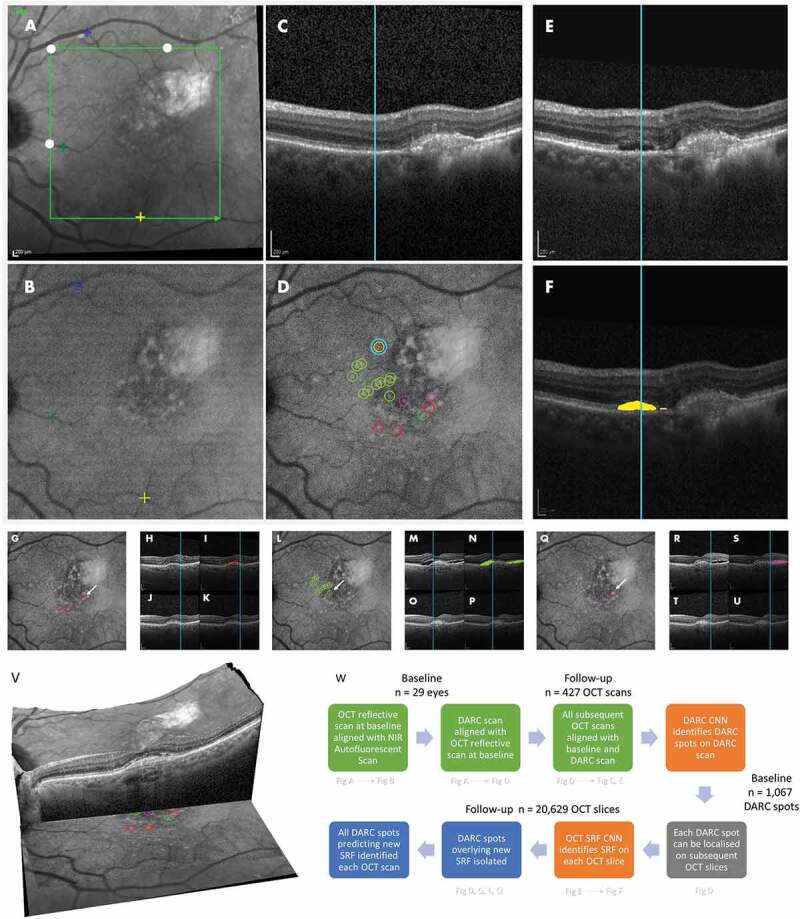
Methods: Anonymized DARC, baseline and serial OCT images (n = 427) from 29 AMD eyes of Phase 2 clinical trial (ISRCTN10751859) were assessed with CNN algorithms, enabling the location of each DARC spot on corresponding OCT slices (n = 20,629). Assessment of DARC in a rabbit model of angiogenesis was performed in parallel.

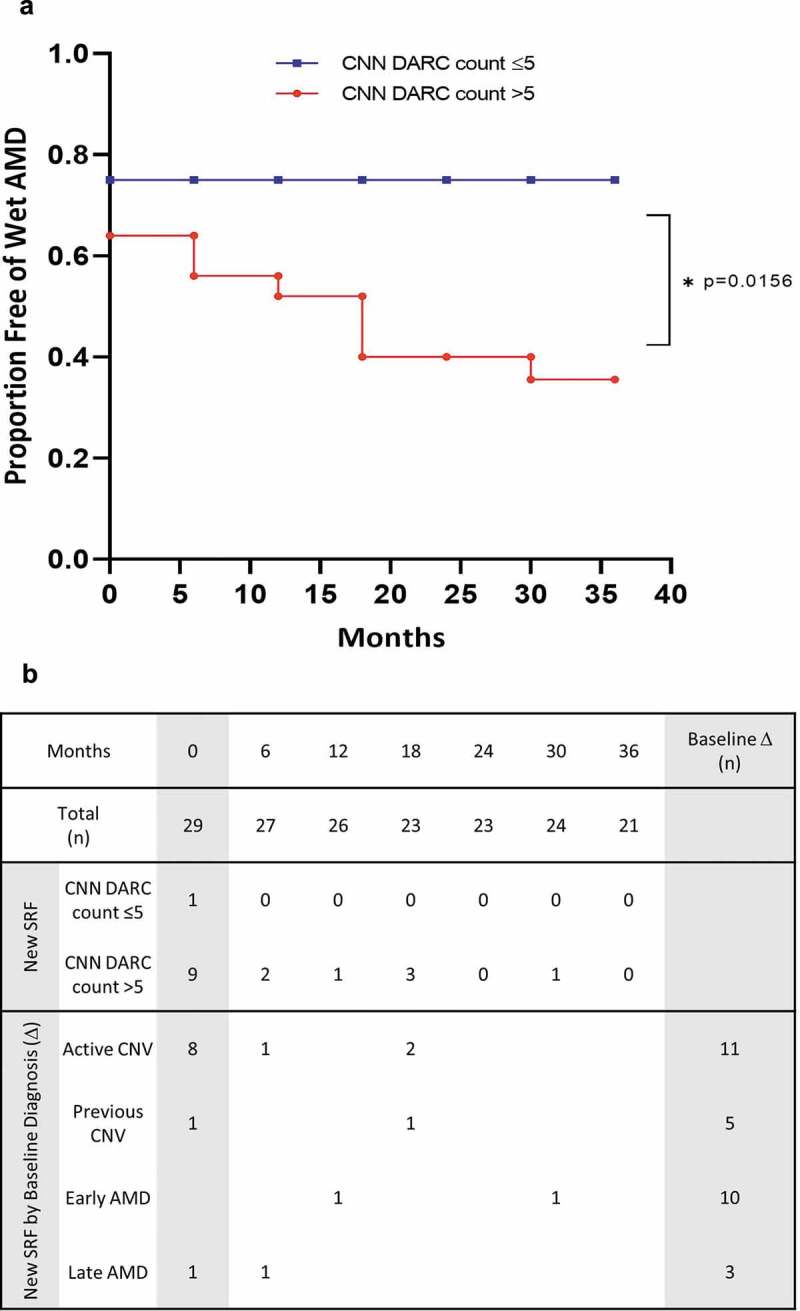
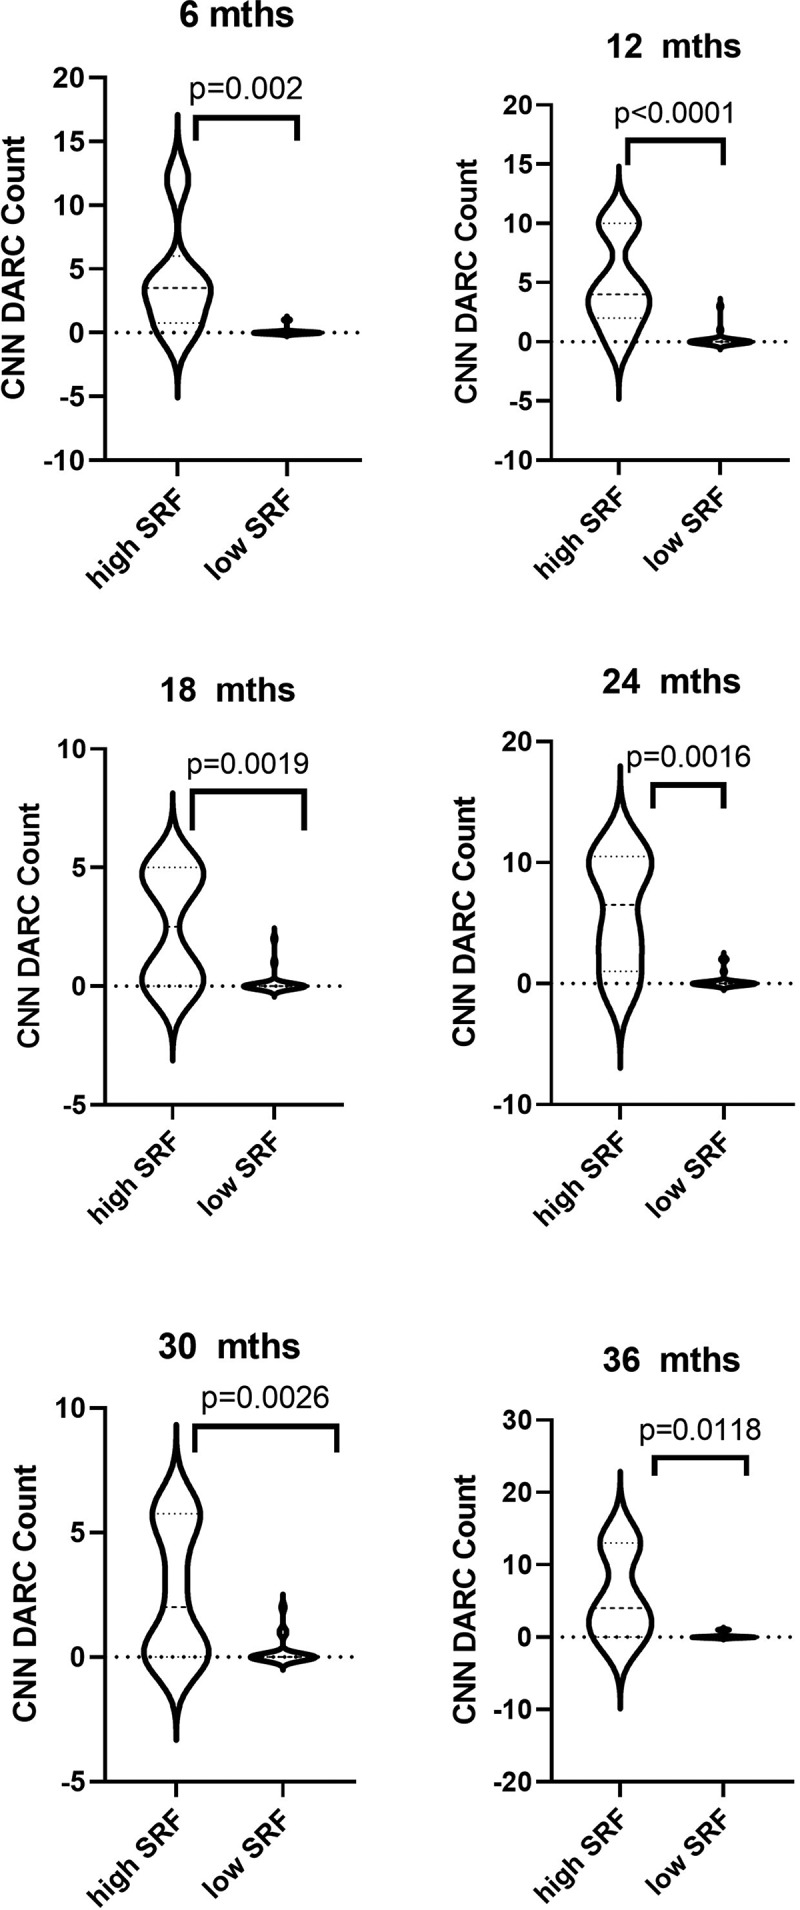
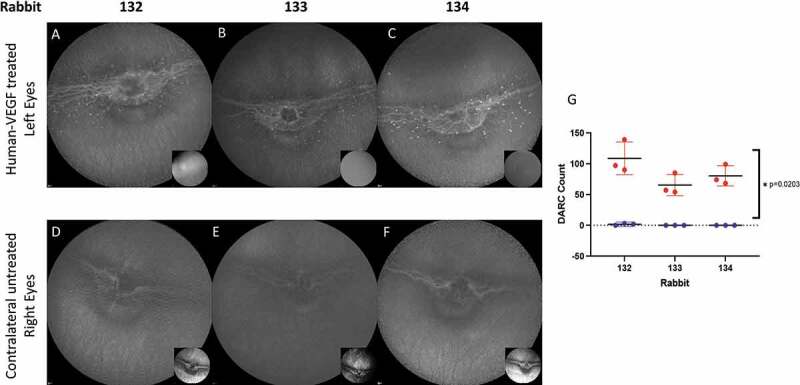
Results: A CNN DARC count >5 at baseline was significantly (p = 0.0156) related to development of new SRF throughout 36 months. Prediction rate of eyes using unique DARC spots overlying new SRF had positive predictive values, sensitivities and specificities >70%, with DARC count significantly (p < 0.005) related to the magnitude of SRF accumulation at all time points. DARC identified earliest stages of angiogenesis in-vivo.

Conclusions: DARC was able to predict new wet-AMD activity. Using only an OCT-CNN definition of new SRF, we demonstrate that DARC can identify early endothelial neovascular activity, as confirmed by rabbit studies. Although larger validation studies are required, this shows the potential of DARC as a biomarker of wet AMD, and potentially saving vision-loss.

Keywords: AMD; CNV; DARC; SRF; angiogenesis; biomarker.


Figures

Figure 1.
Figure 1.
DARC CNN System predicts new Subretinal Fluid (wet AMD) in OCT at 36 months. Alignment application: for each eye, the reflective OCT localization map (A) is aligned to the baseline autofluorescent image captured with confocal Scanning Laser Ophthalmoscope (cSLO) (B) and the OCT scan (C), utilizing a bespoke application involving automatic landmarks defining OCT areas in serial scans ((filled white circles) and the manual placement of fiducial markers (yellow and blue crosses, A, B). The DARC image (D) is taken 240 minutes after intravenous Anx776 is administered with the cSLO, and is automatically aligned to the baseline autofluorescent image (B) which is now also aligned with the OCT images (A, C). Corresponding points in the DARC image can then be located in the OCT scan (C) using the cyan vertical line, allowing identification of all cross-sectional structures in the OCT image at that vertical location. Hence, in this example, at baseline, the location of the cyan encircled yellow DARC spot (D), can be recorded by x,y coordinates in all the retinal layers of the baseline OCT scan (C). This can be done for all DARC spots, with corresponding points located in all follow-up OCT scans. DARC spot localization: DARC spots are automatically detected using a previously described CNN-aided algorithm3. The cyan encircled yellow DARC spot (D), is located on the baseline (C) and aligned to the follow-up OCT scan at 36 months (E). The presence of new subretinal fluid (SRF) is automatically identified by a SRF CNN and outlined in the annotated image at 36 months (purple area, F). This shows the cyan encircled yellow DARC spot (D) is predictive of new SRF 36 months later (E, F). Unique DARC spot prediction: Each individual DARC spot seen at baseline can be assessed in relation to the series of OCT scans performed at follow-up. Unique DARC spots associated with SRF (D) are encircled with different colors representing different time-points; including: 12–18 months (red, D, G), 18–24 months (light green, D, L), 24–30 months (purple, D, Q) and 30–36 months (yellow, D). These are shown with corresponding OCT scans at follow-up original (H, M, R) and baseline (J, O, T) with SRF CNN-defined newly formed SRF with the same color-coding showing annotated new SRF areas (I, N, S) compared to baseline (K, P, U). The cyan line in each OCT scan highlights the vertical cross-section through the indicated DARC spot (white arrows; G, L, Q). Alignment of slices from OCT volume scan example and DARC image. (V) The OCT volume scan made up of 50 OCT slices at baseline is shown with DARC spot localization to summarize the method. Process flowchart (W) Each step referring to individual figures (A-U) are outlined in flowchart, which also quantifies the images analyzed in study
Figure 2.
Figure 2.
A CNN DARC Count >5 is associated with risk of developing SRF (wet AMD) in OCT over 36 months. (A) Plots showing the proportion of eyes remaining free of SRF (free of wet AMD) over 36 months, grouped by the CNN DARC count > 5 (red) or ≤5 (blue). Eyes with a CNN DARC count > 5 have a significantly increased level of developing SRF (Wilcoxon rank, p = 0.0156) compared to those with a CNN DARC count ≤5. (B) Table showing a breakdown of the conversion eyes by baseline diagnosis. All 7 eyes which went on to develop new SRF had CNN DARC counts >5, and 16 of the 17 eyes with either active CNV at baseline (n = 10) or which converted on follow-up (n = 7), had a CNN DARC count >5
Figure 3.
Figure 3.
CNN DARC counts significantly increased in eyes with large areas of SRF accumulation. Violin plots illustrating the distribution of data of unique DARC spots overlying SRF on OCT with the total area of accumulated SRF on OCT at each time point. To detect CNV lesions on the OCT, a CNN was used to identify areas of SRF, trained using data from The Retinal OCT Fluid Challenge (RETOUCH). To allow for the uneven number of OCT scans within 6-month intervals and between eyes, an average area of SRF was computed per interval. Eyes were divided into ‘high SRF’ and ‘low SRF’ using a threshold of 3000um2. Interestingly, a unique DARC count greater than 5 in all eyes, at all time points, is are associated with large SRF accumulation. All p-values indicate level of Mann-Whitney’s significance. Horizontal lines indicate medians and interquartile ranges with minimum and maximum points
Figure 4.
Figure 4.
DARC identifies earliest changes of endothelial activity in a rabbit model of angiogenesis. A rabbit model of angiogenesis was created by intravitreal administration of 1 ug in 50 ul of human VEGF (hVEGF165 – Peprotech, London UK) to the left eyes only of 3 rabbits. 2 and 4 days later intravenous ANX776 (0.2 mg) and 1% sodium fluorescein was given. Both eyes of rabbits were imaged using the ICGA and FFA settings of cSLO. DARC spots (identified as white spots which are ANX776 positive-labeled) are clearly visible in the left (A-C) hVEGF treated eyes compared to untreated right eyes (D-F). DARC counts were obtained by three masked manual observers. (G) Individual points represent separate manual observations of left and right eyes. All hVEGF eyes showed positive DARC staining compared to untreated, contralateral eyes. There was a significant difference (p = 0.0203) between DARC counts in treated compared to control eyes. Inserts (A-F) show fluorescein angiography 4 days after treatment with hVEGF. All treated eyes went on to show fluorescein leakage at 4 days, (inserts A-C) compared to control (inserts D-F)

Similar articles

Cited by

References

    1. Bourne RRA. Prevalence and causes of vision loss in high-income countries and in Eastern and Central Europe in 2015: magnitude, temporal trends and projections. Br J Ophthalmol. 2018. May;102(5):575–585. . - PMC - PubMed
    1. Rein DB, Wittenborn JS, Zhang X, et al. Forecasting age-related macular degeneration through the year 2050: the potential impact of new treatments. Arch Ophthalmol. 2009. April;127(4):533–540. . - PubMed
    1. Lindekleiv H, Erke MG.. Projected prevalence of age-related macular degeneration in Scandinavia 2012–2040. Acta Ophthalmol. 2013. June;91(4):307–311. . - PubMed
    1. Wong WL. Global prevalence of age-related macular degeneration and disease burden projection for 2020 and 2040: A systematic review and meta-analysis. Lancet Glob Health. 2014. February;2(2):DOI:10.1016/S2214-109X(13)70145-1 - DOI - PubMed
    1. Colijn JM. Prevalence of age-related macular degeneration in europe: the past and the future. Ophthalmology. 2017. December;124(12):1753–1763. . - PMC - PubMed

Publication types