

Associations Between Fetal Growth Trajectories and the Development of Myopia by 20 Years of Age
- PMID: 33355605
- PMCID: PMC7774062
- DOI: 10.1167/iovs.61.14.26
Associations Between Fetal Growth Trajectories and the Development of Myopia by 20 Years of Age
Abstract
Purpose: To evaluate the contribution of genetic and early life environmental factors, as reflected by fetal anthropometric growth trajectories, toward the development of myopia during childhood and adolescence.
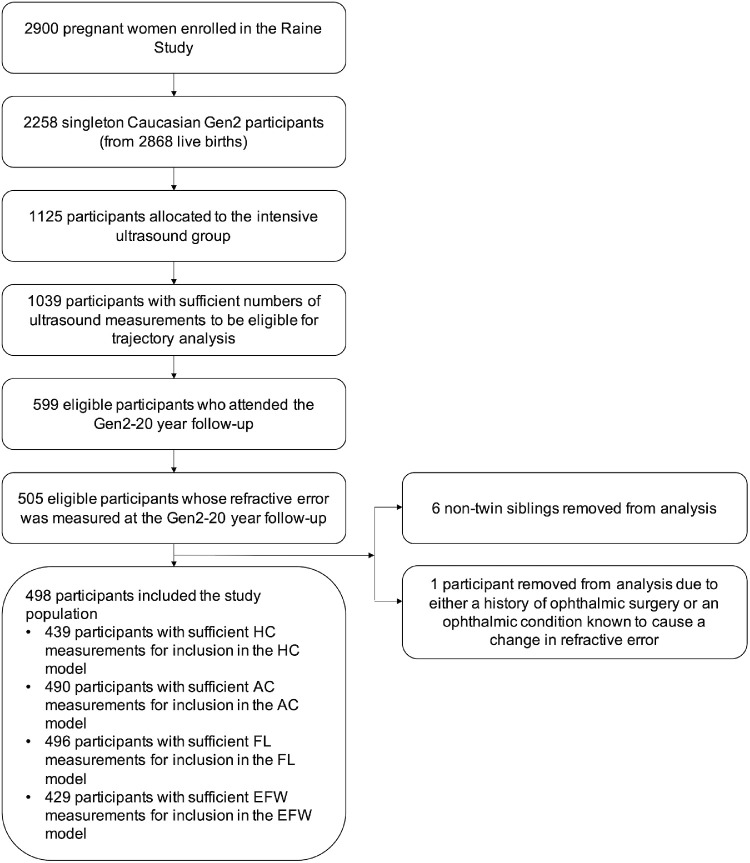
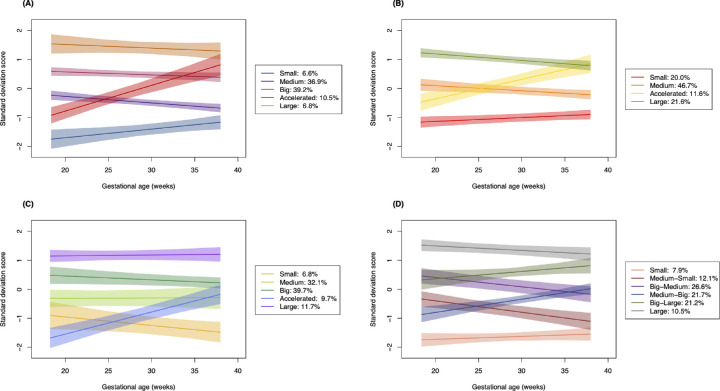
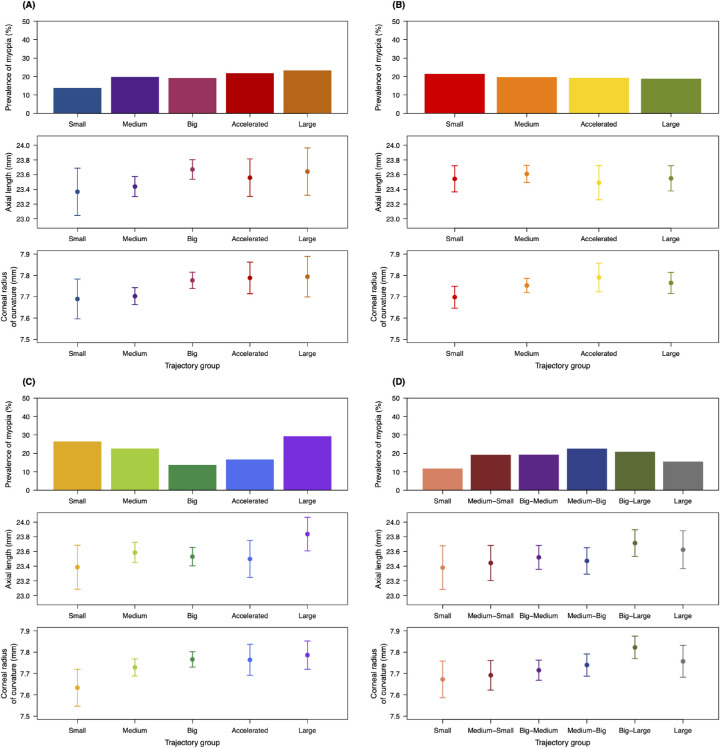
Methods: This analysis included 498 singleton Caucasian participants from the Raine Study, a pregnancy cohort study based in Western Australia. Serial fetal biometric measurements of these participants were collected via ultrasound scans performed at 18, 24, 28, 34, and 38 weeks' gestation. At a 20-year follow-up, the participants underwent a comprehensive ophthalmic examination, including cycloplegic autorefraction and ocular biometry measurements. Using a group-based trajectory modeling approach, we identified groups of participants with similar growth trajectories based on measurements of fetal head circumference (HC), abdominal circumference, femur length (FL), and estimated fetal weight (EFW). Differences between trajectory groups with respect to prevalence of myopia, axial length (AL), and corneal radius of curvature measured at the 20-year follow-up were evaluated via logistic regression and analysis of variance.
Results: Prevalence of myopia was highest among participants with consistently short or consistently long FLs (P = 0.04). There was also a trend toward increased prevalence with larger HC in late gestation, although not at a statistically significant level. Trajectory groups reflecting faster HC, FL, or EFW growth correlated with significantly flatter corneas (P = 0.03, P = 0.04, and P = 0.01, respectively) and a general, but not statistically significant, increase in AL.
Conclusions: Environmental or genetic factors influencing intrauterine skeletal growth may concurrently affect ocular development, with effects persisting into adulthood.
Conflict of interest statement
Disclosure:
Figures
Similar articles
-
Prevalence and Risk Factors of Myopia in Young Adults: Review of Findings From the Raine Study.Front Public Health. 2022 Apr 27;10:861044. doi: 10.3389/fpubh.2022.861044. eCollection 2022. Front Public Health. 2022. PMID: 35570945 Free PMC article. Review.
-
Associations of 12-year sleep behaviour trajectories from childhood to adolescence with myopia and ocular biometry during young adulthood.Ophthalmic Physiol Opt. 2022 Jan;42(1):19-27. doi: 10.1111/opo.12905. Epub 2021 Oct 22. Ophthalmic Physiol Opt. 2022. PMID: 34676908
-
Prediction of small-for-gestational-age neonates at 35-37 weeks' gestation: contribution of maternal factors and growth velocity between 32 and 36 weeks.Ultrasound Obstet Gynecol. 2019 May;53(5):630-637. doi: 10.1002/uog.20267. Epub 2019 Apr 8. Ultrasound Obstet Gynecol. 2019. PMID: 30912210
-
Ultrasound-based gestational-age estimation in late pregnancy.Ultrasound Obstet Gynecol. 2016 Dec;48(6):719-726. doi: 10.1002/uog.15894. Ultrasound Obstet Gynecol. 2016. PMID: 26924421 Free PMC article.
-
Relationships between intrauterine fetal growth trajectories and markers of adiposity and inflammation in young adults.Int J Obes (Lond). 2022 Oct;46(10):1925-1935. doi: 10.1038/s41366-022-01203-2. Epub 2022 Aug 17. Int J Obes (Lond). 2022. PMID: 35978103 Free PMC article.
Cited by
-
The Relationship Between Fetal Growth and Retinal Nerve Fiber Layer Thickness in a Cohort of Young Adults.Transl Vis Sci Technol. 2022 Jul 8;11(7):8. doi: 10.1167/tvst.11.7.8. Transl Vis Sci Technol. 2022. PMID: 35819290 Free PMC article.
-
Prevalence and Risk Factors of Myopia in Young Adults: Review of Findings From the Raine Study.Front Public Health. 2022 Apr 27;10:861044. doi: 10.3389/fpubh.2022.861044. eCollection 2022. Front Public Health. 2022. PMID: 35570945 Free PMC article. Review.
-
Association of fetal growth trajectory with mitochondrial DNA copy number in the cord blood of newborns: evidence from a birth cohort.Front Pediatr. 2025 Jun 9;13:1569702. doi: 10.3389/fped.2025.1569702. eCollection 2025. Front Pediatr. 2025. PMID: 40551778 Free PMC article.
-
Changes in Refractive Error During Young Adulthood: The Effects of Longitudinal Screen Time, Ocular Sun Exposure, and Genetic Predisposition.Invest Ophthalmol Vis Sci. 2023 Nov 1;64(14):28. doi: 10.1167/iovs.64.14.28. Invest Ophthalmol Vis Sci. 2023. PMID: 37982764 Free PMC article.
References
-
- Achiron R, Kreiser D, Achiron A. Axial growth of the fetal eye and evaluation of the hyaloid artery: in utero ultrasonographic study. Prenat Diagn. 2000; 20(11): 894–899. - PubMed
-
- Denis D, Righini M, Scheiner C, et al. .. Ocular growth in the fetus: 1. Comparative study of axial length and biometric parameters in the fetus. Ophthalmologica. 1993; 207(3): 117–124. - PubMed
-
- Fledelius HC, Christensen AS, Fledelius C. Juvenile eye growth, when completed? An evaluation based on IOL-Master axial length data, cross-sectional and longitudinal. Acta Ophthalmol. 2014; 92(3): 259–264. - PubMed
-
- Vecino E, Acera A. Development and programed cell death in the mammalian eye. Int J Dev Biol. 2015; 59(1–3): 63–71. - PubMed
Publication types
MeSH terms
LinkOut - more resources
Full Text Sources
Medical
