. 2021 Feb 1;220(2):e202008029.
doi: 10.1083/jcb.202008029.

An ATM-Chk2-INCENP pathway activates the abscission checkpoint

Affiliations

An ATM-Chk2-INCENP pathway activates the abscission checkpoint

Eleni Petsalaki et al. J Cell Biol. .

Abstract

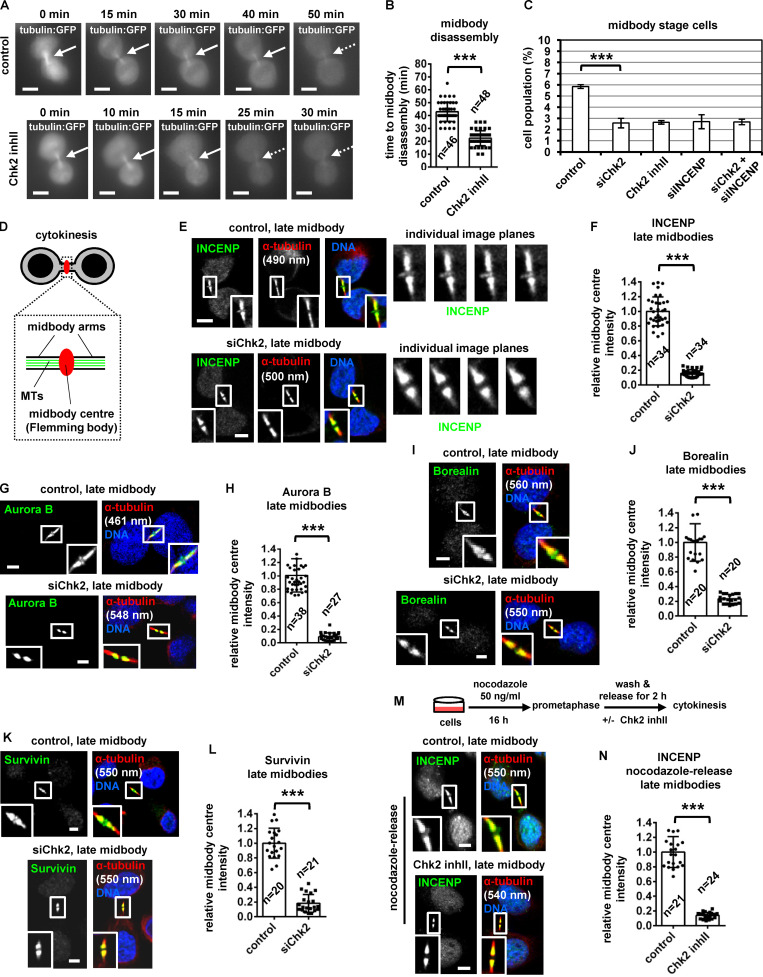
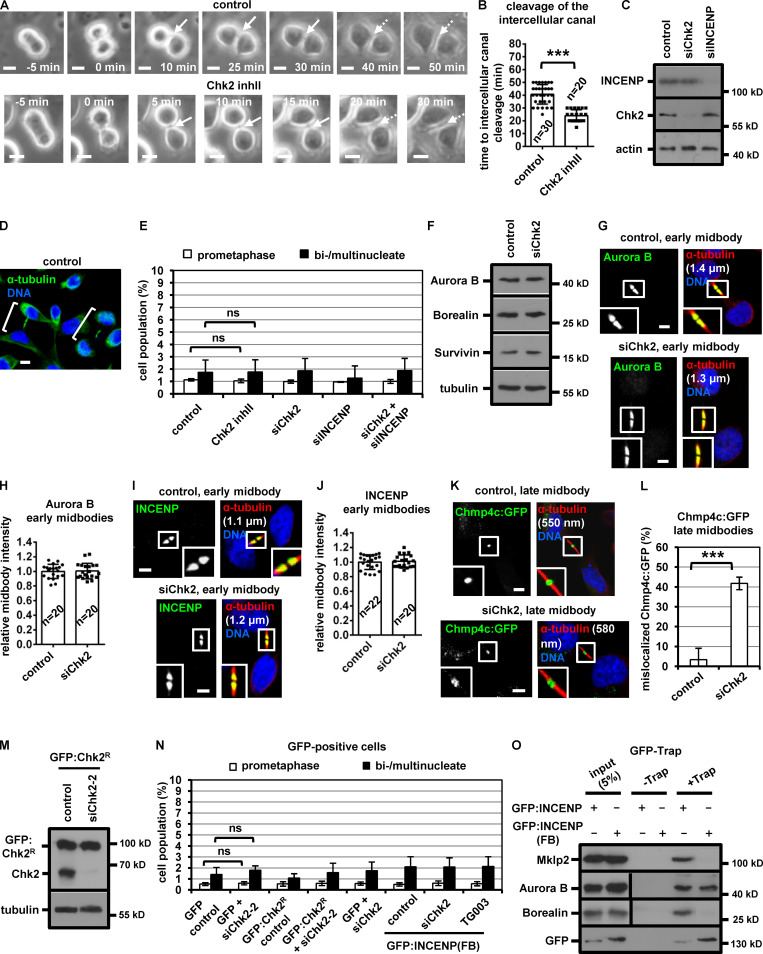
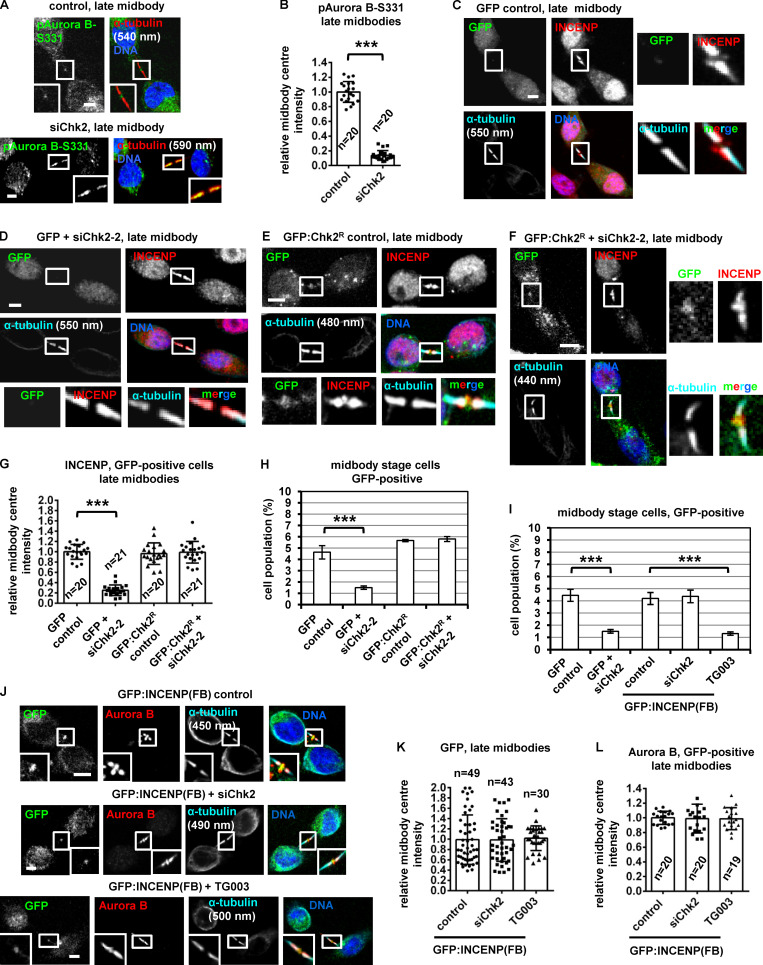
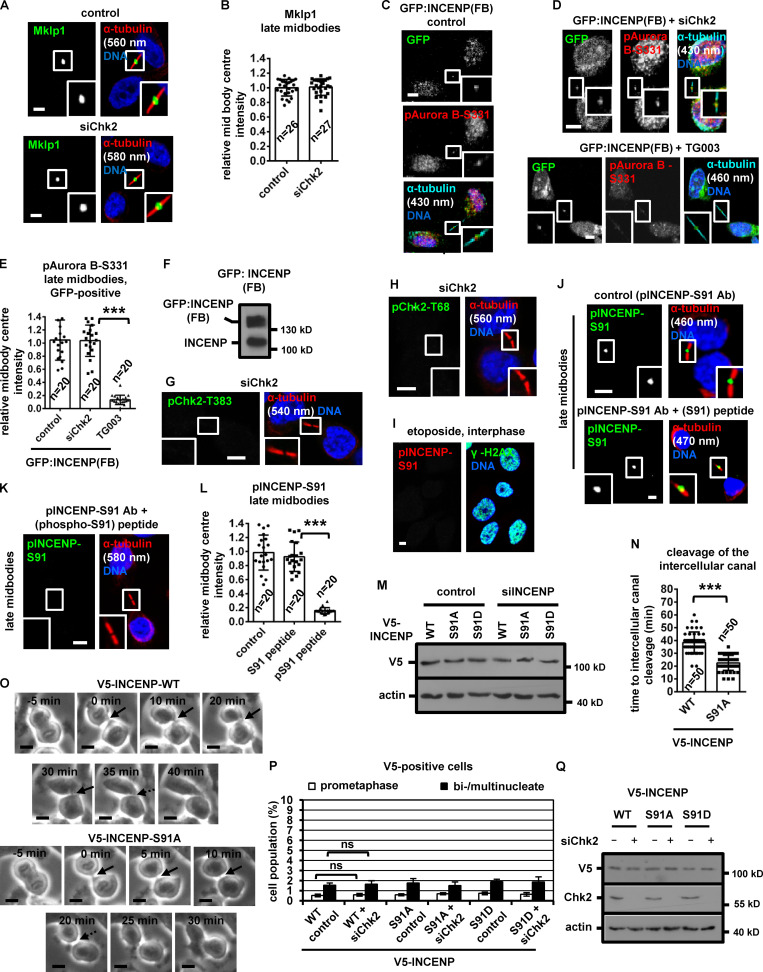
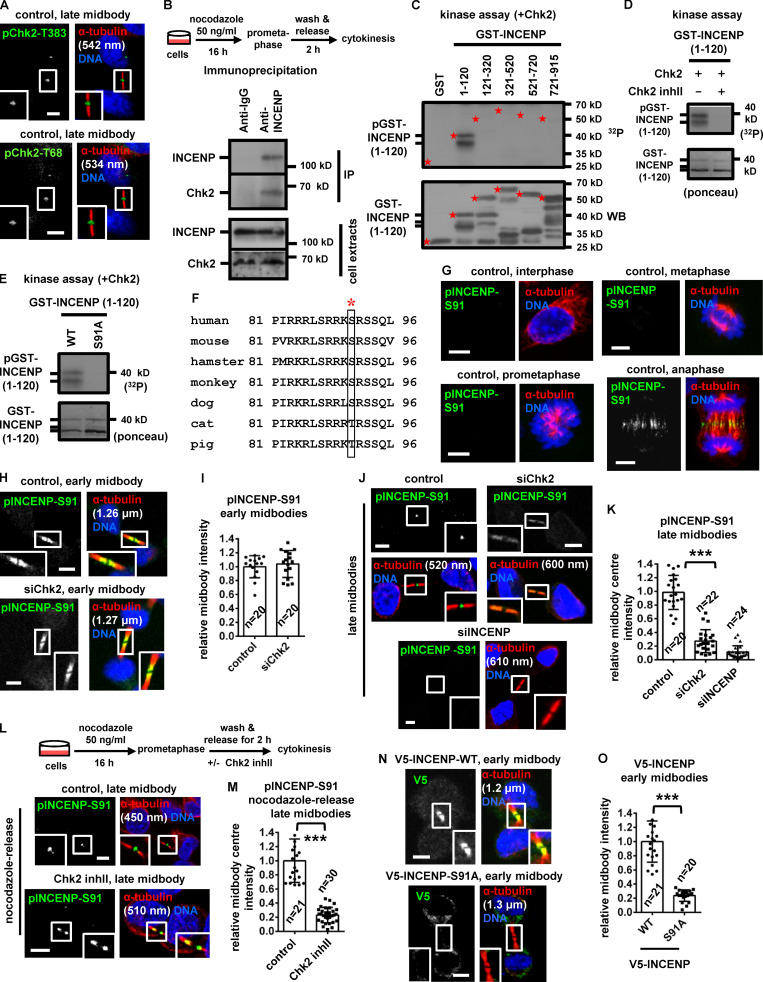
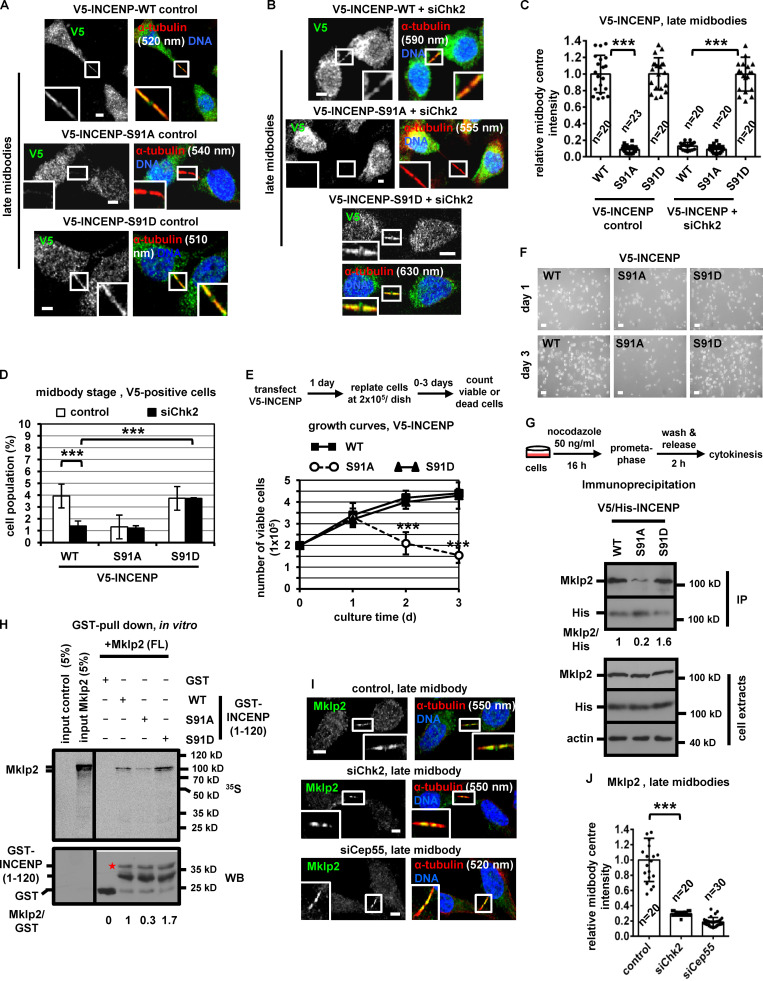
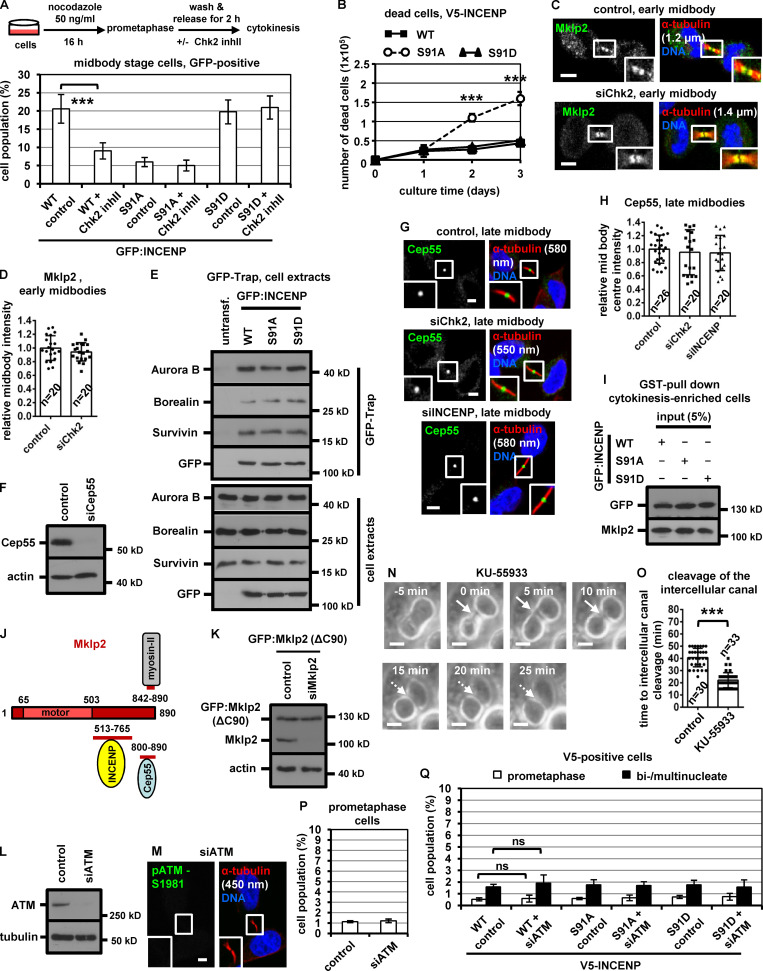
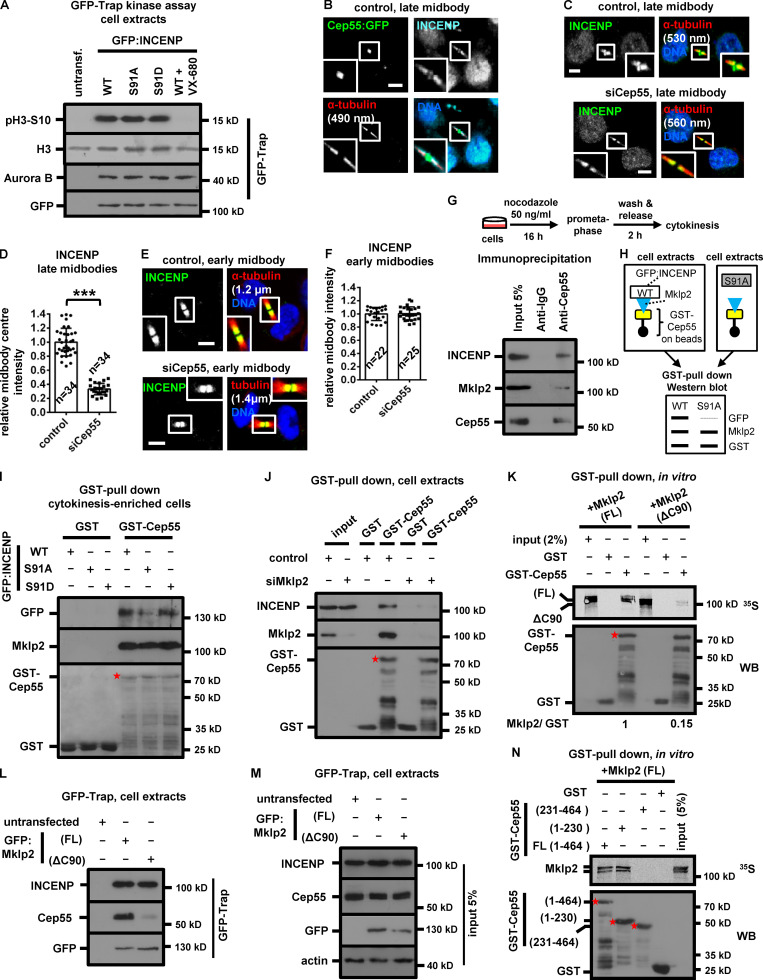
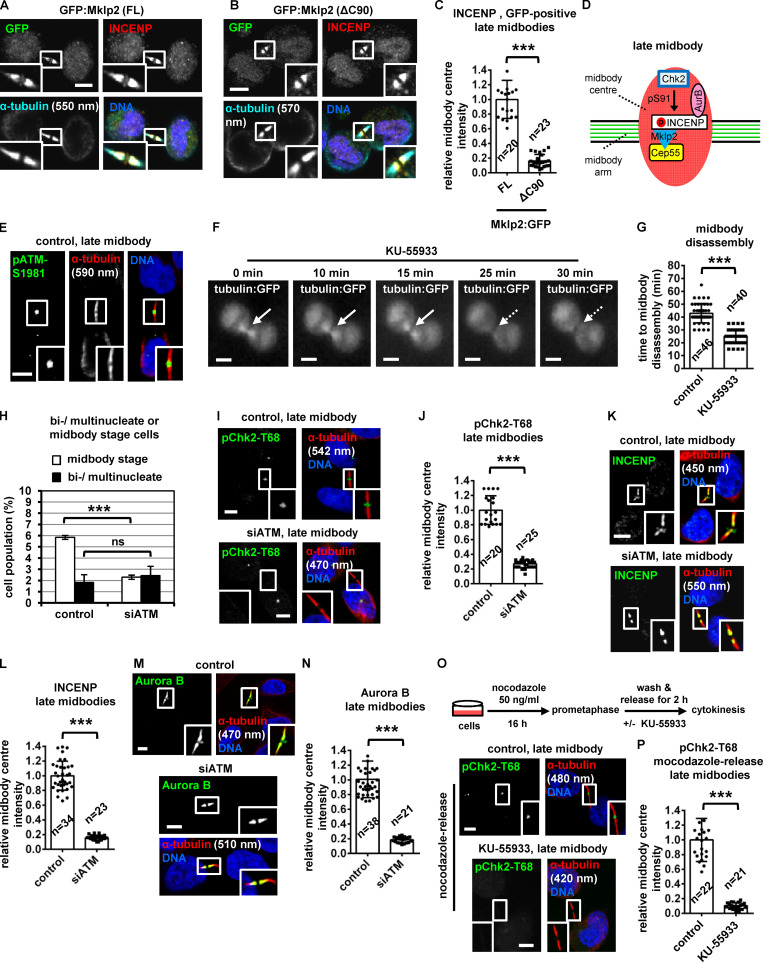
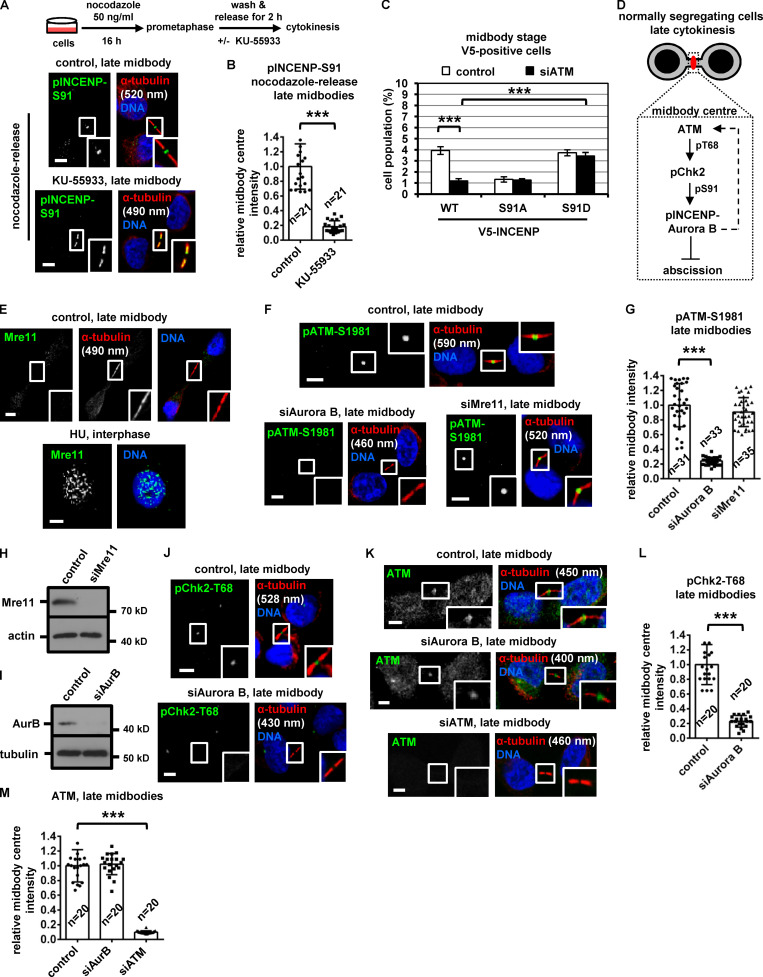
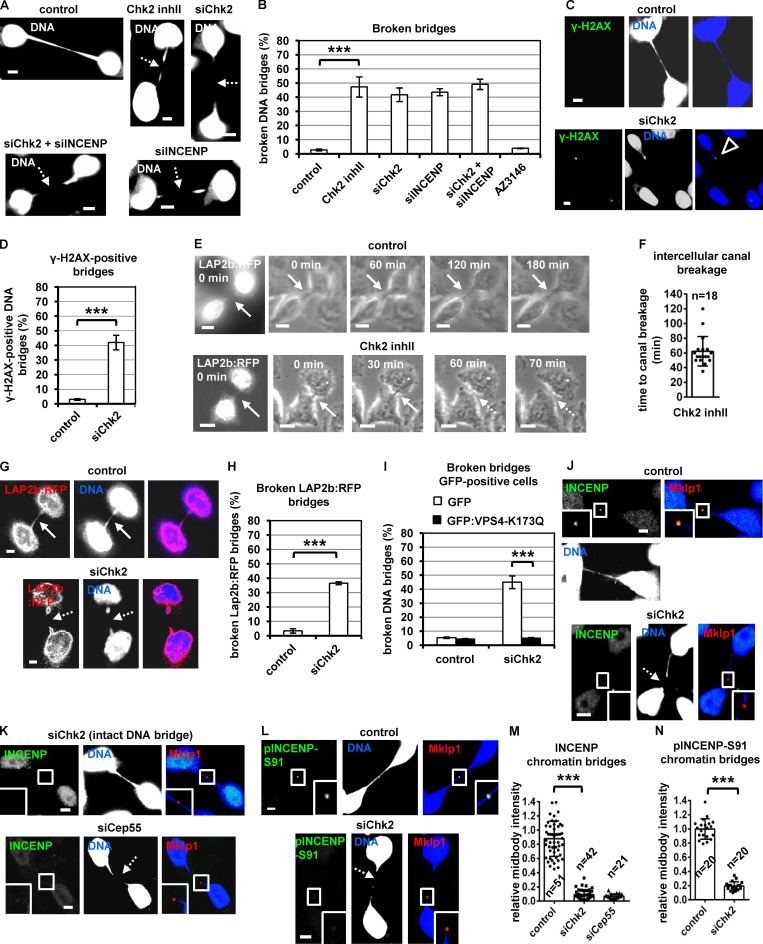
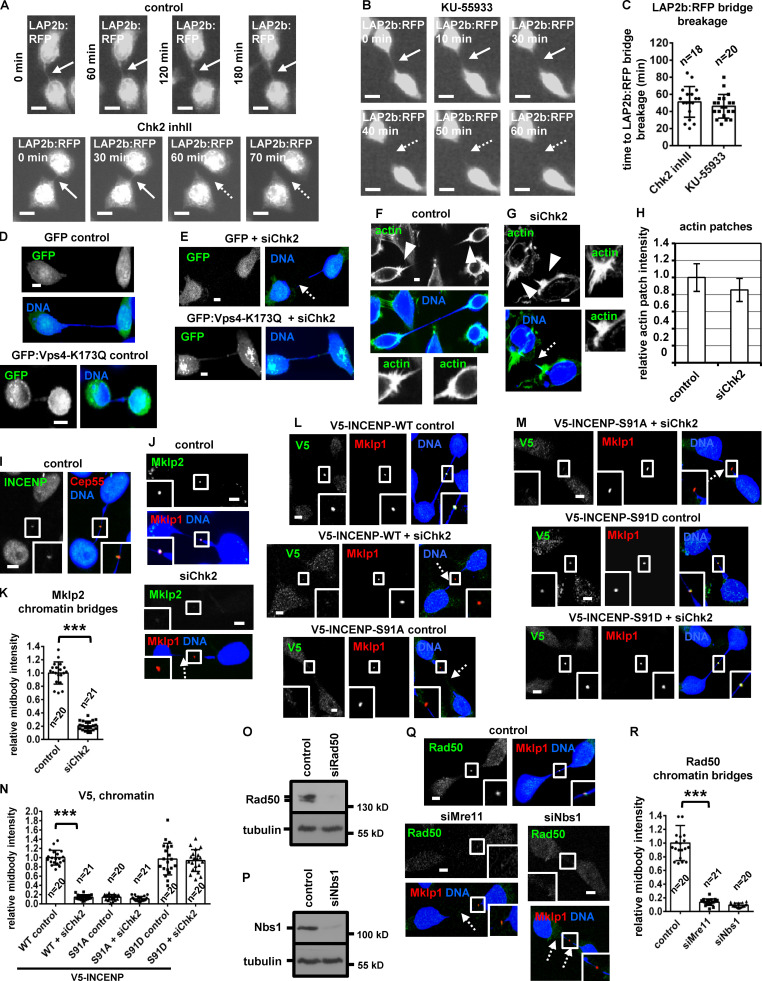
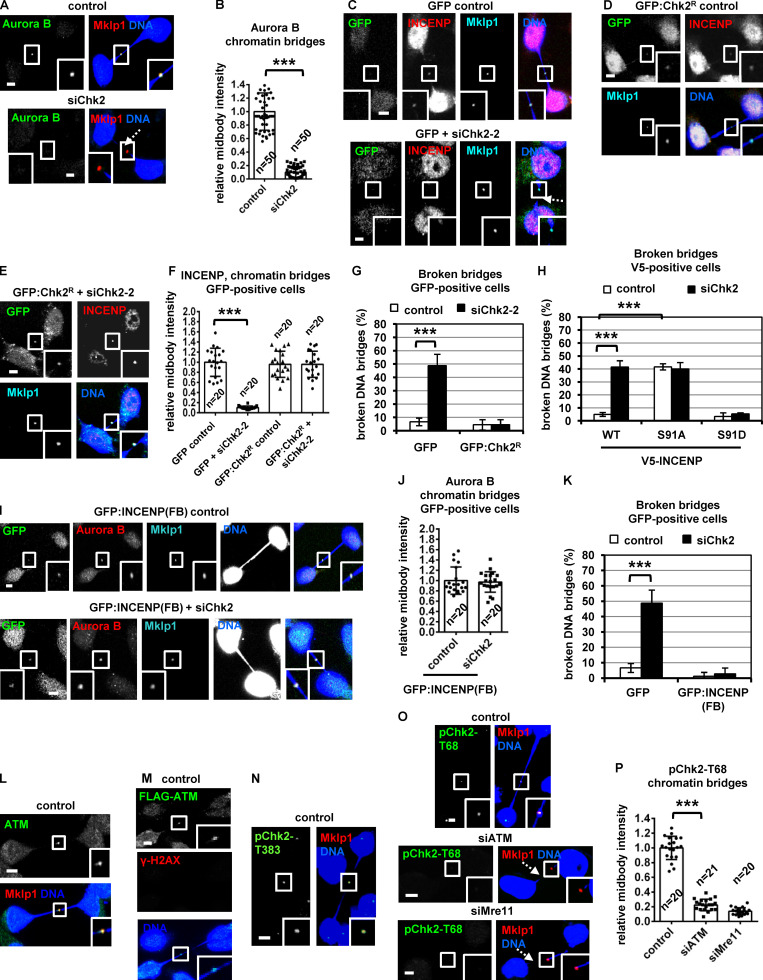
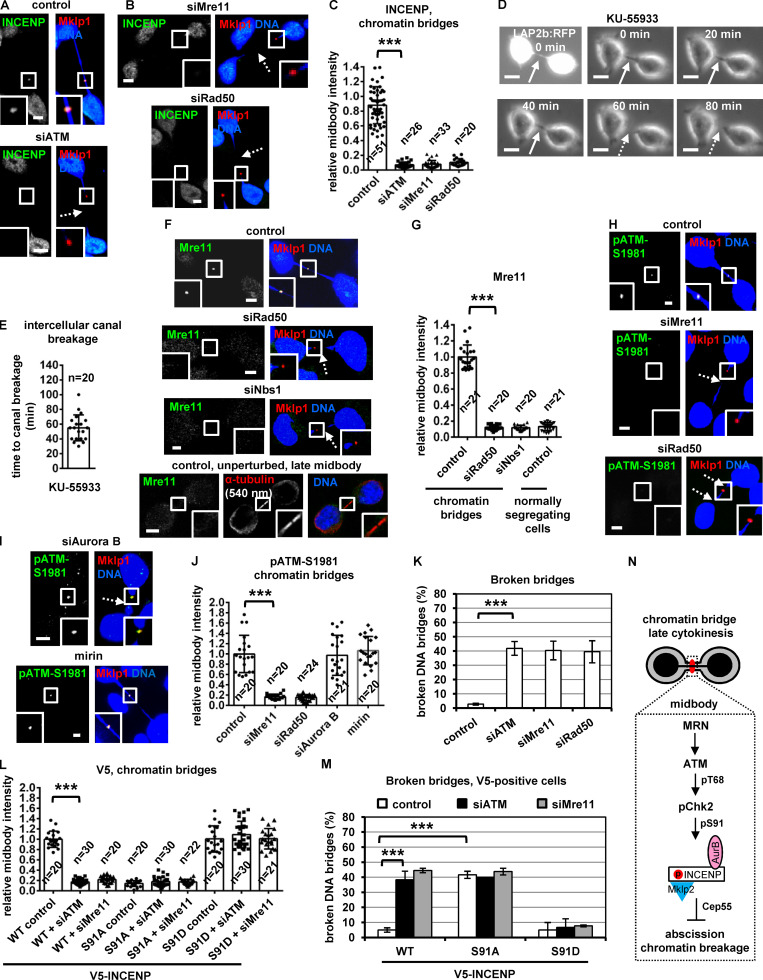
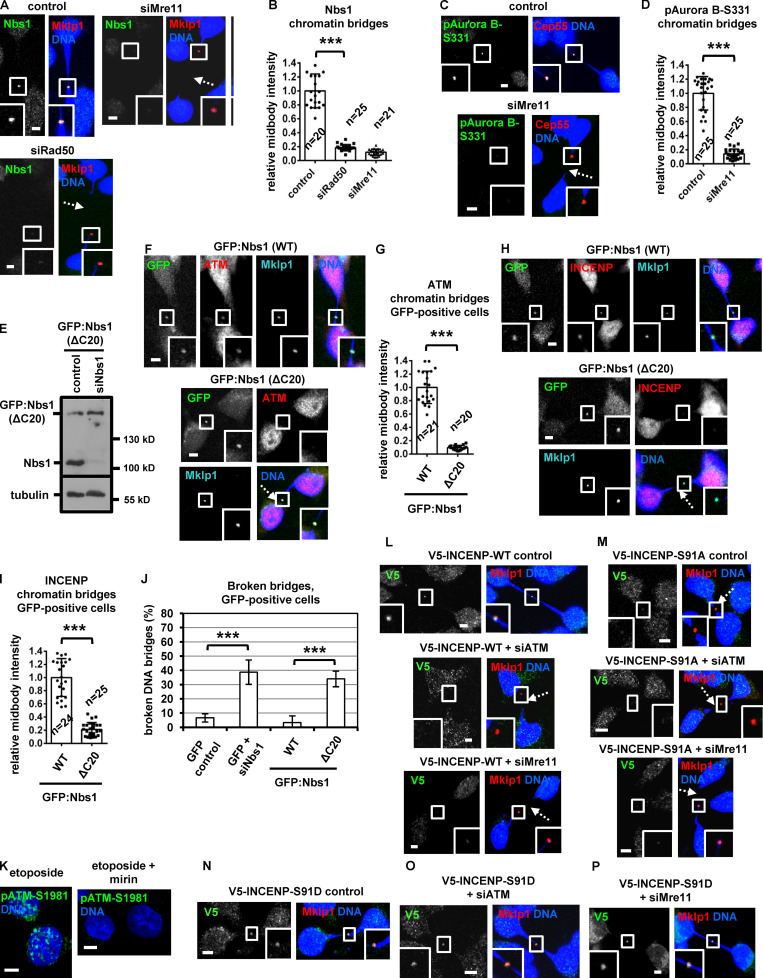
During cell division, in response to chromatin bridges, the chromosomal passenger complex (CPC) delays abscission to prevent chromosome breakage or tetraploidization. Here, we show that inhibition of ATM or Chk2 kinases impairs CPC localization to the midbody center, accelerates midbody resolution in normally segregating cells, and correlates with premature abscission and chromatin breakage in cytokinesis with trapped chromatin. In cultured human cells, ATM activates Chk2 at late midbodies. In turn, Chk2 phosphorylates human INCENP-Ser91 to promote INCENP binding to Mklp2 kinesin and CPC localization to the midbody center through Mklp2 association with Cep55. Expression of truncated Mklp2 that does not bind to Cep55 or nonphosphorylatable INCENP-Ser91A impairs CPC midbody localization and accelerates abscission. In contrast, expression of phosphomimetic INCENP-Ser91D or a chimeric INCENP protein that is targeted to the midbody center rescues the abscission delay in Chk2-deficient or ATM-deficient cells. Furthermore, the Mre11-Rad50-Nbs1 complex is required for ATM activation at the midbody in cytokinesis with chromatin bridges. These results identify an ATM-Chk2-INCENP pathway that imposes the abscission checkpoint by regulating CPC midbody localization.


Figures

Figure 1.
Figure 1.
Chk2 inhibition diminishes localization of CPC proteins to the midbody center in late midbodies. (A and B) Time-lapse microscopy analysis of HeLa cells expressing tubulin:GFP. Cells were untreated (control) or treated with 10 µM Chk2 inhibitor II immediately before filming. Midbodies are shown by solid arrows. Time is from midbody formation to midbody disassembly (dotted arrows). Related to Video 1 and Video 2. (C) Frequency of midbody stage cells. BE cells were transfected as indicated, or treated with 10 µM Chk2 inhibitor II (inhII) for 4 h. Values represent mean ± SD from three independent experiments (n > 900). ***, P < 0.001 (ANOVA and Student’s t test). (D) Midbody cartoon. MTs, microtubules. (E–L) Localization and mean intensity of CPC proteins at the midbody center in BE cells. Individual image planes show 3.5× magnification of the midbodies. (M and N) INCENP localization and mean intensity after treatment of BE cells with 10 µM Chk2 inhII in cytokinesis. Values represent mean ± SD from n cells. Values in control were set to 1. ***, P < 0.001 (Student’s t test). Tubulin values indicate midbody thickness. Insets show 1.6× magnification of the midbodies. Scale bars, 5 µm.
Figure S1.
Figure S1.
Chk2-depletion correlates with mislocalization of Chmp4c:GFP in late midbodies. (A and B) Phase-contrast live-cell microscopy analysis of HeLa tubulin:GFP cells. Cells were untreated (control) or treated with 10 µM Chk2 inhibitor II (inhII) immediately before filming. Intercellular canals are shown by solid arrows. Time is from formation of an intercellular canal to canal cleavage (dotted arrows). Related to Video 3 and Video 4. (C and F) Western blot analysis of total CPC proteins, Chk2, actin and tubulin from BE cell extracts. (D) Examples of BE cells at midbody stage (shown in brackets). (E and N) Frequency of bi/multinucleate or prometaphase BE cells. Cells were transfected as indicated or treated with 10 µM Chk2 inhibitor II or TG003 for 4 h. Values represent mean ± SD from three independent experiments (n > 90). (G–J) Localization of Aurora B or INCENP and mean intensity at the midbody in BE cells in early midbodies. Values represent mean ± SD from n cells. Values in control were set to 1. (K and L) Chmp4c:GFP localization and frequency of BE cells exhibiting mislocalized Chmp4c:GFP (two dots) at late midbodies. Values represent mean ± SD from three independent experiments (n > 90). Tubulin values indicate midbody thickness. Insets show 1.6× magnification of the midbodies. (M) Western blot analysis of total Chk2 and tubulin in cells transfected with siRNA-resistant GFP:Chk2R. (O) GFP-Trap assay. BE cell lysates were incubated with GFP-Trap (+Trap) or agarose beads only (−Trap). Precipitated proteins were analyzed by Western blotting. ns, not statistically significant; ***, P < 0.001 (Student’s t test). Scale bars, 5 µm.
Figure 2.
Figure 2.
Expression of GFP:INCENP(FB) rescues the frequency of cells at midbody stage after Chk2 inhibition. (A and B) Localization and mean intensity of phosphorylated Aurora B-Ser331 (pAurora B-Ser331) at the midbody center in BE cells. ***, P < 0.001 (Student’s t test). (C–G and J–L) Localization and mean intensity of GFP, INCENP, and Aurora B proteins at the midbody center in BE cells transfected with siRNA or treated with 10 µM TG003 for 4 h. Values represent mean ± SD from n cells. Values in control were set to 1. (H and I) Frequency of midbody stage BE cells. Values represent mean ± SD from three independent experiments (n > 900). ***, P < 0.001 (ANOVA and Student’s t test). Tubulin values indicate midbody thickness. Insets show 1.6× (A and J) or 3.5× (C–F) magnification of the midbodies. Scale bars, 5 µm.
Figure S2.
Figure S2.
Expression of Ser91A V5-INCENP accelerates cleavage of the intercellular canal in cytokinesis. (A and B) Localization of Mklp1 and mean intensity at the midbody center in BE cells in late midbodies. (C–E) Localization of phosphorylated Aurora B-Ser331 (pAurora B-Ser331) and mean intensity at the midbody center in BE cells. (F, M, and Q) Western blot analysis of total INCENP, V5, Chk2 and actin in BE cells expressing GFP:INCENP(FB) or V5-INCENP. (G and H) Specificity of the anti-phospho-Chk2-Thr383 (pChk2-Thr383) and phospho-Chk2-Thr68 (pChk2-Thr68) antibodies. (I) Localization of phosphorylated INCENP-Ser91 (pINCENP-Ser91). BE cells were treated with 10 µM etoposide for 4 h. Damaged DNA is evidenced by γ-H2AX-staining. (J and K) Specificity of the anti-phospho-Ser91 antiserum. Where indicated, the anti-pINCENP-Ser91 antiserum (Ab) was incubated with the phosphorylated Ser91 peptide (phospho-Ser91, pSer91) or with the unphosphorylated (Ser91) synthetic peptide. Tubulin values indicate midbody thickness. Insets show 1.6× magnification of the midbodies. (L) Mean pINCENP-Ser91 intensity at the midbody center in BE cells. Values in control were set to 1. (N and O) Phase-contrast live-cell microscopy analysis of BE cells expressing WT or Ser91A V5-INCENP. Intercellular canals are shown by solid arrows. Time is from formation of an intercellular canal to canal cleavage (dotted arrows). Values represent mean ± SD from n cells. (P) Frequency of bi/multinucleate or prometaphase BE cells. Values represent mean ± SD from three independent experiments (n > 90). ***, P < 0.001 (ANOVA and Student’s t test). S, serine. Scale bars, 5 µm.
Figure 3.
Figure 3.
Chk2 phosphorylates INCENP-Ser91 in late midbodies. (A) Localization of phospho-Chk2-Thr383 (pChk2-Thr383) or phospho-Chk2-Thr68 (pChk2-Thr68) in BE cells. (B) Immunoprecipitation (IP) of Chk2 and INCENP in cytokinesis-enriched BE cell extracts. (C–E) Chk2 in vitro kinase assays. Autoradiography (32P, top) and Western blot analysis (WB) or Ponceau staining (bottom) of the same gel. Asterisks, predicted molecular weights. (F) Alignment of INCENP protein sequences. Human Ser91 is boxed and marked by asterisk. (G–O) Localization and mean intensity of phosphorylated INCENP-Ser91 (pINCENP-Ser91) or V5-INCENP in asynchronous BE cells, or after treatment with 10 µM Chk2 inhibitor II (inhII) in cytokinesis (L and M). Values represent mean ± SD from n cells. Values in control were set to 1. ***, P < 0.001 (Student’s t test). Tubulin values indicate midbody thickness. Insets show 1.6× magnification of the midbodies. S, serine. Scale bars, 5 µm.
Figure 4.
Figure 4.
Expression of INCENP-Ser91A reduces the frequency of midbody stage cells and diminishes cell proliferation. (A–C) Localization and mean intensity of V5-INCENP at the midbody center in BE cells. Scale bars, 5 µm. (D) Frequency of midbody stage BE cells. Values represent mean ± SD from three independent experiments (n > 900). (E and F) Growth curves and phase-contrast images in BE cells expressing V5-INCENP plasmids. Values represent mean ± SD from three independent experiments (n = 6). Scale bars, 50 µm. (G) Immunoprecipitation (IP) of V5/His-INCENP and Mklp2 from cytokinesis-enriched BE cell extracts. (H) GST pull-down. Radiolabeled FL Mklp2 generated by in vitro transcription-translation was incubated with GST-INCENP or GST. Phosphorimager (35S, top) and Western blot analysis (WB; bottom) of the same gel. Asterisk indicates predicted molecular weight. (I and J) Localization and mean intensity of Mklp2 at the midbody center in BE cells. Values represent mean ± SD from n cells. Values in control were set to 1. ***, P < 0.001 (ANOVA and Student’s t test). Tubulin values indicate midbody thickness. Insets show 1.6× magnification of the midbodies. S, serine. Scale bars, 5 µm.
Figure S3.
Figure S3.
Mutation of Ser91 to alanine does not impair INCENP-association with CPC proteins. (A) Frequency of midbody stage cells. BE cells were released from a prometaphase block and treated with 10 µM Chk2 inhibitor II (inhII) in cytokinesis, or left untreated. Values represent mean ± SD from three independent experiments (n > 900). (B) Accumulation of dead BE cells with time as determined by trypan blue staining. Mean ± SD from three independent experiments (n = 6). (A and B) ***, P < 0.001 (ANOVA and Student’s t test). (C, D, G, and H) Localization of Mklp2 or Cep55 and mean intensity at the midbody or midbody center in BE cells. (E) GFP-Trap assay. BE cells were untransfected (untransf.) or transfected with GFP:INCENP. Precipitated (top) or total proteins (bottom) were analyzed by Western blotting. (F and L) Western blot analysis of total Cep55, ATM, actin and tubulin. (I) Total GFP and Mklp2 from Fig. 5 I. (J) Cartoon indicating the regions of human Mklp2 protein interacting with INCENP, Cep55 and myosin-II. Numbers show amino-acid residues. motor, kinesin motor domain. (K) Western blot analysis of total Mklp2 and actin in BE cells expressing GFP:Mklp2(ΔC90). (M) Specificity of the anti-phospho-ATM-Ser1981 (pATM-Ser1981) antibody. Tubulin values indicate midbody thickness. Insets show 1.6× magnification of the midbodies. (N and O) Phase-contrast live-cell microscopy analysis of HeLa tubulin:GFP cells treated with 10 µM KU-55933 in cytokinesis. Intercellular canals are shown by solid arrows. Time is from formation of an intercellular canal to canal cleavage (dotted arrows). Related to Video 5. Values represent mean ± SD from n cells. ***, P < 0.001 (Student’s t test). Scale bars, 5 µm. (P and Q) Frequency of prometaphase or bi/multinucleate BE cells. Values represent mean ± SD from three independent experiments (n > 900). ns, not statistically significant. S, serine.
Figure 5.
Figure 5.
GFP:INCENP binds to GST-Cep55 through Mklp2. (A) GFP-Trap kinase assay from BE cell extracts using histone H3 as substrate. GFP-associated histone H3-Ser10 phosphorylation (pH3-Ser10), immunoprecipitated Aurora B, and GFP were analyzed by Western blotting. Histone H3 was analyzed by Ponceau staining. 300 nM VX-680 was added to the kinase reaction to inhibit Aurora B catalytic activity. (B) Cep55:GFP colocalizes with INCENP at the midbody center in BE cells. (C–F) Localization and mean intensity of INCENP at the midbody or midbody center in BE cells. Mean ± SD from n cells. Values in control were set to 1. ***, P < 0.001 (Student’s t test). Tubulin values indicate midbody thickness. Insets show 1.6× magnification of the midbodies. Scale bars, 5 µm. (G) Immunoprecipitation from cytokinesis-enriched BE cell extracts. (H) Predicted experimental outcome. In the Western blot, the width of the lines indicates band signals intensity. (I and J) Cell lysates from BE cells were incubated with GST-Cep55 or GST. Associated proteins were detected by Western blotting. (K and N) Radiolabeled FL or truncated Mklp2 (ΔC90) was incubated with GST-Cep55 or GST. Phosphorimager (35S, top) and Western blot analysis (WB; bottom) of the same gel. Asterisks, predicted molecular weights. (L and M) GFP-Trap assay. Precipitated (L) or input proteins (M) were analyzed by Western blotting. S, serine.
Figure 6.
Figure 6.
ATM inhibition accelerates midbody disassembly. (A–C) Localization and mean intensity of INCENP at the midbody center in BE cells expressing FL or truncated (ΔC90) GFP:Mkp2. (D) Mechanism of INCENP-Aurora B localization to the midbody center. p, phosphorylation. (E) Phosphorylated ATM-Ser1981 (pATM-Ser1981) localizes to the midbody center in BE cells. (F and G) Time-lapse microscopy analysis of HeLa cells expressing tubulin:GFP. Cells were untreated (control) or treated with 10 µM KU-55933 immediately before filming. Midbodies are shown by solid arrows. Time from midbody formation to midbody disassembly (dotted arrows) is indicated. (H) Frequency of bi/multinucleate or midbody stage BE cells. Values represent mean ± SD from three independent experiments (n > 900). (I–N) Localization and mean intensity of phospho-Chk2-Thr68 (pChk2-Thr68), INCENP or Aurora B at the midbody center in BE cells. (O and P) Localization and mean intensity of pChk2-Thr68 after treatment of BE cells with 10 µM KU-55933 in cytokinesis. Values represent mean ± SD from n cells. Values in control were set to 1. Tubulin values indicate midbody thickness. Insets show 1.6× magnification of the midbodies. S, serine. ns, not statistically significant; ***, P < 0.001 (Student’s t test). Scale bars, 5 µm.
Figure 7.
Figure 7.
Aurora B depletion impairs ATM activation at late midbodies. (A and B) Localization and mean intensity of phosphorylated INCENP-Ser91 (pINCENP-Ser91) at the midbody center after treatment of BE cells with 10 µM KU-55933 in cytokinesis. (C) Frequency of midbody stage BE cells. Values represent mean ± SD from three independent experiments (n > 900). (D) Model for the role of ATM and Chk2 in abscission delay in normally segregating cells. Dashed arrow indicates feedback loop. p, phosphorylation. (E) Mre11 does not localize to late midbodies. As a positive control, Mre11 forms DNA foci after treatment of BE cells with 1 mM hydroxyurea (HU) for 4 h. (F, G, and J–M) Localization and mean intensity of phospho-ATM-Ser1981 (pATM-Ser1981), phospho-Chk2-Thr68 (pChk2-Thr68), or ATM at the midbody center in BE cells. Values represent mean ± SD, from n cells. Values in control were set to 1. ***, P < 0.001 (ANOVA and Student’s t test). Tubulin values indicate midbody thickness. Insets show 1.6× magnification of the midbodies. Scale bars, 5 µm. (H and I) Western blot analysis of total Mre11, actin, Aurora B (AurB), and tubulin. T, threonine.
Figure 8.
Figure 8.
Chk2 inhibition correlates with chromatin breakage in cytokinesis. (A) Telophase BE cells with chromatin bridges. (B) Frequency of cells with broken DNA bridges. BE cells were transfected and treated with 10 µM Chk2 inhibitor II (inhII), or 10 µM AZ3146 for 4 h. (C and D) Example of a chromatin bridge that is positive for γ-H2AX staining (open arrowhead) and frequency of γ-H2AX–positive chromatin bridges. Values represent mean ± SD from three independent experiments (n > 150). (E and F) Fluorescence (t = 0 min) and phase-contrast live-cell imaging of HeLa cells expressing LAP2b:RFP. Cells were untreated (control) or treated with 10 µM Chk2 inhibitor II immediately before filming. Time is from the detection of the intercellular canals containing LAP2b:RFP bridges. Intact intercellular canals are indicated by solid arrows, and broken canals are indicated by dotted arrows. Related to Video 6 and Video 7. (G) HeLa LAP2b:RFP cells exhibiting LAP2b:RFP bridges were analyzed by fluorescence microscopy of fixed samples. (H) Frequency of broken LAP2b:RFP bridges from G. (I) Percentage of broken DNA bridges in BE cells transfected with GFP or GFP:Vps4-K173Q. Values represent mean ± SD from three independent experiments (n > 150). (J–N) Localization and mean intensity of phosphorylated INCENP-Ser91 (pINCENP-Ser91) or total INCENP at the midbody in BE cells with chromatin bridges. Values represent mean ± SD from n cells. Values in control were set to 1. ***, P < 0.001 (ANOVA and Student’s t test). Broken chromatin or LAP2b:RFP bridges are indicated by dotted arrows. Insets show 1.6× magnification of the midbodies. S, serine. Scale bars, 5 µm.
Figure S4.
Figure S4.
Chk2 depletion correlates with breakage of LAP2b:RFP bridges in cytokinesis. (A–C) Fluorescence live-cell imaging of HeLa cells expressing LAP2b:RFP. Cells were untreated (control) or treated with 10 µM Chk2 inhibitor II (inhII) or 10 µM KU-55933 immediately before filming. Time is from the detection of the LAP2b:RFP bridges. Intact LAP2b:RFP bridges are indicated by solid arrows, and broken LAP2b:RFP bridges are indicated by dotted arrows. Related to Video 8 and Video 10. Mean ± SD from n cells. (D and E) BE cells transfected with GFP or GFP:Vps4-K173Q. (F and G) Actin patches (arrowheads) in BE cells in cytokinesis with chromatin bridges. Insets show magnification of the canals bases. (H) Relative actin-patch intensity values. Values represent mean ± SD from three independent experiments (n > 90). (I) Localization of INCENP. (J–N, Q, and R) Localization of Mklp2, V5-INCENP, or Rad50 and mean intensity at the midbody in BE cells, in cytokinesis with chromatin bridges. Insets show 1.6× magnification of the midbodies. Broken chromatin bridges are indicated by dotted arrows. Values represent mean ± SD from n cells. ***, P < 0.001 (ANOVA and Student’s t test). Scale bars, 5 µm. (O and P) Western blot analysis of total Rad50, Nbs1, and tubulin. S, serine.
Figure 9.
Figure 9.
Expression of INCENP-Ser91A correlates with chromatin bridge breakage in cytokinesis. (A, B, O, and P) Localization and mean intensity of Aurora B or phospho-Chk2-Thr68 (pChk2-Thr68) at the midbody in telophase BE cells with chromatin bridges. (C–F, I, and J) Localization and mean intensity of INCENP and Aurora B at the midbody in cells expressing GFP, siRNA-resistant GFP:Chk2R, or GFP:INCENP(FB). Values represent mean ± SD from n cells. Values in control were set to 1. Broken chromatin bridges are indicated by dotted arrows. (G, H, and K) Percentage of broken DNA bridges in BE cells. Values represent mean ± SD from three independent experiments (n > 150). ***, P < 0.001 (ANOVA and Student’s t test). (L–N) Localization of ATM, FLAG-ATM, or phosphorylated Chk2-Thr383 (pChk2-Thr383) in BE cells. Insets show 1.6× magnification of the midbodies. S, serine; T, threonine. Scale bars, 5 µm.
Figure 10.
Figure 10.
Depletion of MRN proteins correlates with chromatin breakage. (A–C, F–J, and L) Localization and mean intensity of INCENP, Mre11, phospho-ATM-Ser1981 (pATM-Ser1981) or V5-INCENP at the midbody in telophase BE cells with chromatin bridges. Cells were transfected or treated with 25 µM mirin for 4 h. Values represent mean ± SD from n cells. Values in control or WT control were set to 1. Broken chromatin bridges are indicated by dotted arrows. Insets show 1.6× magnification of the midbodies. Scale bars, 5 µm. (D and E) Fluorescence (t = 0 min) and phase-contrast live-cell imaging of HeLa cells expressing LAP2b:RFP. Cells were treated with 10 µM KU-55933 immediately before filming. Time is from the detection of the intercellular canals containing LAP2b:RFP bridges. Intact intercellular canals are indicated by solid arrows and broken canals are indicated by dotted arrows. Related to Video 9. (K and M) Frequency of broken chromatin bridges in BE cells in cytokinesis. Values represent mean ± SD from three independent experiments (n > 150). ***, P < 0.001 (ANOVA and Student’s t test). (N) Proposed mechanism by which the MRN–ATM–Chk2–INCENP pathway delays abscission in cytokinesis with chromatin bridges. AurB, Aurora B; p, phosphorylation; S, serine.
Figure S5.
Figure S5.
Expression of GFP:Nbs1 (ΔC20) reduces ATM localization to the midbody and induces chromatin bridge breakage in cytokinesis. (A–D and F–I) Localization of Nbs1, phospho-Aurora B-Ser331 (pAurora B-Ser331), ATM, or INCENP and mean intensity at the midbody in BE cells in cytokinesis with chromatin bridges. Values represent mean ± SD from n cells. (E) Western blot analysis of total Nbs1 and tubulin in BE cells expressing GFP:Nbs1 (ΔC20). (J) Frequency of BE cells with broken chromatin bridges. Values represent mean ± SD from three independent experiments (n > 150). ***, P < 0.001 (ANOVA and Student’s t test). (K) Treatment with mirin impairs ATM-Ser1981 phosphorylation (pATM-Ser1981) by etoposide. BE cells were treated with 10 µM etoposide in the absence or presence of 25 µM mirin for 4 h. (L–P) Localization of WT, Ser91A or Ser91D V5-INCENP in BE cells. Insets show 1.6× magnification of the midbodies. Broken chromatin bridges are indicated by dotted arrows. Scale bars, 5 µm.

Comment in

Similar articles

Cited by

References

    1. Abrieu, A., Magnaghi-Jaulin L., Kahana J.A., Peter M., Castro A., Vigneron S., Lorca T., Cleveland D.W., and Labbé J.C.. 2001. Mps1 is a kinetochore-associated kinase essential for the vertebrate mitotic checkpoint. Cell. 106:83–93. 10.1016/S0092-8674(01)00410-X - DOI - PubMed
    1. Adriaans, I.E., Hooikaas P.J., Aher A., Vromans M.J.M., van Es R.M., Grigoriev I., Akhmanova A., and Lens S.M.A.. 2020. MKLP2 Is a Motile Kinesin that Transports the Chromosomal Passenger Complex during Anaphase. Curr. Biol. 30:2628–2637.e9. 10.1016/j.cub.2020.04.081 - DOI - PubMed
    1. Ahn, J.Y., Schwarz J.K., Piwnica-Worms H., and Canman C.E.. 2000. Threonine 68 phosphorylation by ataxia telangiectasia mutated is required for efficient activation of Chk2 in response to ionizing radiation. Cancer Res. 60:5934–5936. - PubMed
    1. Ahn, J.Y., Li X., Davis H.L., and Canman C.E.. 2002. Phosphorylation of threonine 68 promotes oligomerization and autophosphorylation of the Chk2 protein kinase via the forkhead-associated domain. J. Biol. Chem. 277:19389–19395. 10.1074/jbc.M200822200 - DOI - PubMed
    1. Antoni, L., Sodha N., Collins I., and Garrett M.D.. 2007. CHK2 kinase: cancer susceptibility and cancer therapy - two sides of the same coin? Nat. Rev. Cancer. 7:925–936. 10.1038/nrc2251 - DOI - PubMed

Publication types

MeSH terms