. 2021 Jan 7;13(1):evaa264.
doi: 10.1093/gbe/evaa264.

At the Root of T2R Gene Evolution: Recognition Profiles of Coelacanth and Zebrafish Bitter Receptors

Affiliations

At the Root of T2R Gene Evolution: Recognition Profiles of Coelacanth and Zebrafish Bitter Receptors

Maik Behrens et al. Genome Biol Evol. .

Abstract

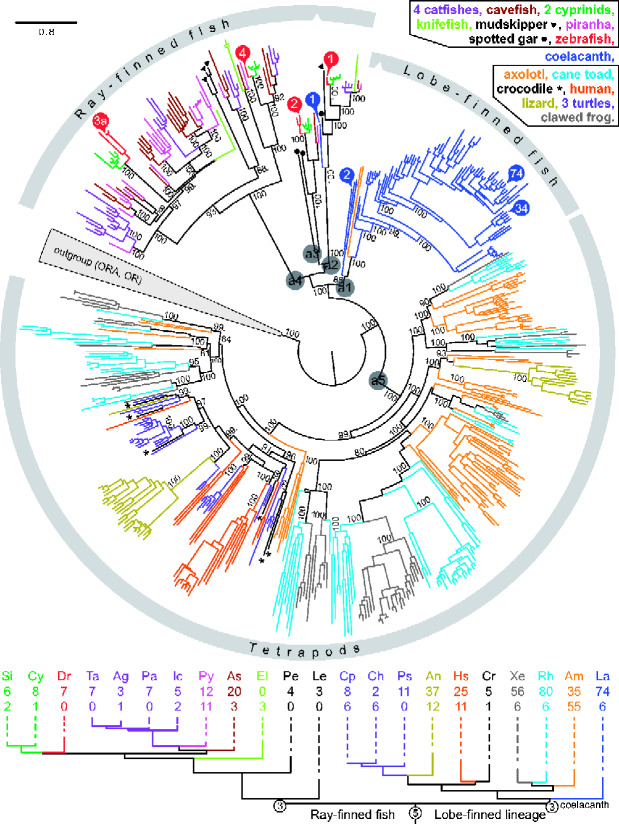
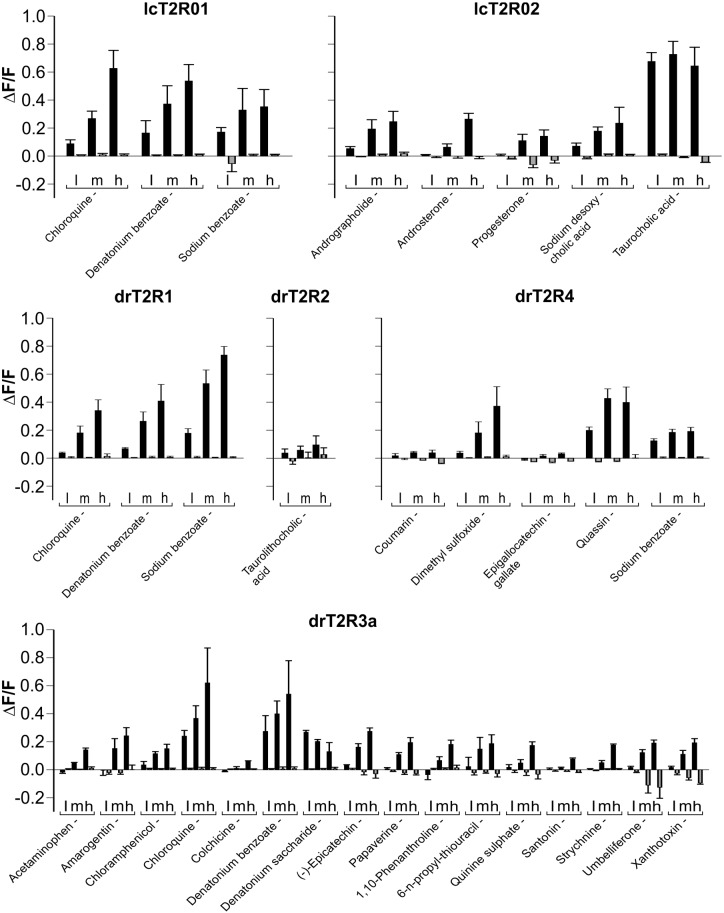
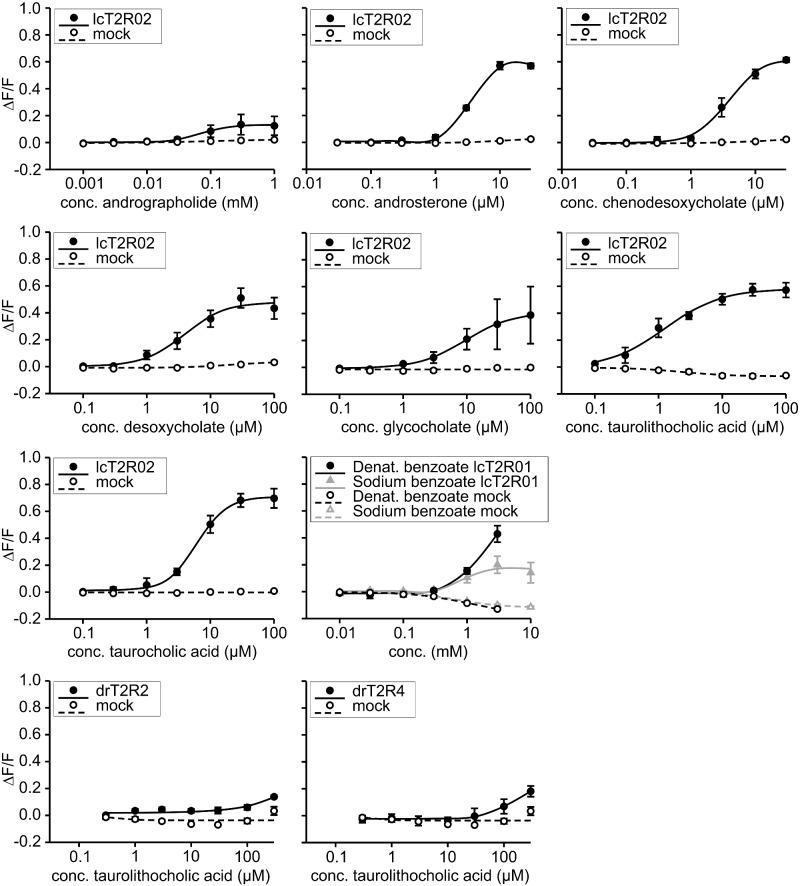
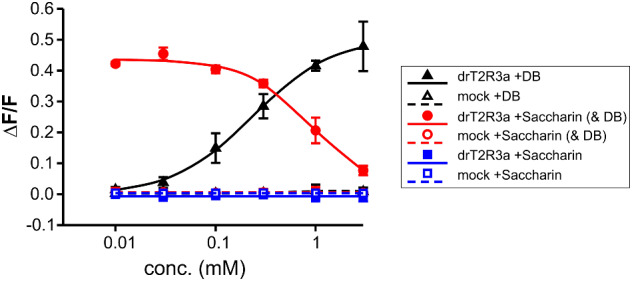
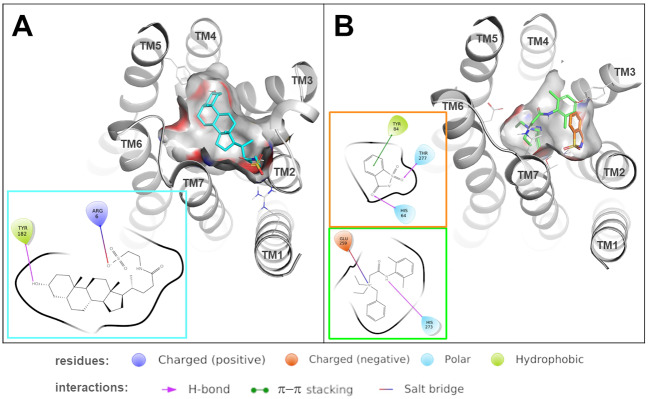
The careful evaluation of food is important for survival throughout the animal kingdom, and specialized chemoreceptors have evolved to recognize nutrients, minerals, acids, and many toxins. Vertebrate bitter taste, mediated by the taste receptor type 2 (T2R) family, warns against potentially toxic compounds. During evolution T2R receptors appear first in bony fish, but the functional properties of bony fish T2R receptors are mostly unknown. We performed a phylogenetic analysis showing the "living fossil" coelacanth (Latimeria chalumnae) and zebrafish (Danio rerio) to possess T2R repertoires typical for early-diverged species in the lobe-finned and the ray-finned clade, respectively. Receptors from these two species were selected for heterologous expression assays using a diverse panel of bitter substances. Remarkably, the ligand profile of the most basal coelacanth receptor, T2R01, is identical to that of its ortholog in zebrafish, consistent with functional conservation across >400 Myr of separate evolution. The second coelacanth receptor deorphaned, T2R02, is activated by steroid hormones and bile acids, evolutionary old molecules that are potentially endogenously synthesized agonists for extraoral T2Rs. For zebrafish, we report the presence of both specialized and promiscuous T2R receptors. Moreover, we identified an antagonist for one of the zebrafish receptors suggesting that bitter antagonism contributed to shape this receptor family throughout evolution.

Keywords: bitter taste receptor; bony fish; calcium mobilization assay.


Figures

Fig. 1
Fig. 1
Phylogenetic tree visualizing vertebrate T2R evolution. Top panel, complete T2R repertoires from 22 species are shown color coded as indicated. Some colors refer to closely related species as shown. The tree was generated using a maximum-likelihood method, for details see Materials and Methods. Note the high branch support (shown as %) even in basal nodes. Most gene birth events occur late as visualized by a small degree of color mixing within the tree. Note the axolotl gene pair within the large coelacanth clade. Ancestral genes discussed in the main text are indicated by a1–a5. T2Rs selected for deorphanization are indicated by numbers in colored circles, red circles for zebrafish genes, blue for coelacanth, with numbers referring to the gene name, for example number 34 represents T2R34. The evolutionary relationships of the 22 species investigated are approximated in the bottom panel by a phylogenetic tree constructed with the respective species opsin orthologs, for details see Materials and Methods. Species color code same as above. Species are indicated by two letter abbreviations; Dr, Danio rerio, zebrafish; La, Latimeria chalumnae, coelacanth; for other names see supplementary figure S1, Supplementary Material online. The number of putatively functional T2Rs is given below the species acronym, second row of numbers refers to pseudogenes. Circled numbers refer to estimates for the number of ancestral genes.
Fig. 2
Fig. 2
Activation profiles of coelacanth and zebrafish bitter taste receptors. The cDNA constructs of the bitter taste receptors of coelacanth (lcT2R#) and zebrafish (drT2R#) were transiently transfected into HEK 293T-Gα16gust44 cells and subsequently subjected to calcium mobilization assays using an automated fluorometric imaging plate reader (FLIPRtetra). Bitter substances that were considered as potential activators during the first round of screening were applied in three different concentrations (low [l], medium [m], high [h]; the high concentration corresponds to the maximal concentration given in supplementary table S1, Supplementary Material online, medium and low concentrations represent each 3-fold dilution steps of test compounds) to the corresponding receptor transfected cells and the changes in fluorescence (y axis, ΔF/F) were monitored (means ± SD, n = 4). Only compound-receptor pairs resulting in statistically significant (Student’s t-test, P ≤ 0.05) fluorescence changes in transfected cells with at least one of the tested concentrations were judged positive. The receptors and the corresponding identified agonists are indicated.
Fig. 3
Fig. 3
Dose–response curves of selected agonist-receptor pairs. The cDNA constructs of the bitter taste receptors of coelacanth (lcT2R#) and zebrafish (drT2R#) were transiently transfected into HEK 293T-Gα16gust44 cells and subsequently subjected to calcium mobilization assays using an automated fluorometric imaging plate reader (FLIPRtetra). Cells transfected with an empty expression vector served as negative controls (mock). The relative changes in fluorescence (ΔF/F) are plotted on the y axis (means ± SD, n = 4), the applied compound concentrations on the logarithmically scaled x axis.
Fig. 4
Fig. 4
Inhibition of denatonium responses of drT2R3a by saccharin. The cDNA of the bitter taste receptor drT2R3a was transiently transfected into HEK 293T-Gα16gust44 cells and subsequently subjected to calcium mobilization assays using an automated fluorometric imaging plate reader (FLIPRtetra). Cells transfected with an empty expression vector served as negative controls (mock). The responses of drT2R3a to denatonium benzoate (DB, black curves), saccharin (blue curves), and 1 mM denatonium benzoate and increasing saccharin concentrations (red curves) are shown. The relative changes in fluorescence (ΔF/F) are plotted on the y axis (means ± SD, n = 4), the applied compound concentrations on the logarithmically scaled x axis.
Fig. 5
Fig. 5
Predicted binding modes of ligands in lcT2R01 and drT2R3a. Predicted binding modes of taurolithocholic acid (colored in cyan) into lcT2R02 (A) and of denatonium (colored in green) and saccharine (colored in orange) into drT2R3a (B). 3D representations show how the ligand is accommodated in the binding site, ligand–receptor interactions (including π–π stacking interactions, salt bridges and hydrogen bonds) are detailed in the 2D diagrams.

Similar articles

Cited by

References

    1. Adler E, et al.2000. A novel family of mammalian taste receptors. Cell 100(6):693–702. - PubMed
    1. Altschul SF, et al.1997. Gapped BLAST and PSI-BLAST: a new generation of protein database search programs. Nucleic Acids Res. 25(17):3389–3402. - PMC - PubMed
    1. Ammon C, Schafer J, Kreuzer OJ, Meyerhof W.. 2002. Presence of a plasma membrane targeting sequence in the amino-terminal region of the rat somatostatin receptor 3. Arch Physiol Biochem. 110(1–2):137–145. - PubMed
    1. Ballesteros J, Weinstein H.. 1995. Integrated methods for the construction of three-dimensional models of structure-function relations in G protein-coupled receptors. Methods Neurosci. 25:366–428.
    1. Behrens M, Blank K, Meyerhof W.. 2017. Blends of non-caloric sweeteners saccharin and cyclamate show reduced off-taste due to TAS2R bitter receptor inhibition. Cell Chem Biol. 24(10):1199–1204 e1192. - PubMed

LinkOut - more resources