. 2021 May 3;60(19):10661-10669.
doi: 10.1002/anie.202014174. Epub 2021 Mar 24.

Division and Regrowth of Phase-Separated Giant Unilamellar Vesicles*

Affiliations

Division and Regrowth of Phase-Separated Giant Unilamellar Vesicles*

Yannik Dreher et al. Angew Chem Int Ed Engl. .

Abstract

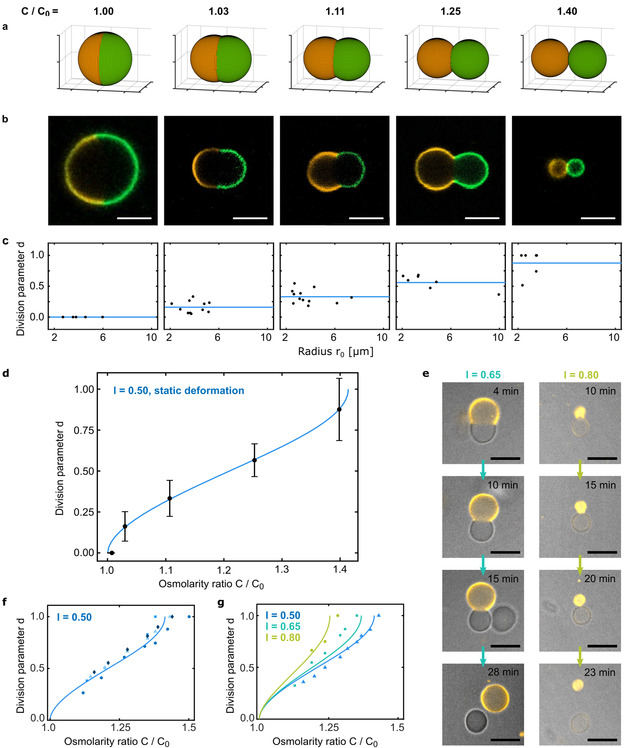
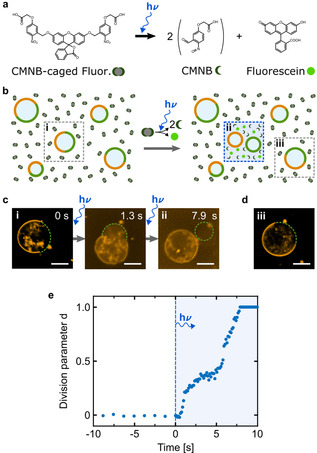
Success in the bottom-up assembly of synthetic cells will depend on strategies for the division of protocellular compartments. Here, we describe the controlled division of phase-separated giant unilamellar lipid vesicles (GUVs). We derive an analytical model based on the vesicle geometry, which makes four quantitative predictions that we verify experimentally. We find that the osmolarity ratio required for division is 2 , independent of the GUV size, while asymmetric division happens at lower osmolarity ratios. Remarkably, we show that a suitable osmolarity change can be triggered by water evaporation, enzymatic decomposition of sucrose or light-triggered uncaging of CMNB-fluorescein. The latter provides full spatiotemporal control, such that a target GUV undergoes division whereas the surrounding GUVs remain unaffected. Finally, we grow phase-separated vesicles from single-phased vesicles by targeted fusion of the opposite lipid type with programmable DNA tags to enable subsequent division cycles.

Keywords: DNA structures; GUV division; osmosis; synthetic biology; vesicles.


Conflict of interest statement

The authors declare no conflict of interest.

Figures

Figure 1
Figure 1
Division of phase‐separated GUVs. Schematic illustration of the division mechanism relying on a) phase separation of the GUVs and b) osmosis. C0, C1, and C2 denote the osmolarity outside of the GUVs and V1, V2, and V3 describe their volume at different time points. c) Chemical reaction pathway of sucrose degradation catalyzed by the enzyme invertase. d) Osmolarity ratio C/C 0 over time for GUV‐containing solutions composed of 300 mm sucrose, 10 mm HEPES (pH 7.4) and 44 mg L−1 (blue) or 22 mg L−1 invertase (gray). Error bars are too small to be visible. The data was fitted with limited growth fits (solid lines). The dotted black line indicates the time point at which division occurs (see f). e) Overlay of brightfield and confocal image of a phase‐separated GUV with equally large hemispheres (Lipid Mix 1, Table S2, ld phase labeled with LissRhod PE (orange), λ ex=561 nm). f) Confocal fluorescence time series depicting the division process in the presence of 44 mg L−1 invertase. The vesicles are fully separated and quickly diffuse apart after division (see 45 min time point). Scale bars: 10 μm.
Figure 2
Figure 2
Theoretical predictions for the division process of phase‐separated GUVs based on an increase in the osmolarity ratio. a) Schematic illustration describing the relevant geometrical properties of a deformed GUV (top) and its initially spherical state (bottom). Ald and A lo are the surface areas of the spherical caps representing the two phases. s 0 is the radius of the base of the caps, V 0 the volume and r 0 the radius of the initially spherical GUV. s is the reduced radius of the base of the caps and V the reduced volume of the deformed GUV. b) Theoretical prediction of the division parameter d as a function of the osmolarity ratio C/C 0 for different lipid ratios l. d=0 corresponds to a spherical GUV, d=1 to a fully divided one. c) Predicted shapes of GUVs with different lipid ratios (l=0.80, 0.65, 0.50) at defined points during the division process (d=0.0, 0.5, 1.0). The corresponding positions (1–9) are indicated in the plot in (b).
Figure 3
Figure 3
Quantitative comparison of experiment and theoretical prediction. a) Theoretically predicted shapes of symmetric GUVs at different osmolarity ratios C/C 0 as indicated. b) Representative confocal fluorescence images of symmetric phase‐separated GUVs immersed in solutions of the corresponding osmolarity ratios C/C 0. The ld phase is labeled with LissRhod PE (orange, λ ex=561 nm), the lo phase with 6‐FAM‐labeled cholesterol‐tagged DNA (green, λ ex=488 nm). Scale bars: 10 μm. c) Scatter plots of the experimentally determined division parameters plotted against the radius of the initially spherical GUVs. Solid blue lines represent the theoretical prediction, which postulates size‐independence of the division process. d) Division parameter d as a function of osmolarity ratio C/C 0. The mean values of the measured division parameters (black) and the theoretical prediction from Equation (2) (solid blue line) are plotted. Error bars correspond to the standard deviation of the values for d extracted from confocal fluorescence images. e) Confocal fluorescence time series of GUVs with asymmetric lipid ratios (l=0.65 and l=0.80) in the presence of 44 mg L−1 invertase. Scale bars: 10 μm. f) Division parameter d of four different symmetric GUVs (l=0.5) in the presence of 44 mg L−1 invertase plotted against the osmolarity ratio C/C 0. The values for C/C 0 were obtained from the osmolarity measurements displayed in Figure 1 d. The solid blue line shows the theoretically predicted division curve. g) Division parameter d of GUVs with different lipid ratios in the presence of invertase plotted against the osmolarity ratio C/C 0. Solid lines are the theoretically predicted division curves for the corresponding lipid ratios.
Figure 4
Figure 4
Light‐triggered local division of phase‐separated GUVs via uncaging of CMNB‐fluorescein. a) Chemical reaction pathway of fluorescein release induced by UV or 405 nm illumination. CMNB‐caged fluorescein decomposes into three products thus tripling its contribution to the osmolarity. b) Schematic illustration of the localized light‐triggered division process. Phase‐separated GUVs are immersed in a solution containing CMNB‐fluorescein. Illumination with a 405 nm laser diode leads to a local increase in osmolarity by uncaging of CMNB‐fluorescein and hence to GUV division. c) Representative confocal fluorescence images of a phase‐separated GUV (ld phase labeled with LissRhod PE, λ ex=561 nm) undergoing full division within seven seconds of 405 nm illumination (time points i and ii are illustrated in b). d) Confocal fluorescence image of a phase‐separated GUV outside the illuminated area maintains its spherical shape (iii as illustrated in b). Scale bars: 10 μm. e) Division parameter d of the GUV shown in (c) over time. The GUV instantly deforms with start of 405 nm illumination (indicated by the vertical blue dashed line) and fully divides within seconds.
Figure 5
Figure 5
Regrowth of phase‐separated vesicles. a) Schematic illustration of a programmable vesicle growth and division cycle mediated via fusogenic membrane‐bound DNA. The zoom image shows the zipper‐like arrangement of the DNA, bringing the membranes into close proximity. b) Representative confocal fluorescence image of a fluorescently labeled ld‐phase GUV (orange, λ ex=561 nm) in a feeding bath of lo SUVs functionalized with cholesterol‐tagged 6‐FAM‐labeled DNA (green, λ ex=488 nm). c) Addition of complementary tocopherol‐tagged DNA leads to SUV fusion and hence the formation of phase‐separated vesicles (as identified via partitioning of cholesterol‐tagged 6‐FAM DNA in presence of unlabeled SUVs). Scale bars: 10 μm. d) Confocal fluorescence overview image (left, scale bar: 50 μm) after the DNA‐mediated fusion process. Fusion took place for the majority of GUVs (highlighted with white boxes). Zoom images (right, scale bars: 10 μm) show the successful regeneration of phase‐separated GUVs with a lipid ratio of l≈0.5.

References

    1. Raspail F. V., Ann. Sci. Nat. 1825, 224, 384–427.
    1. Virchow R., Die Cellularpathologie in ihrer Begründung und in ihrer Auswirkung auf die physiologische und pathologische Gewebelehr e, Verlag A. Hirschwald, Berlin, 1858.
    1. Schwille P., Science 2011, 333, 1252–1254. - PubMed
    1. Göpfrich K., Platzman I., Spatz J. P., Trends Biotechnol. 2018, 36, 938–951. - PMC - PubMed
    1. Schwille P., Emerging Top. Life Sci. 2019, 3, 551–558. - PubMed

Publication types