Oral Microbiota Composition Predicts Early Childhood Caries Onset
- PMID: 33356775
- PMCID: PMC8142088
- DOI: 10.1177/0022034520979926
Oral Microbiota Composition Predicts Early Childhood Caries Onset
Abstract
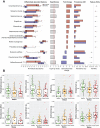
As the most common chronic disease in preschool children in the United States, early childhood caries (ECC) has a profound impact on a child's quality of life, represents a tremendous human and economic burden to society, and disproportionately affects those living in poverty. Caries risk assessment (CRA) is a critical component of ECC management, yet the accuracy, consistency, reproducibility, and longitudinal validation of the available risk assessment techniques are lacking. Molecular and microbial biomarkers represent a potential source for accurate and reliable dental caries risk and onset. Next-generation nucleotide-sequencing technology has made it feasible to profile the composition of the oral microbiota. In the present study, 16S ribosomal RNA (rRNA) gene sequencing was applied to saliva samples that were collected at 6-mo intervals for 24 mo from a subset of 56 initially caries-free children from an ongoing cohort of 189 children, aged 1 to 3 y, over the 2-y study period; 36 children developed ECC and 20 remained caries free. Analyses from machine learning models of microbiota composition, across the study period, distinguished between affected and nonaffected groups at the time of their initial study visits with an area under the receiver operating characteristic curve (AUC) of 0.71 and discriminated ECC-converted from healthy controls at the visit immediately preceding ECC diagnosis with an AUC of 0.89, as assessed by nested cross-validation. Rothia mucilaginosa, Streptococcus sp., and Veillonella parvula were selected as important discriminatory features in all models and represent biomarkers of risk for ECC onset. These findings indicate that oral microbiota as profiled by high-throughput 16S rRNA gene sequencing is predictive of ECC onset.
Keywords: 16S rRNA; biomarkers; dental caries; machine learning; receiver operating characteristic curve; risk assessment.
Conflict of interest statement
Figures


Similar articles
-
Sex-Based Diverse Plaque Microbiota in Children with Severe Caries.J Dent Res. 2020 Jun;99(6):703-712. doi: 10.1177/0022034520908595. Epub 2020 Feb 28. J Dent Res. 2020. PMID: 32109360
-
Multimodal Data Integration Reveals Mode of Delivery and Snack Consumption Outrank Salivary Microbiome in Association With Caries Outcome in Thai Children.Front Cell Infect Microbiol. 2022 May 23;12:881899. doi: 10.3389/fcimb.2022.881899. eCollection 2022. Front Cell Infect Microbiol. 2022. PMID: 35677657 Free PMC article.
-
Oral microbiome characteristics in children with and without early childhood caries.J Clin Pediatr Dent. 2023 Mar;47(2):58-67. doi: 10.22514/jocpd.2023.012. Epub 2023 Mar 3. J Clin Pediatr Dent. 2023. PMID: 36890743
-
Understanding the Predictive Potential of the Oral Microbiome in the Development and Progression of Early Childhood Caries.Curr Pediatr Rev. 2023;19(2):121-138. doi: 10.2174/1573396318666220811124848. Curr Pediatr Rev. 2023. PMID: 35959611 Review.
-
Salivary proteins and microbiota as biomarkers for early childhood caries risk assessment.Int J Oral Sci. 2017 Nov 10;9(11):e1. doi: 10.1038/ijos.2017.35. Int J Oral Sci. 2017. PMID: 29125139 Free PMC article. Review.
Cited by
-
Streptococcus Mutans Membrane Vesicles Enhance Candida albicans Pathogenicity and Carbohydrate Metabolism.Front Cell Infect Microbiol. 2022 Jul 26;12:940602. doi: 10.3389/fcimb.2022.940602. eCollection 2022. Front Cell Infect Microbiol. 2022. PMID: 35959374 Free PMC article.
-
Machine Learning Approach Identified Multi-Platform Factors for Caries Prediction in Child-Mother Dyads.Front Cell Infect Microbiol. 2021 Aug 19;11:727630. doi: 10.3389/fcimb.2021.727630. eCollection 2021. Front Cell Infect Microbiol. 2021. PMID: 34490147 Free PMC article.
-
Exploring the efficacy of in-vitro low-temperature plasma treatment on single and multispecies dental cariogenic biofilms.Sci Rep. 2024 Sep 5;14(1):20678. doi: 10.1038/s41598-024-70943-0. Sci Rep. 2024. PMID: 39237570 Free PMC article.
-
Impact of Refined and Unrefined Sugar and Starch on the Microbiota in Dental Biofilm.J Int Soc Prev Community Dent. 2022 Oct 31;12(5):554-563. doi: 10.4103/jispcd.JISPCD_104_22. eCollection 2022 Sep-Oct. J Int Soc Prev Community Dent. 2022. PMID: 36532326 Free PMC article.
-
Correlation between caries activity and salivary microbiota in preschool children.Front Cell Infect Microbiol. 2023 Apr 11;13:1141474. doi: 10.3389/fcimb.2023.1141474. eCollection 2023. Front Cell Infect Microbiol. 2023. PMID: 37113131 Free PMC article.
References
-
- Allen DM. 1974. The relationship between variable selection and data augmentation and a method for prediction. Technometrics. 16(1):125–127.
-
- Casamassimo PS, Thikkurissy S, Edelstein BL, Maiorini E. 2009. Beyond the dmft: the human and economic cost of early childhood caries. J Am Dent Assoc. 140(6):650–657. - PubMed
Publication types
MeSH terms
Substances
Supplementary concepts
Grants and funding
LinkOut - more resources
Full Text Sources
Medical
Research Materials

