. 2021 Feb 1;320(2):E379-E389.
doi: 10.1152/ajpendo.00399.2020. Epub 2020 Dec 28.

LRP1 regulates food intake and energy balance in GABAergic neurons independently of leptin action

Affiliations

LRP1 regulates food intake and energy balance in GABAergic neurons independently of leptin action

Min-Cheol Kang et al. Am J Physiol Endocrinol Metab. .

Abstract

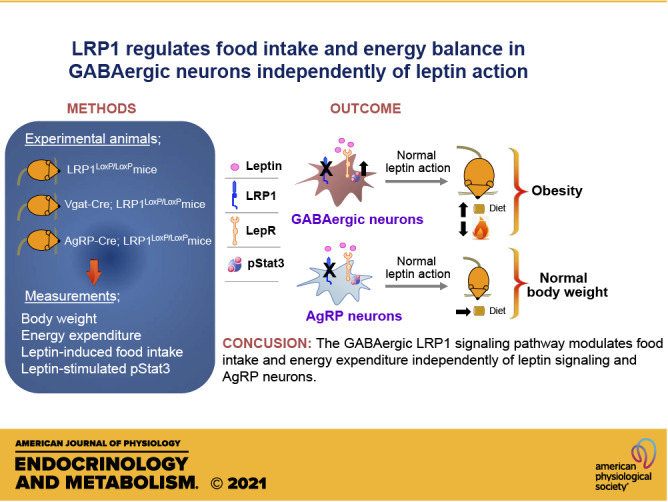
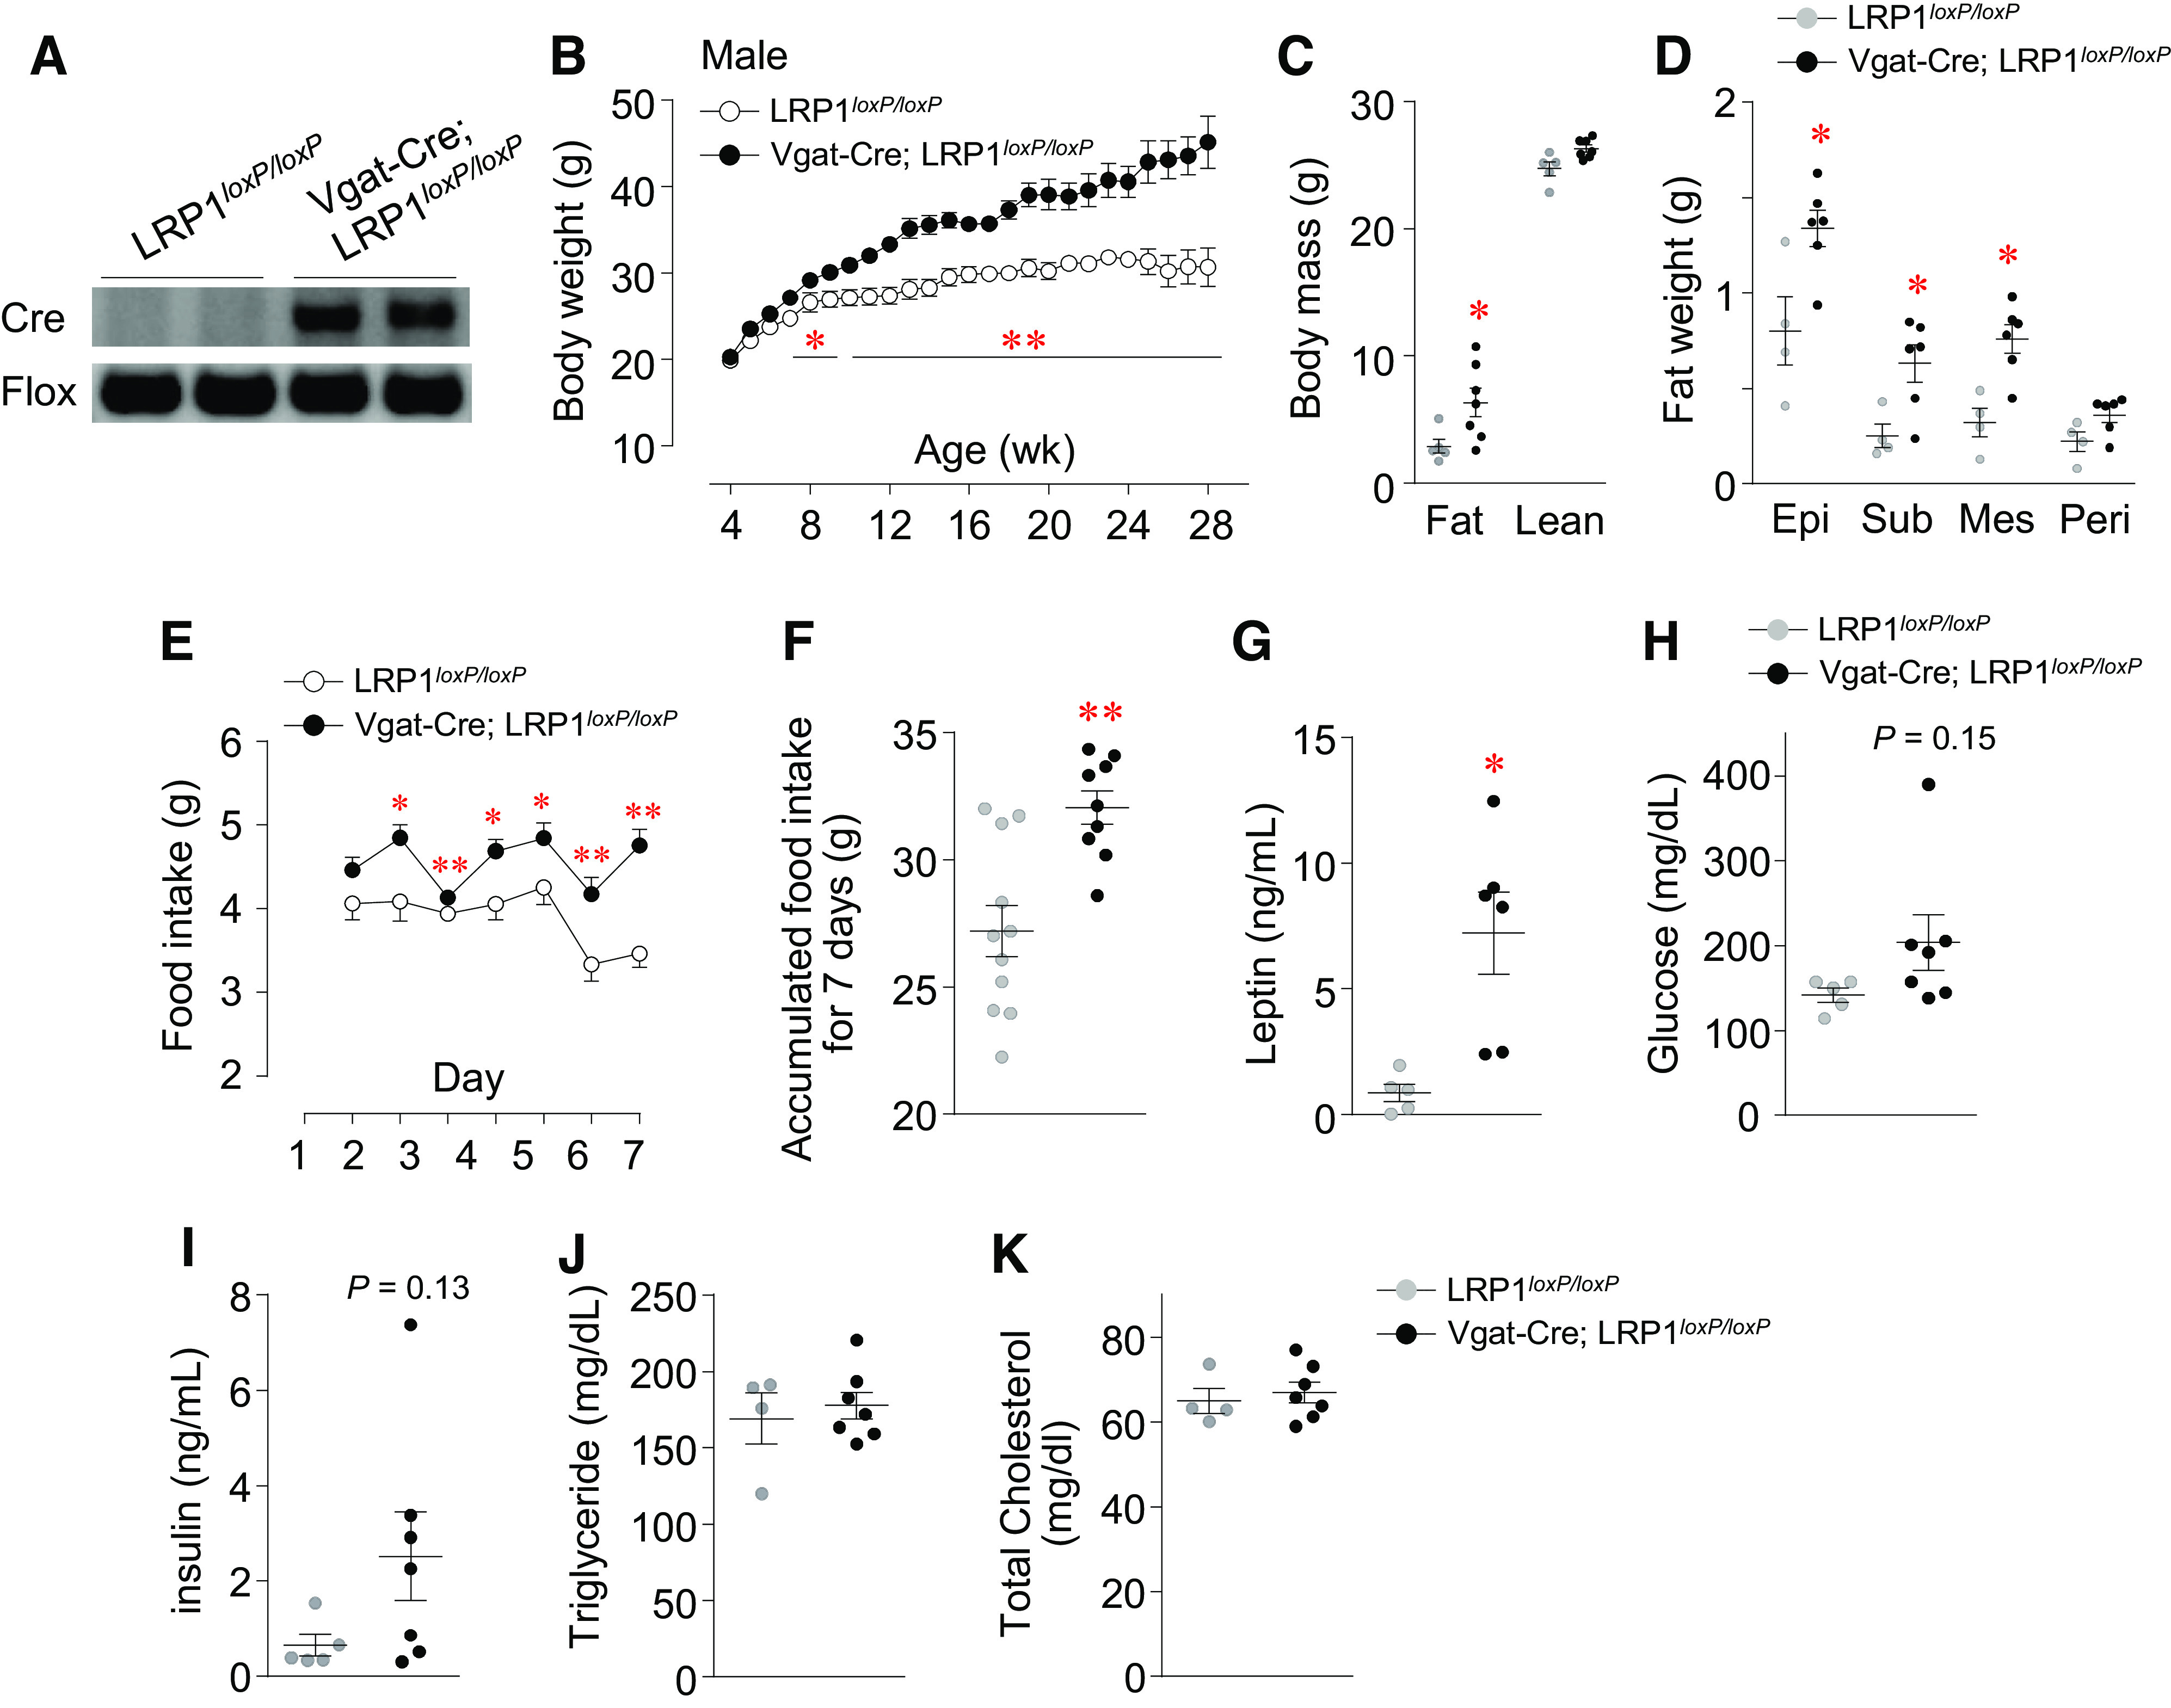
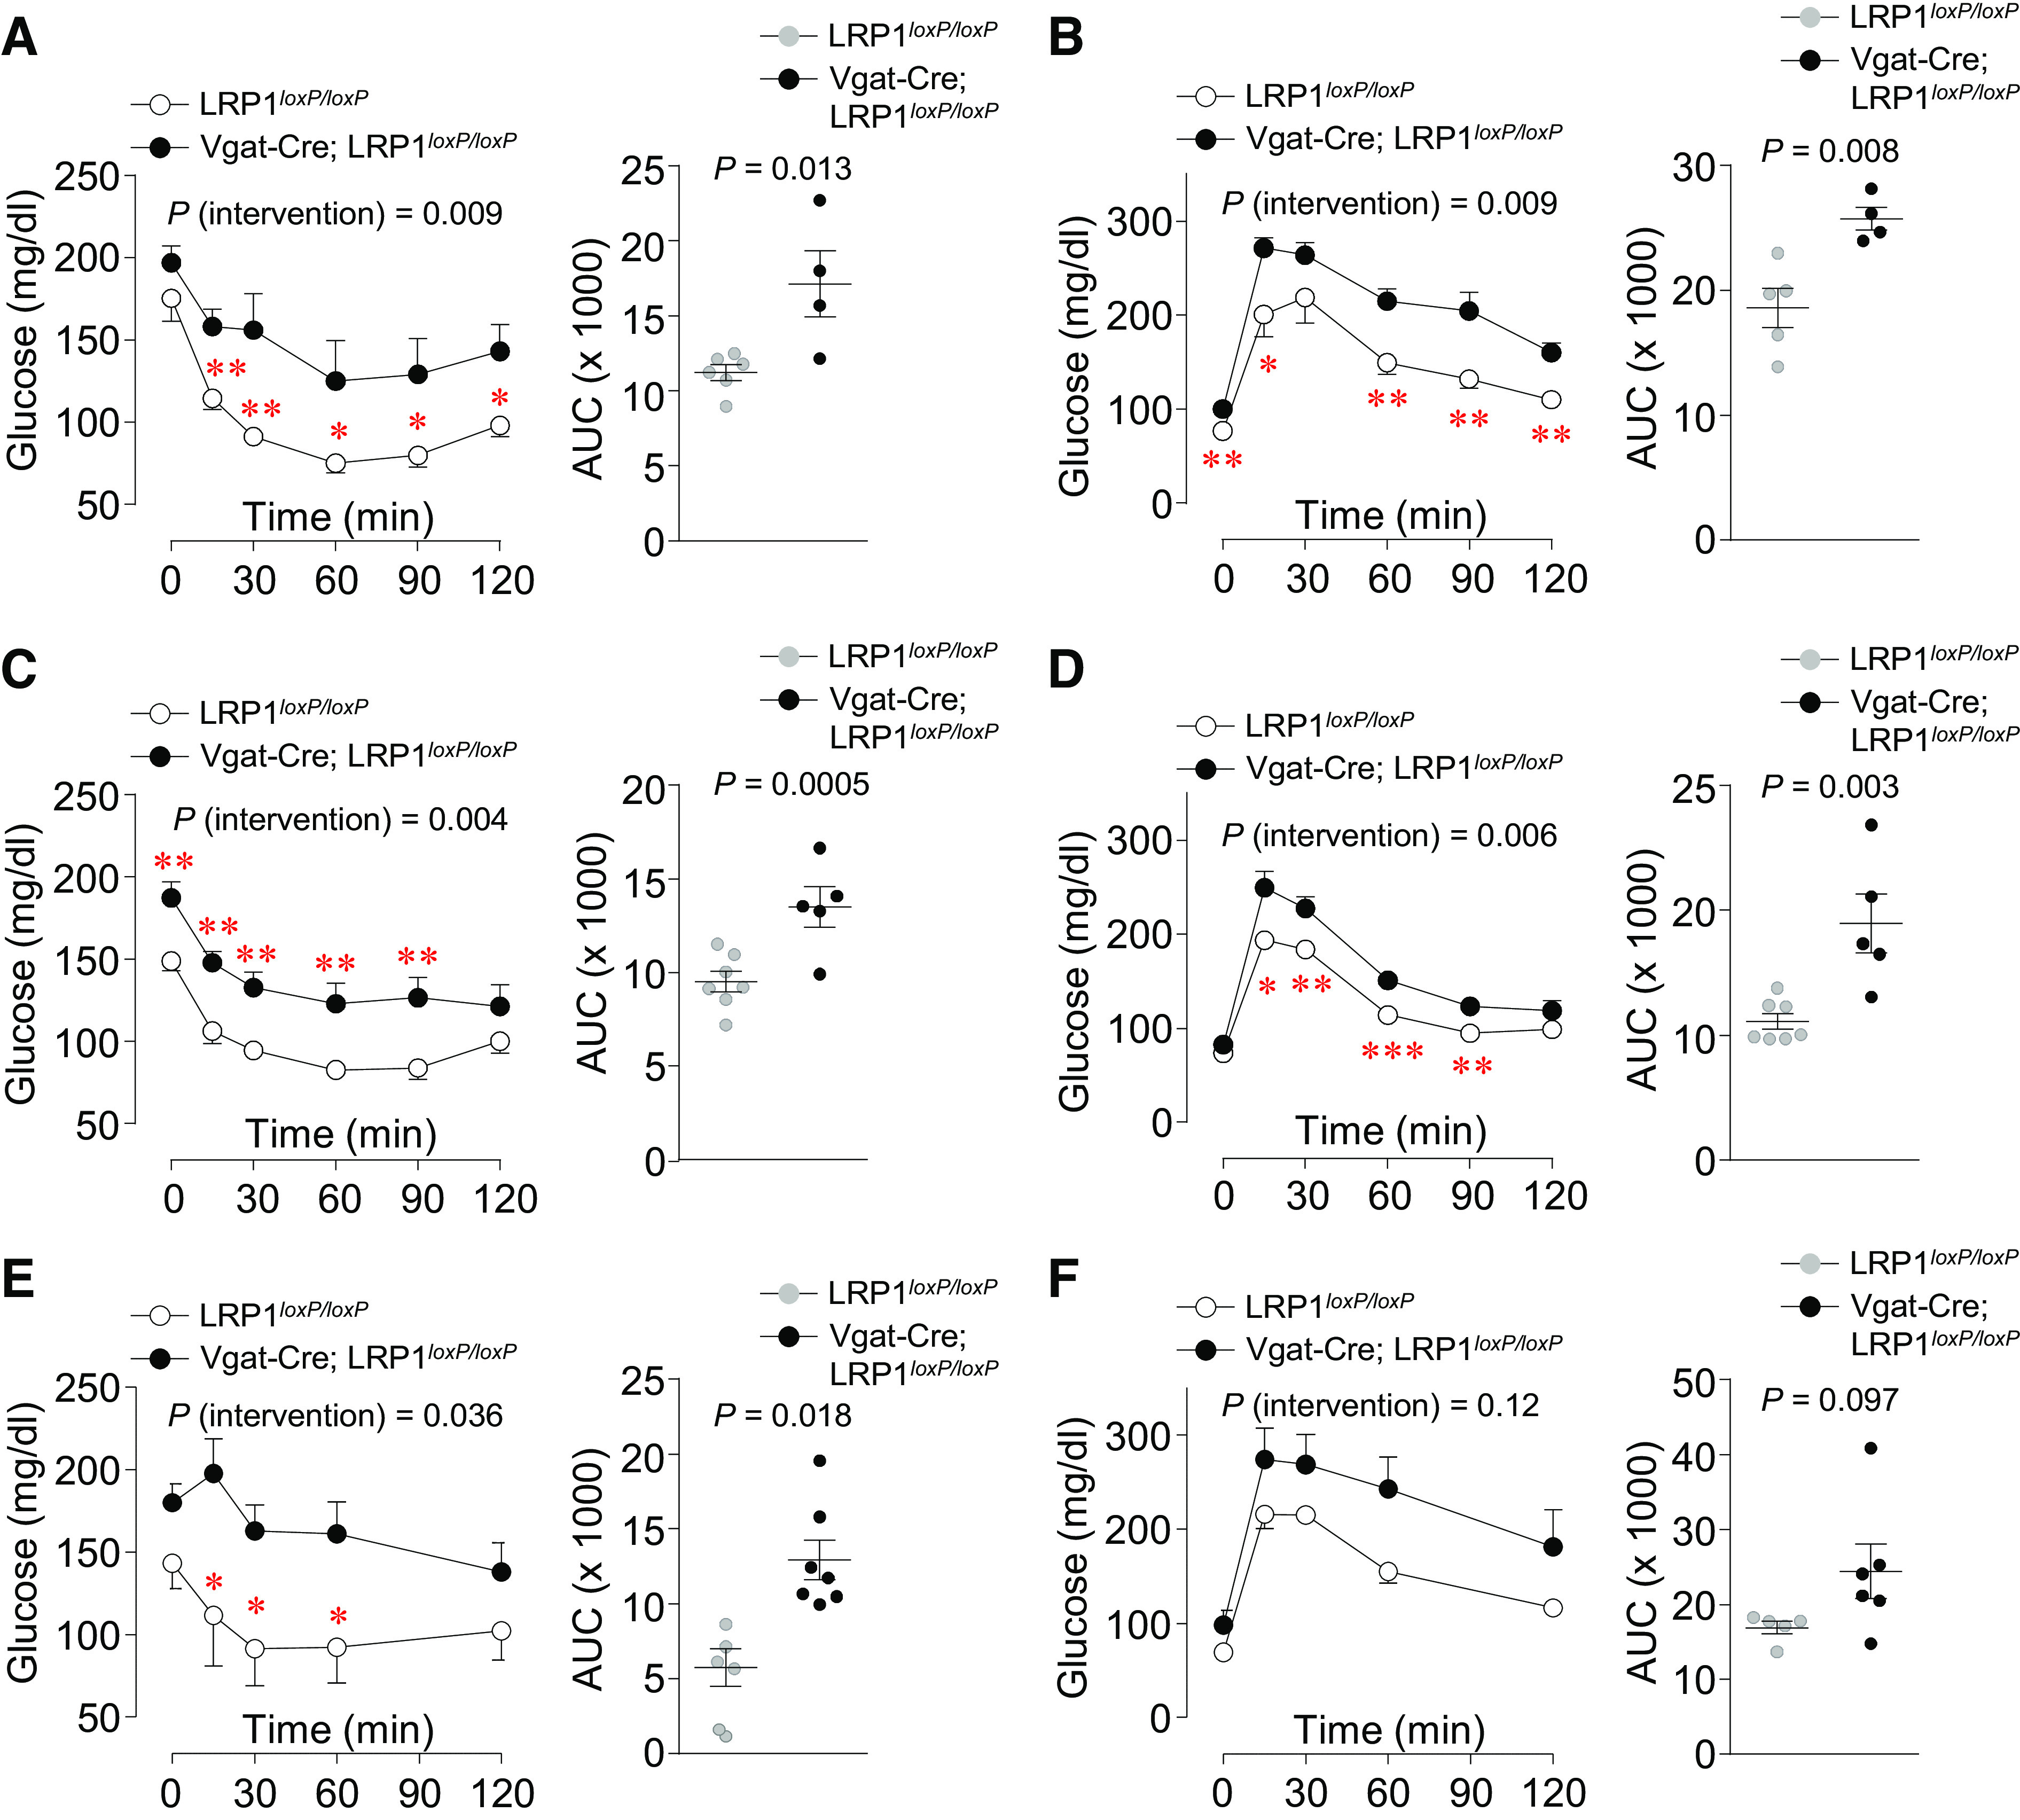
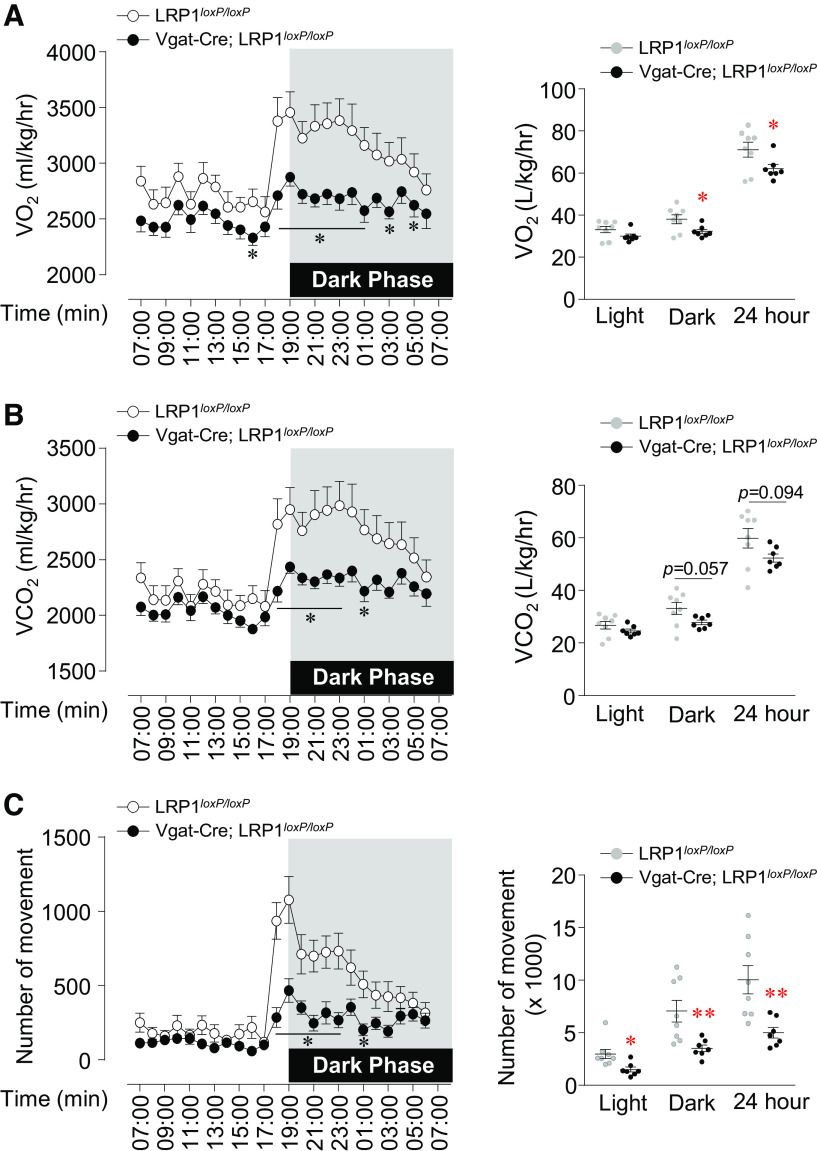
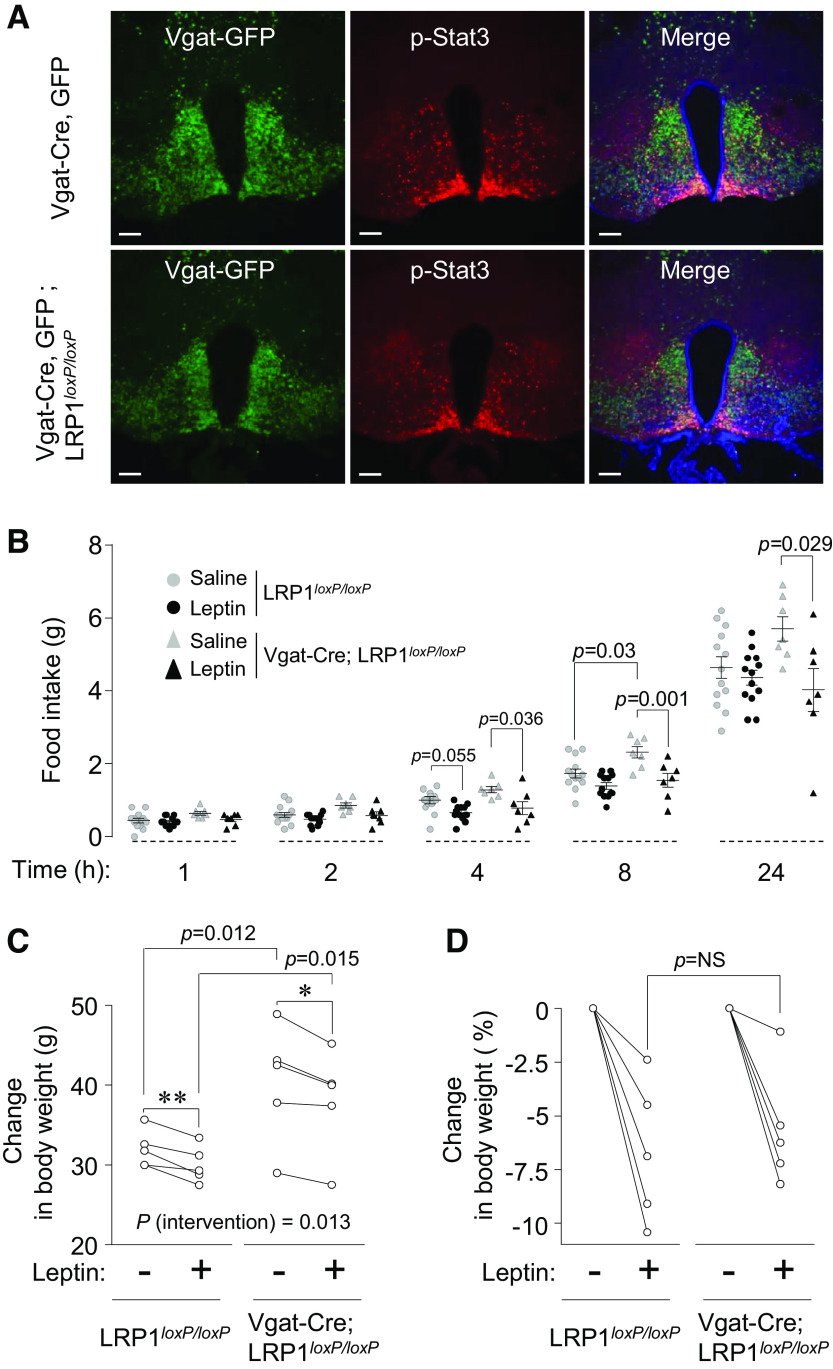
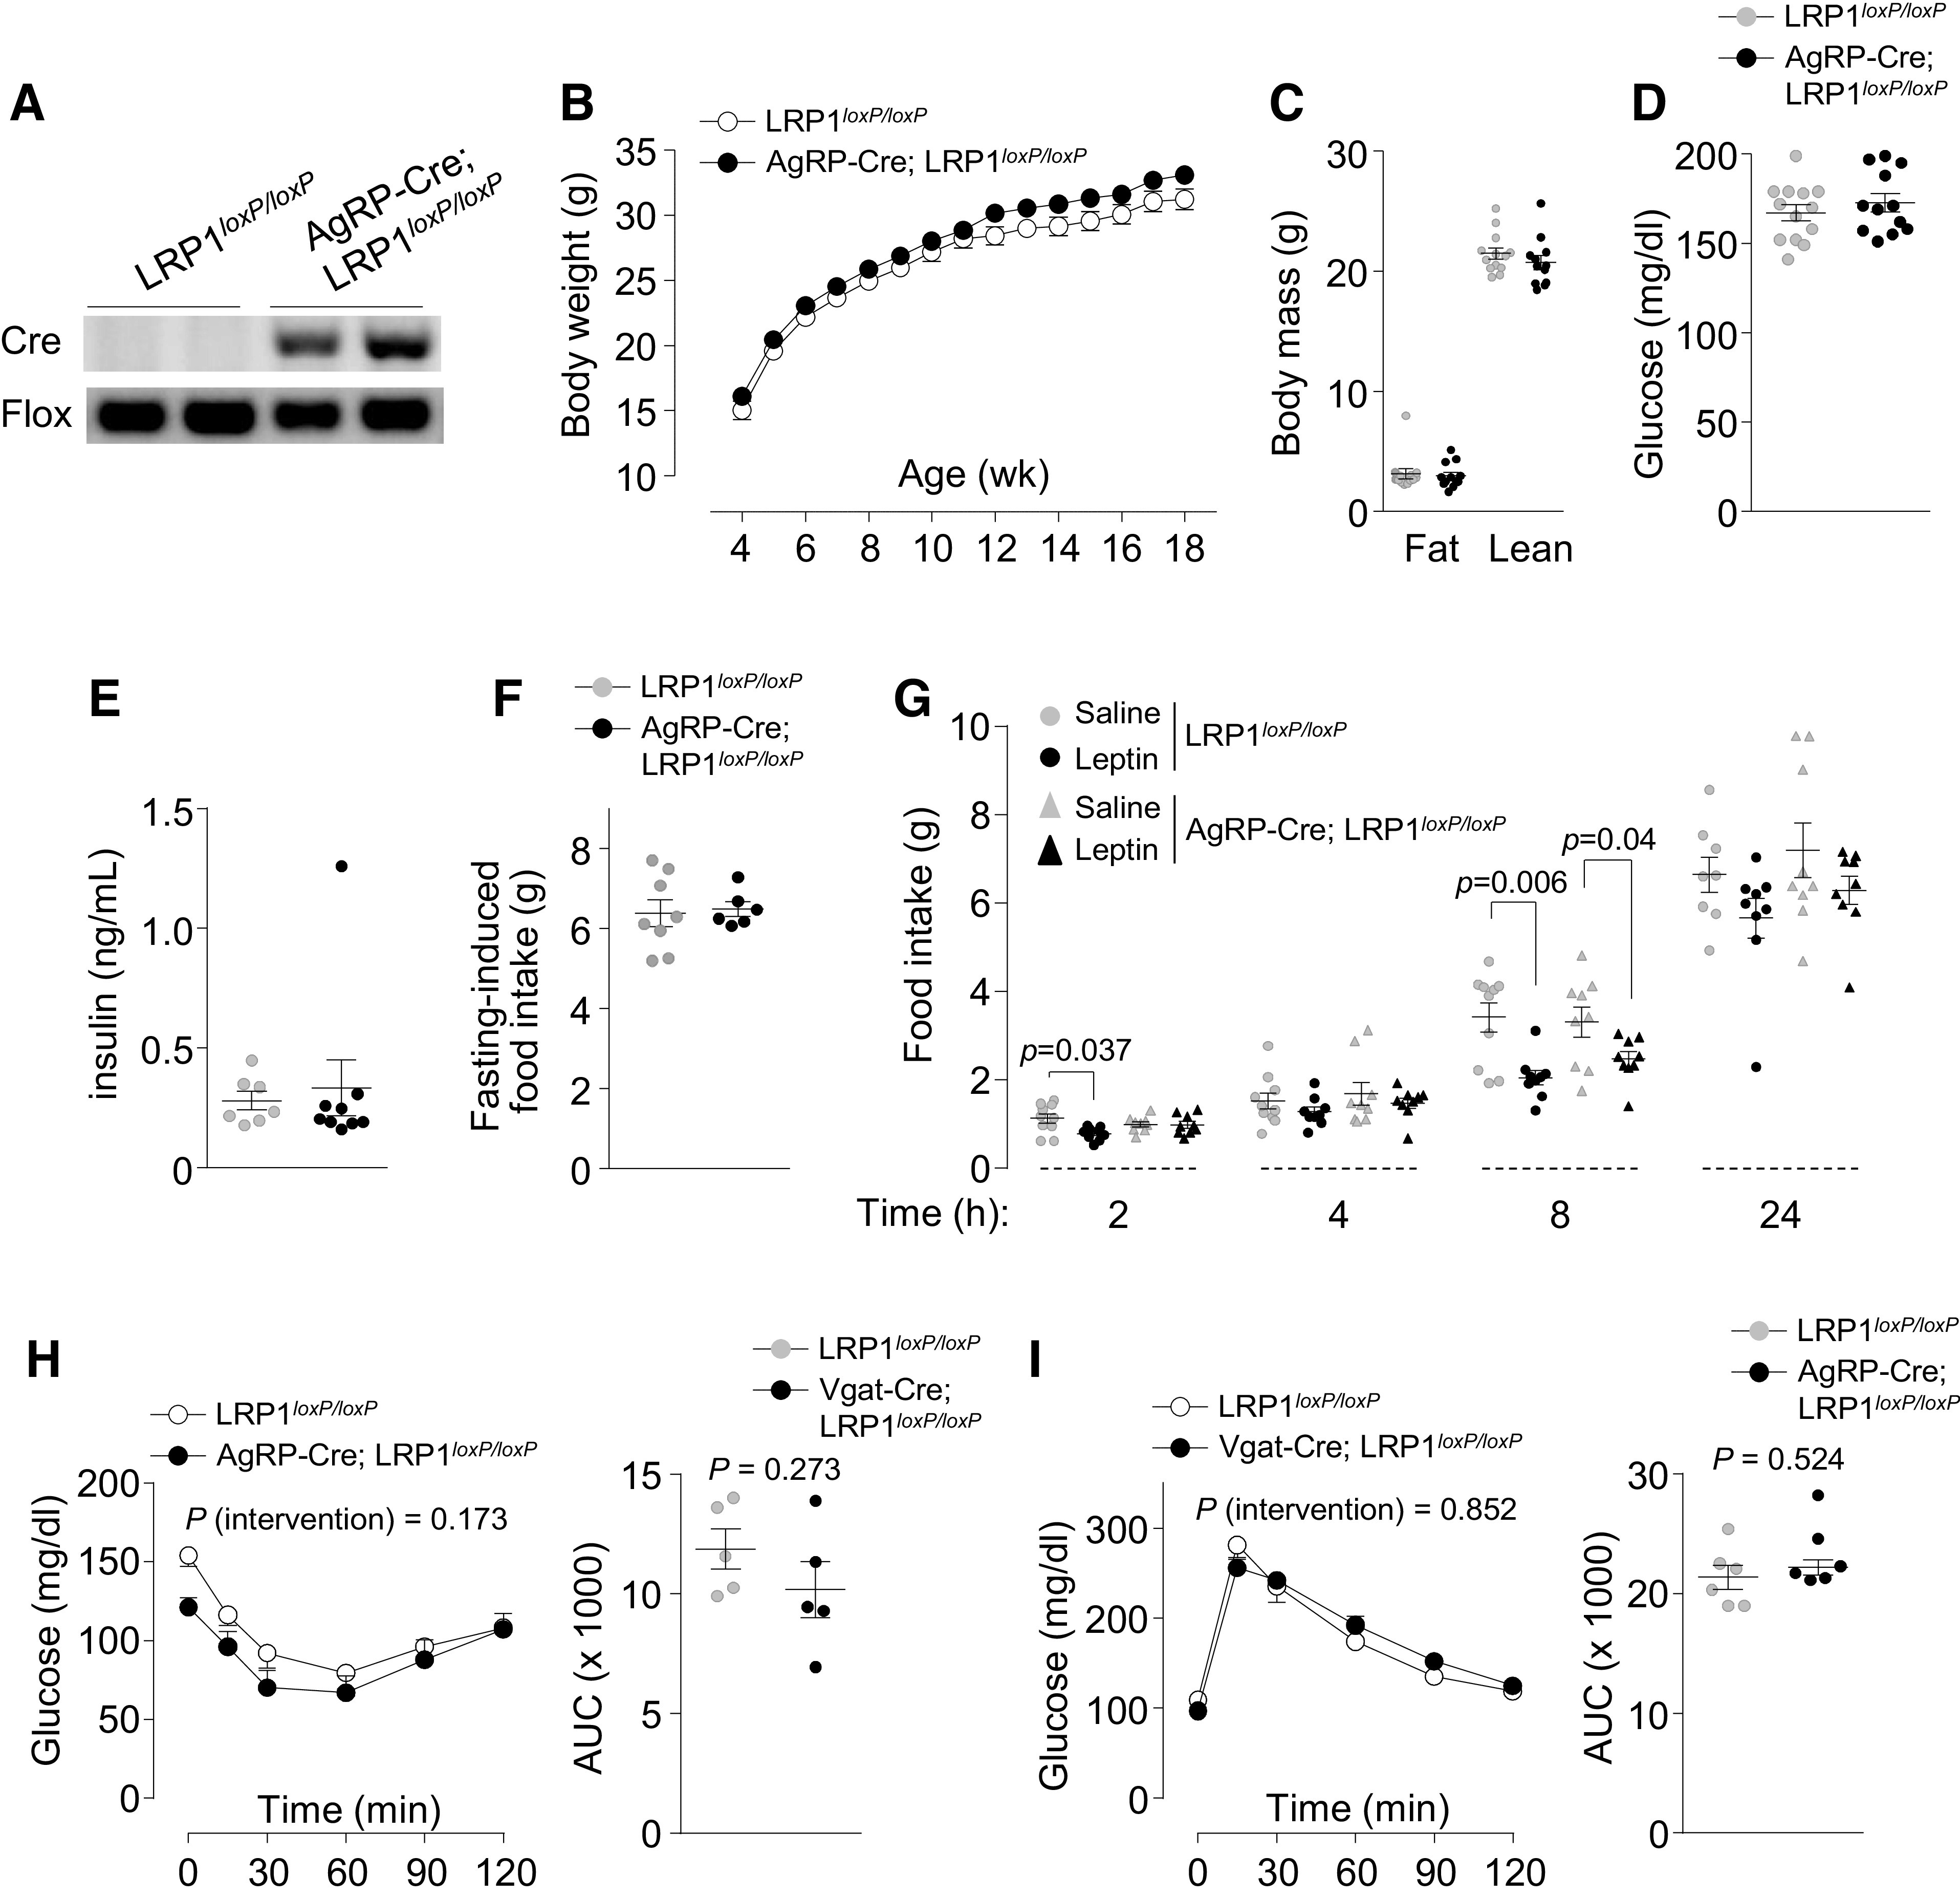
Low-density lipoprotein receptor-related protein 1 (LRP1) is a member of LDL receptor family that plays a key role in systemic glucose and lipid homeostasis. LRP1 also regulates energy balance in the hypothalamus by mediating leptin's anorexigenic action, although the underlying neurocircuitry involved is still unclear. Because GABAergic neurons are a major mediator of hypothalamic leptin action, we studied the role of GABAergic LRP1 in energy balance and leptin action using mice lacking LRP1 in Vgat- or AgRP-expressing neurons (Vgat-Cre; LRP1loxP/loxP or AgRP-Cre; LRP1loxP/loxP). Here, we show that LRP1 deficiency in GABAergic neurons results in severe obesity in male and female mice fed a normal-chow diet. This effect is most likely due to increased food intake and decreased energy expenditure and locomotor activity. Increased adiposity in GABAergic neuron-specific LRP1-deficient mice is accompanied by hyperleptinemia and hyperinsulinemia. Insulin resistance and glucose intolerance in these mice are occurred without change in body weight. Importantly, LRP1 in GABAergic neurons is not required for leptin action, as evidenced by normal leptin's anorexigenic action and leptin-induced hypothalamic Stat3 phosphorylation. In contrast, LRP1 deficiency in AgRP neurons has no effect on adiposity and caloric intake. In conclusion, our data identify GABAergic neurons as a key neurocircuitry that underpins LRP1-dependent regulation of systemic energy balance and body-weight homeostasis. We further find that the GABAergic LRP1 signaling pathway modulates food intake and energy expenditure independently of leptin signaling and AgRP neurons.

Keywords: AgRP; GABAergic; LRP1; Stat3; food intake; leptin.


Figures

None
Graphical abstract
Figure 1.
Figure 1.
Loss of low-density lipoprotein receptor-related protein 1 (LRP1) in GABAergic neuron leads to obesity, hyperphagia, and insulin resistance. Genotyping (A), Body weight (n =5 for control, n = 7 for Vgat-Cre; LRP1loxP/loxP) (B), body mass (n = 5 for control, n = 7 for Vgat-Cre; LRP1loxP/loxP) (C), fat depots (n = 4 for control, n = 6 for Vgat-Cre; LRP1loxP/loxP) (D), daily food intake (n = 11 for control, n = 9 for Vgat-Cre; LRP1loxP/loxP) (E), accumulated food intake for 7 days (n = 11 for control, n = 9 for Vgat-Cre; LRP1loxP/loxP) (F), serum leptin (n = 5 for control, n = 6 for Vgat-Cre; LRP1loxP/loxP) (G), blood glucose (n = 5 for control, n = 7 for Vgat-Cre; LRP1loxP/loxP) (H), serum insulin (n = 5 for control, n = 7 for Vgat-Cre; LRP1loxP/loxP) (I), serum triglycerides (n = 4 for control, n = 7 for Vgat-Cre; LRP1loxP/loxP) (J), and serum cholesterol (n = 4 for control, n = 7 for Vgat-Cre; LRP1loxP/loxP) (K) were measured in male LRP1loxP/loxP and Vgat-Cre; LRP1loxP/loxP mice. Serum parameters and fat depots were measured from overnight fasted mice at 31 wk of age. Food intake was measured at 16 wk of age for 1 wk. All graphs represent means or individual values ± SE. *P <0.05, **P <0.01 vs. LRP1loxP/loxP by two-sided Student’s t test.
Figure 2.
Figure 2.
Low-density lipoprotein receptor-related protein 1 (LRP1) deletion from GABAergic neuron decreases insulin sensitivity and glucose tolerance. Insulin tolerance test (ITT) (n = 5 for control, n = 4 for Vgat-Cre; LRP1loxP/loxP) (A) and glucose tolerance test (GTT) (n = 5 for control, n = 4 for Vgat-Cre; LRP1loxP/loxP) (B) were performed in male LRP1loxP/loxP and Vgat-Cre; LRP1loxP/loxP mice at 6–7 wk of age (n = 4–6). ITT (n = 7 for control, n = 5 for Vgat-Cre; LRP1loxP/loxP) (C) and GTT (n = 7 for control, n = 5 for Vgat-Cre; LRP1loxP/loxP) (D) were performed in female LRP1loxP/loxP and Vgat-Cre; LRP1loxP/loxP mice at 7–8 wk of age (n = 4–6). ITT (n = 6 for control, n = 7 for Vgat-Cre; LRP1loxP/loxP) (E) and GTT (n = 5 for control, n = 6 for Vgat-Cre; LRP1loxP/loxP) (F) were performed in male LRP1loxP/loxP and Vgat-Cre; LRP1loxP/loxP mice at 20–22 wk of age (n = 5–7). Area under the curve (AUC) for ITT and GTT were calculated. All graphs represent means or individual values ± SE. P values (intervention) for ITT and GTT were evaluated by repeated-measures two-way ANOVA, and P values for AUCs were evaluated by two-sided Student’s t test. *P <0.05, **P <0.01, ***P <0.01 vs LRP1loxP/loxP mice by repeated measures two-way ANOVA.
Figure 3.
Figure 3.
Deficiency of low-density lipoprotein receptor-related protein 1 (LRP1) in GABAergic neurons decreases locomotor activity. O2 consumption (A), CO2 production (B), and number of movements (C) were measured in male LRP1loxP/loxP and Vgat-Cre; LRP1loxP/loxP mice (n = 8 for control, n = 7 for Vgat-Cre; LRP1loxP/loxP). Hourly average O2 consumption or CO2 production, corresponding light and dark phase oxygen consumption (12 h average), and number of movements were assessed by Comprehensive Lab Animal Monitoring System (CLAMS) at 12 wk of age. All graphs represent means or individual values ± SE. *P < 0.05, **P <0.01 vs. LRP1loxP/loxP by two-sided Student’s t test.
Figure 4.
Figure 4.
Leptin-induced hypothalamic Stat3 phosphorylation and food intake in Vgat-Cre; LRP1loxP/loxP mice is normal. A: immunofluorescence staining for hypothalamic Stat3 phosphorylation were shown in female Vgat-Cre, GFP and Vgat-Cre, GFP; LRP1loxP/loxP mice at 9–10 wk of age. Mice were intraperitoneally injected with saline or leptin (3 m/kg) and euthanized 40 min later. Scale bars represent 100 µm. B: leptin-induced food intake was measured in in female LRP1loxP/loxP and Vgat-Cre; LRP1loxP/loxP mice at 9–10 wk of age (n = 13 for control, n = 7 for Vgat-Cre; LRP1loxP/loxP). Leptin (3 mg/kg/day) was injected in overnight-fasted mice intraperitoneally and food intake was measured as indicated time points. Changes in body weight (C) and percent changes in body weight after leptin infusion (D) were measured in male LRP1loxP/loxP and Vgat-Cre; LRP1loxP/loxP mice at 30 wk of age (n = 5 for control and Vgat-Cre; LRP1loxP/loxP). Leptin (0.5 mg/kg/day) was infused for 9 days using mini-osmotic pump. Body weights were measured before and after leptin treatment. All graphs represent means or individual values ± SE. P values by repeated-measures two-way ANOVA are indicated. *P < 0.05, **P <0.01 vs. no leptin by Student’s paired t test.
Figure 5.
Figure 5.
Mice lacking low-density lipoprotein receptor-related protein 1 (LRP1) in AgRP-expressing neurons are normal. Genotyping (A), body weight (n = 16 for control and n = 25 AgRP-Cre; LRP1loxP/loxP) (B), body mass (n = 13 for control and n = 12 AgRP-Cre; LRP1loxP/loxP) (C), blood glucose (n = 13 for control and n = 12 AgRP-Cre; LRP1loxP/loxP) (D), serum insulin (n = 7 for control and n = 9 AgRP-Cre; LRP1loxP/loxP) (E), fasting-induced food intake (n = 8 for control and n = 6 AgRP-Cre; LRP1loxP/loxP) (F), leptin-induced food intake (n = 8–10 for control and n = 9 AgRP-Cre; LRP1loxP/loxP) (G), results of insulin tolerance test (ITT) (n = 5 for control and AgRP-Cre; LRP1loxP/loxP) (H), and results of glucose tolerance test (GTT) (n = 6 for control and AgRP-Cre; LRP1loxP/loxP) (I) were measured in male LRP1loxP/loxP and AgRP-Cre; LRP1loxP/loxP mice. Body mass, blood glucose, serum insulin, and leptin-induced food intake were measured at 11–15 wk of age. Leptin (3 mg/kg/day) was injected in overnight fasted mice intraperitoneally, and food intake was measured as indicated time points. Fasting-induced food intake was measured at 24 wk of age. ITT and GTT were performed at 8 wk of age. All graphs represent means or individual values ± SE. P values (intervention) for ITT and GTT as well as leptin-induced food intake were evaluated by repeated-measures two-way ANOVA, and P values for area under the curves (AUCs) were evaluated by two-sided Student’s t test.

Similar articles

Cited by

References

    1. Hales C, Carroll MD, Fryar CD, Ogden CL. Prevalence of Obesity and Severe Obesity Among Adults: United States, 2017–2018. Hyattsville, MD: National Center for Health Statistics, 2020. - PubMed
    1. Global BMI Mortality Collaboration, Di Angelantonio E, Bhupathiraju SN, Wormser D, Gao P, Kaptoge S, , et al. . Body-mass index and all-cause mortality: individual-participant-data meta-analysis of 239 prospective studies in four continents. Lancet 388: 776–786, 2016. doi:10.1016/S0140-6736(16)30175-1. - DOI - PMC - PubMed
    1. Ahima RS, Saper CB, Flier JS, Elmquist JK. Leptin regulation of neuroendocrine systems. Front Neuroendocrinol 21: 263–307, 2000. doi:10.1006/frne.2000.0197. - DOI - PubMed
    1. Elmquist JK, Coppari R, Balthasar N, Ichinose M, Lowell BB. Identifying hypothalamic pathways controlling food intake, body weight, and glucose homeostasis. J Comp Neurol 493: 63–71, 2005. doi:10.1002/cne.20786. - DOI - PubMed
    1. El-Haschimi K, Pierroz DD, Hileman SM, Bjørbaek C, Flier JS. Two defects contribute to hypothalamic leptin resistance in mice with diet-induced obesity. J Clin Invest 105: 1827–1832, 2000. doi:10.1172/JCI9842. - DOI - PMC - PubMed

Publication types

MeSH terms