

Enhanced Neutralizing Antibody Responses to Rhinovirus C and Age-Dependent Patterns of Infection
- PMID: 33357024
- PMCID: PMC8017585
- DOI: 10.1164/rccm.202010-3753OC
Enhanced Neutralizing Antibody Responses to Rhinovirus C and Age-Dependent Patterns of Infection
Abstract
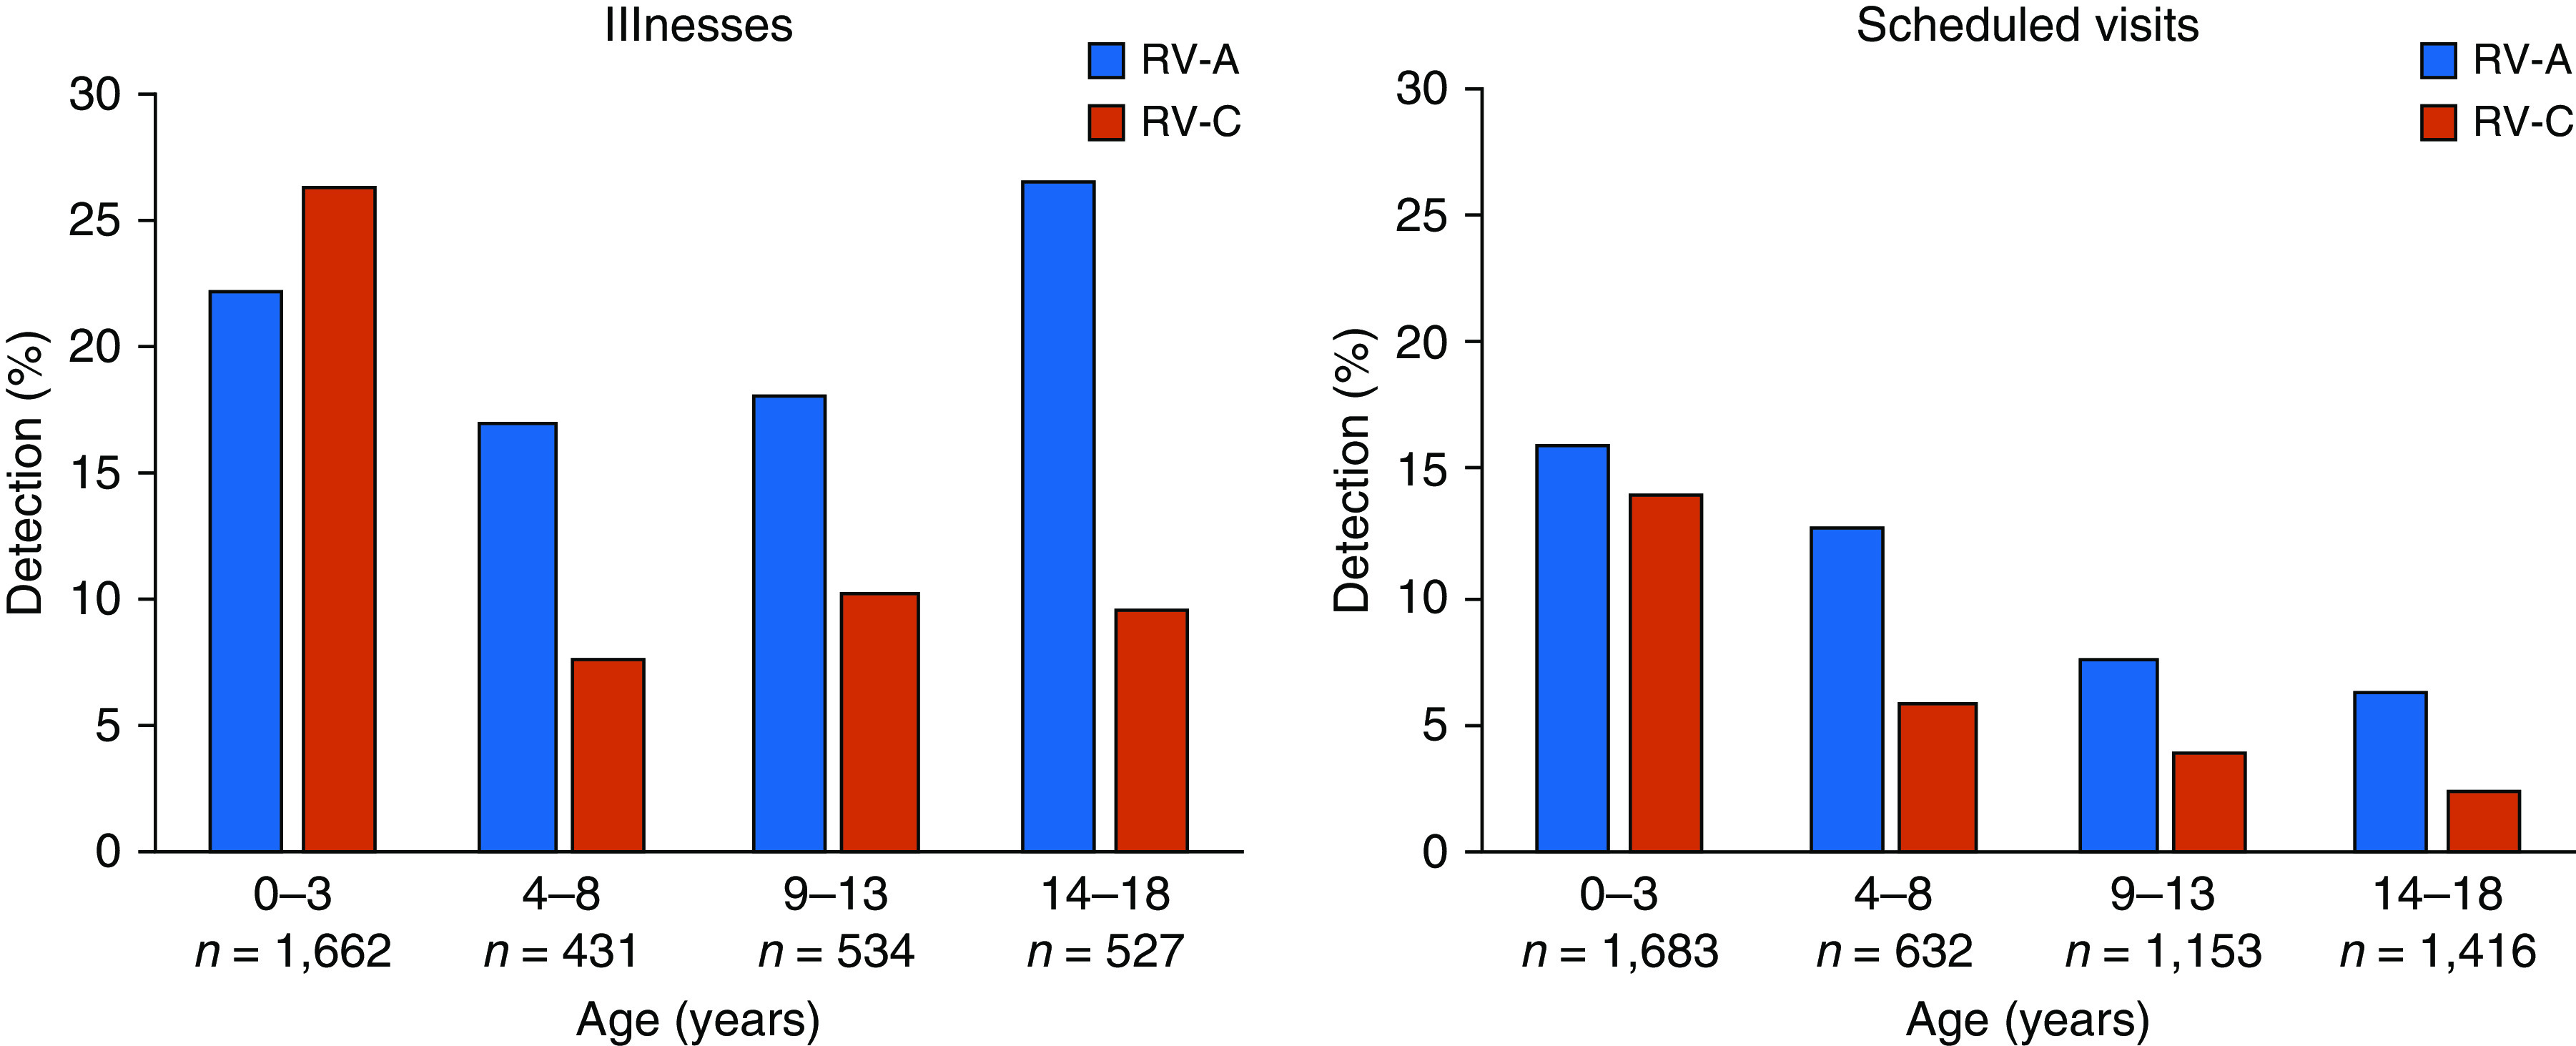
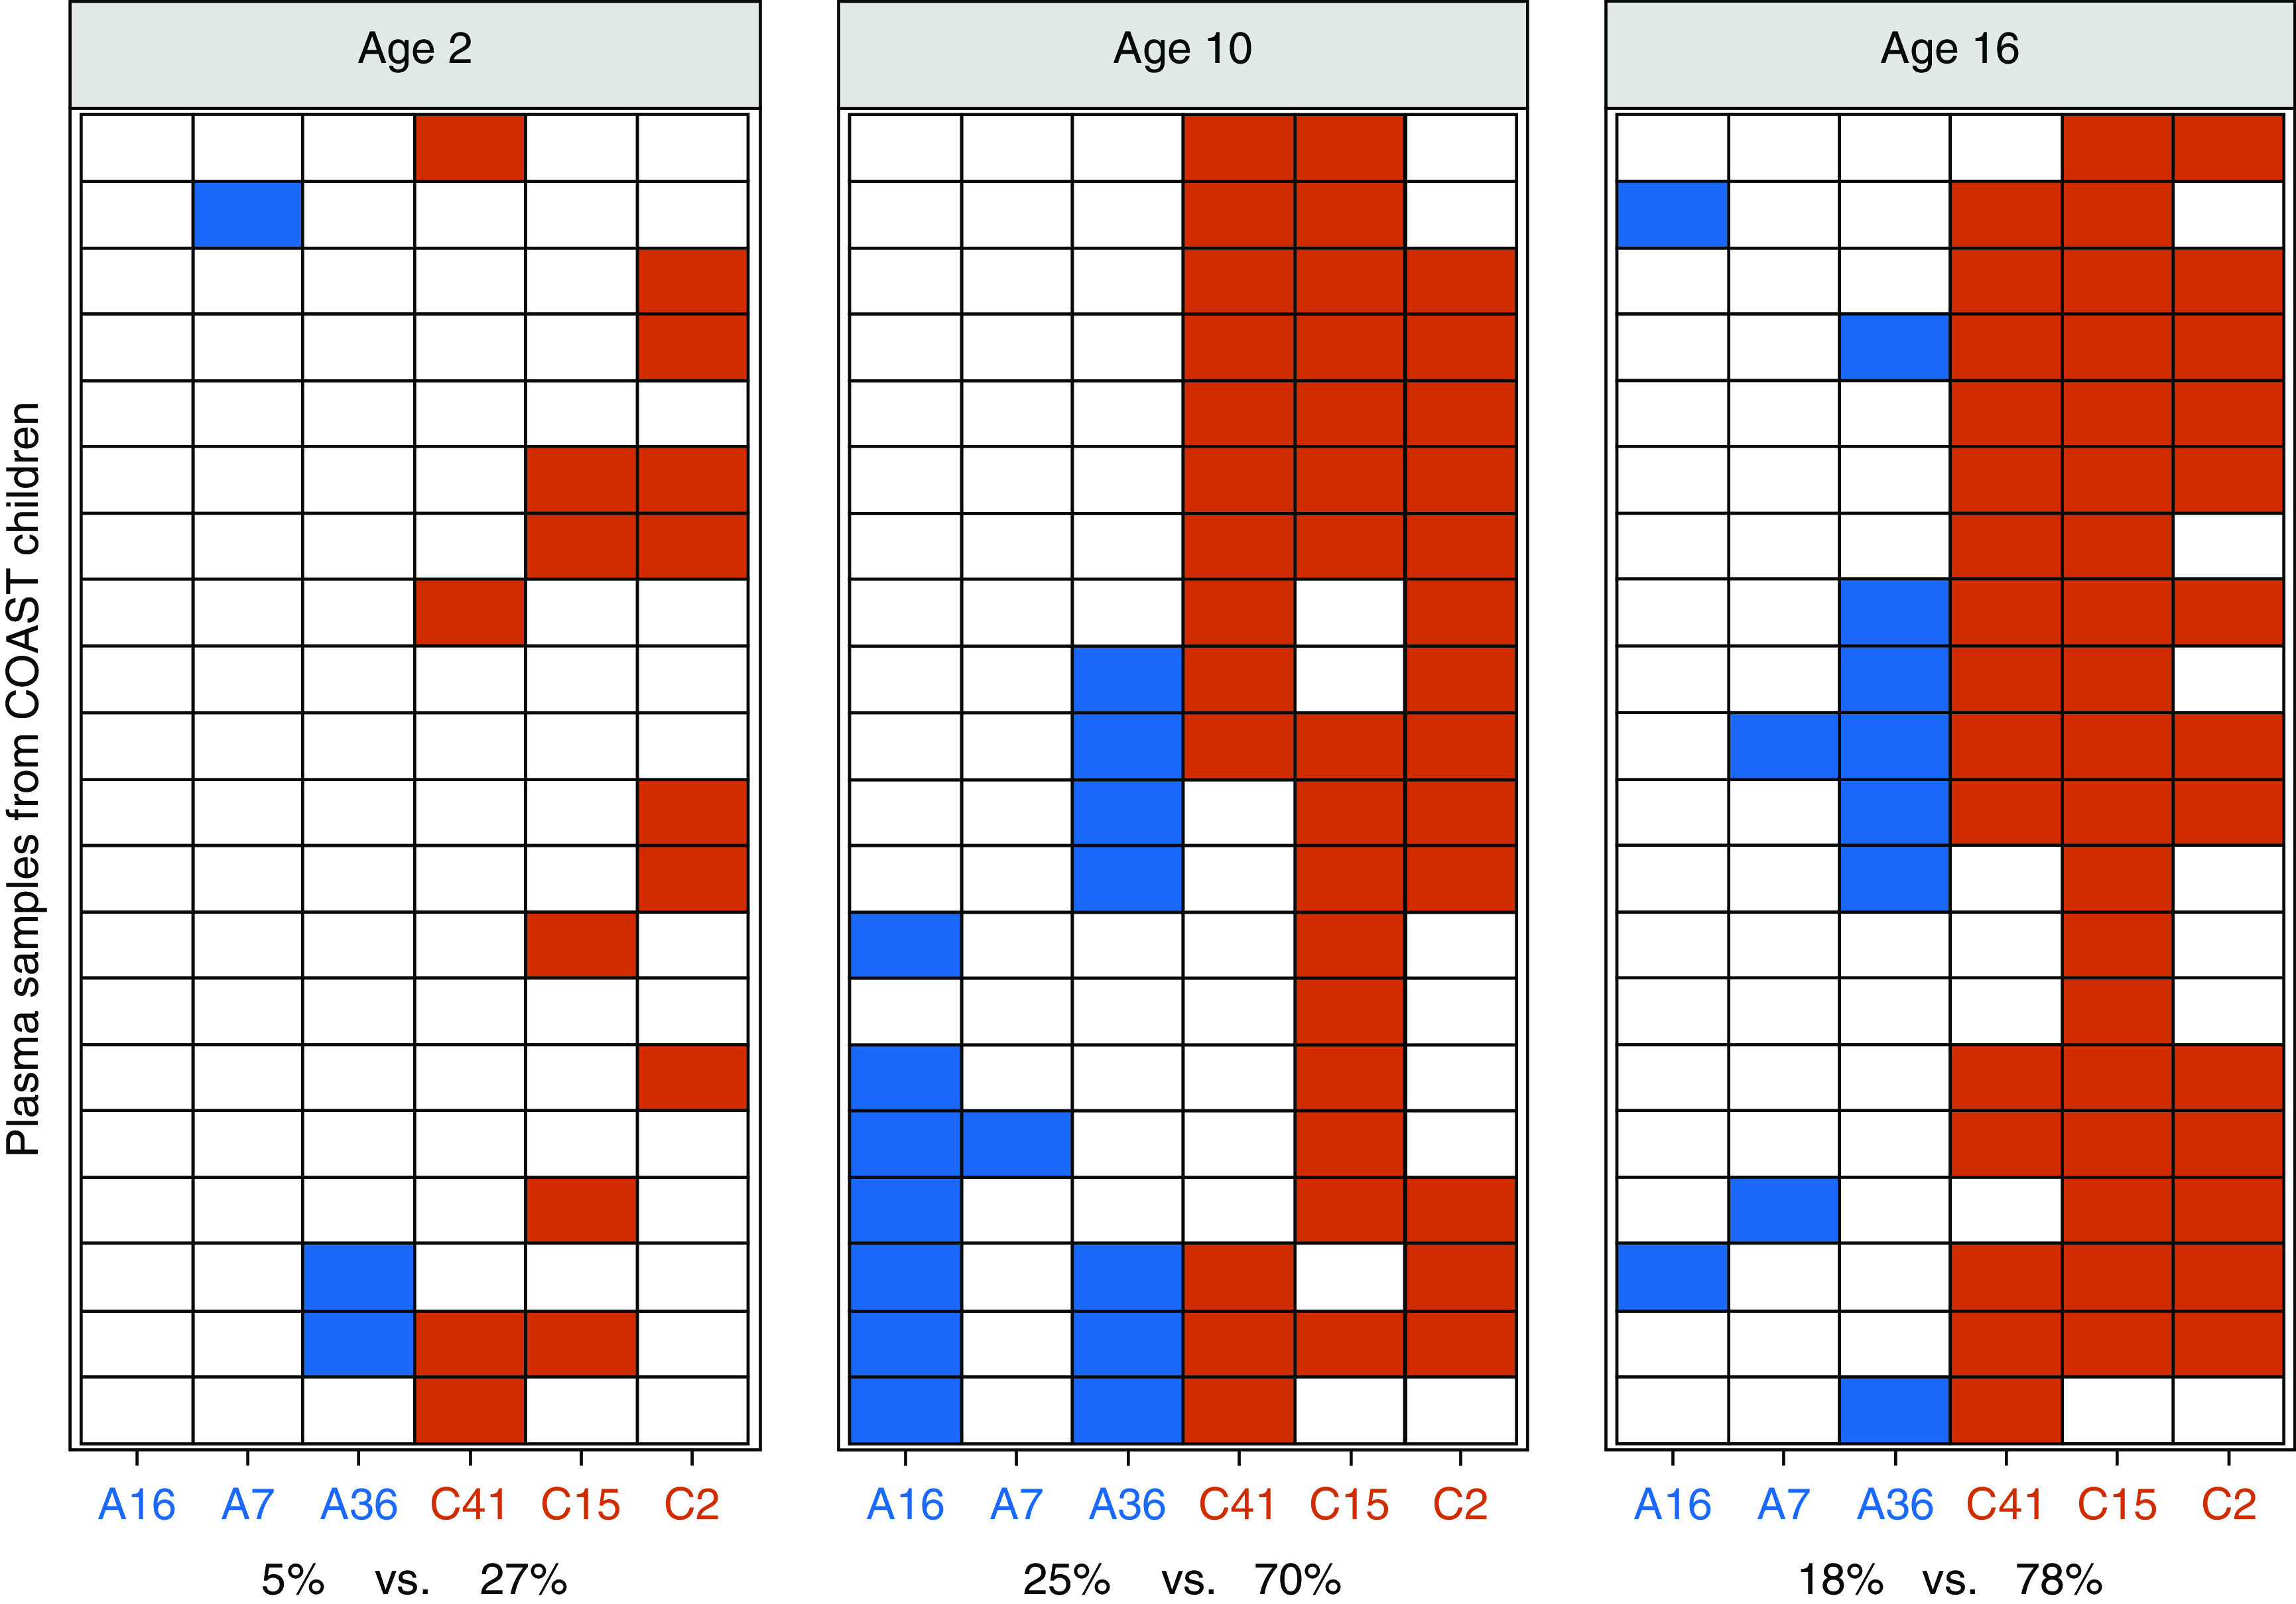
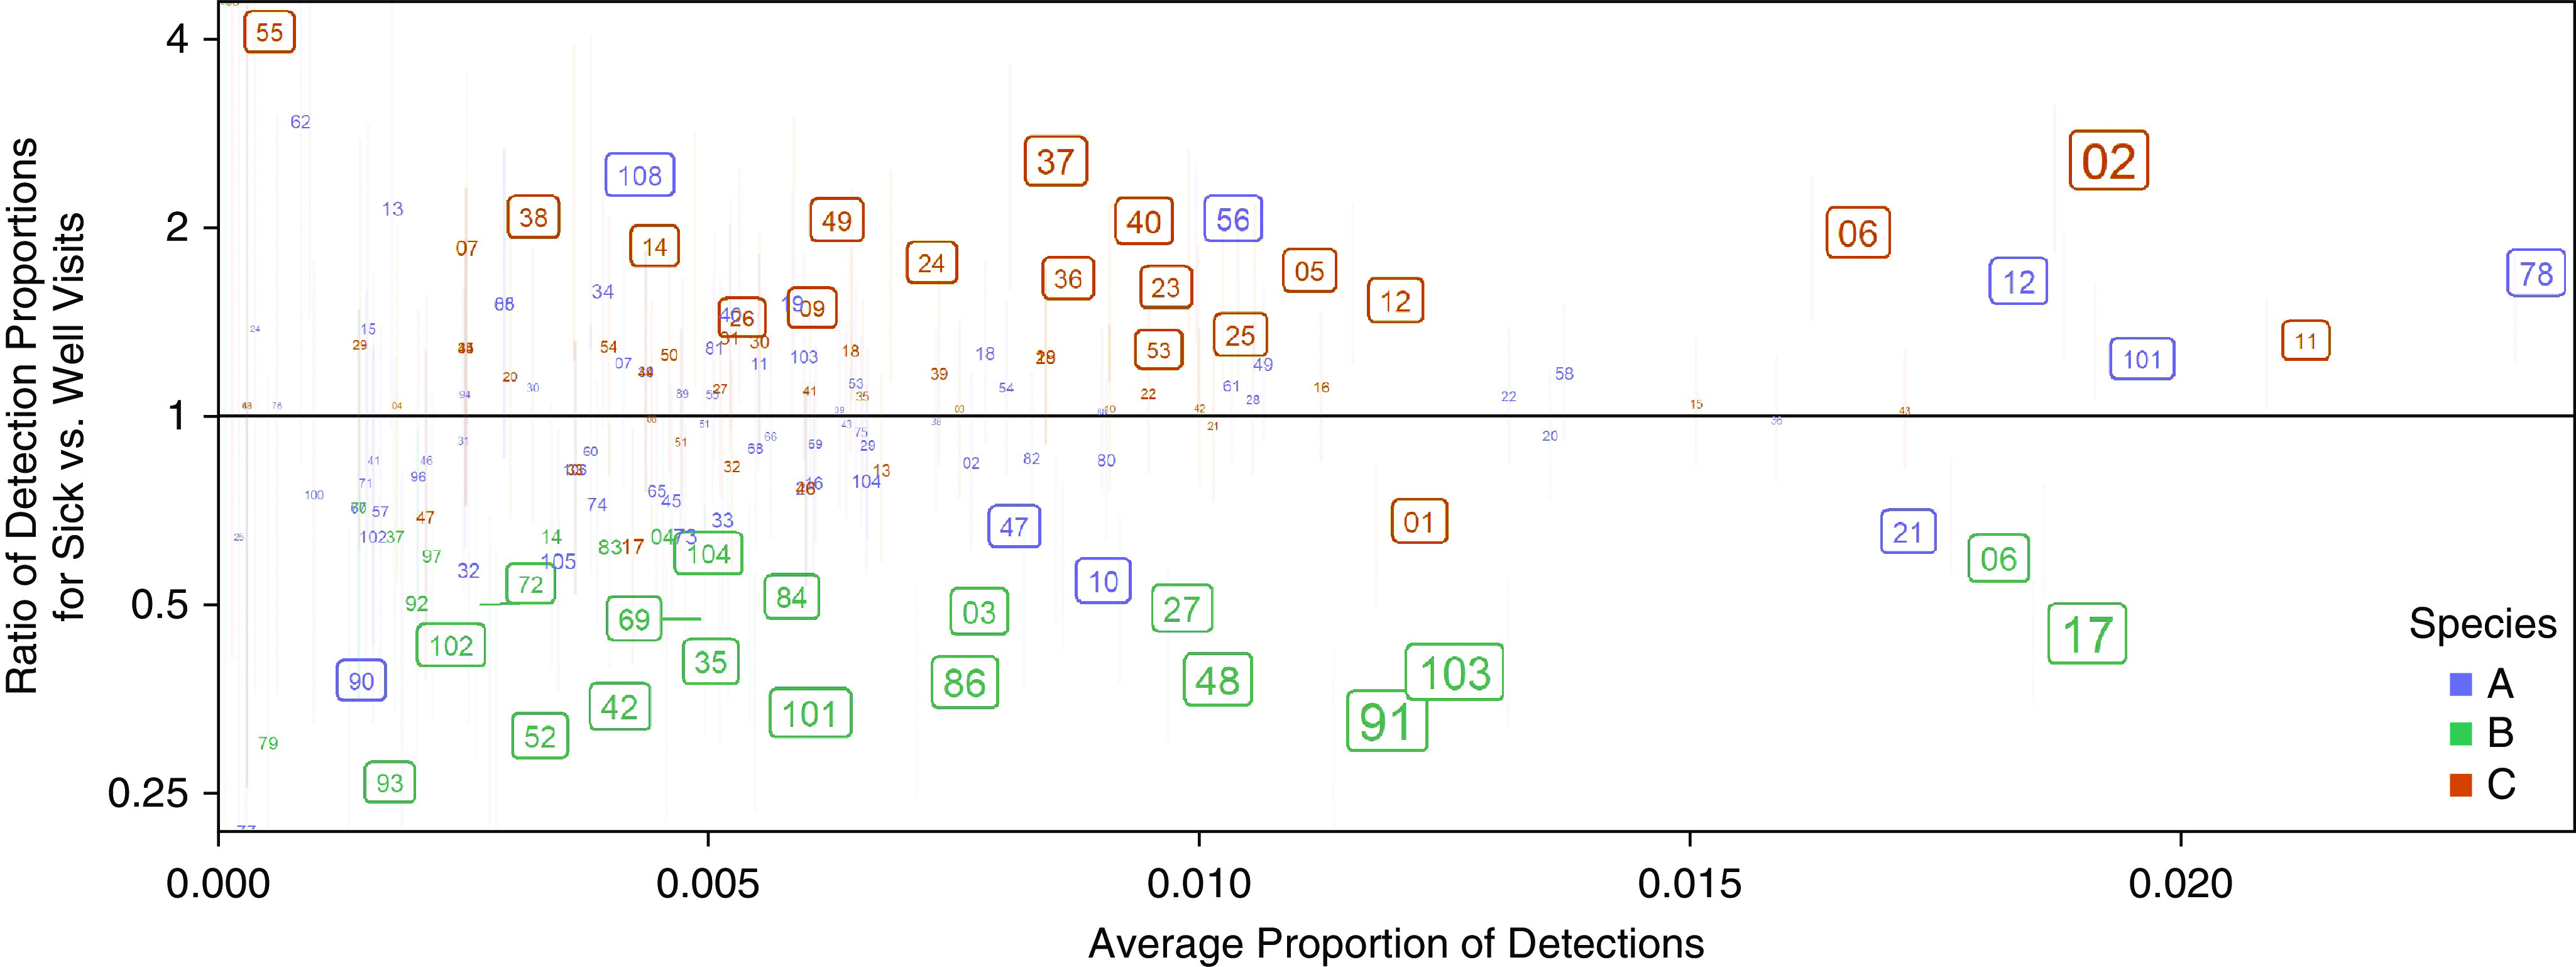
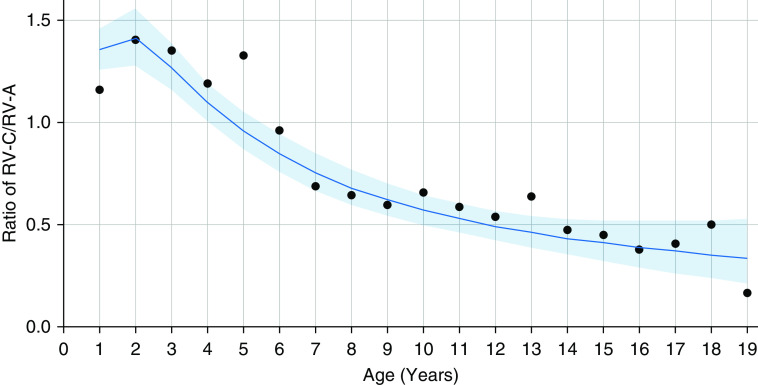
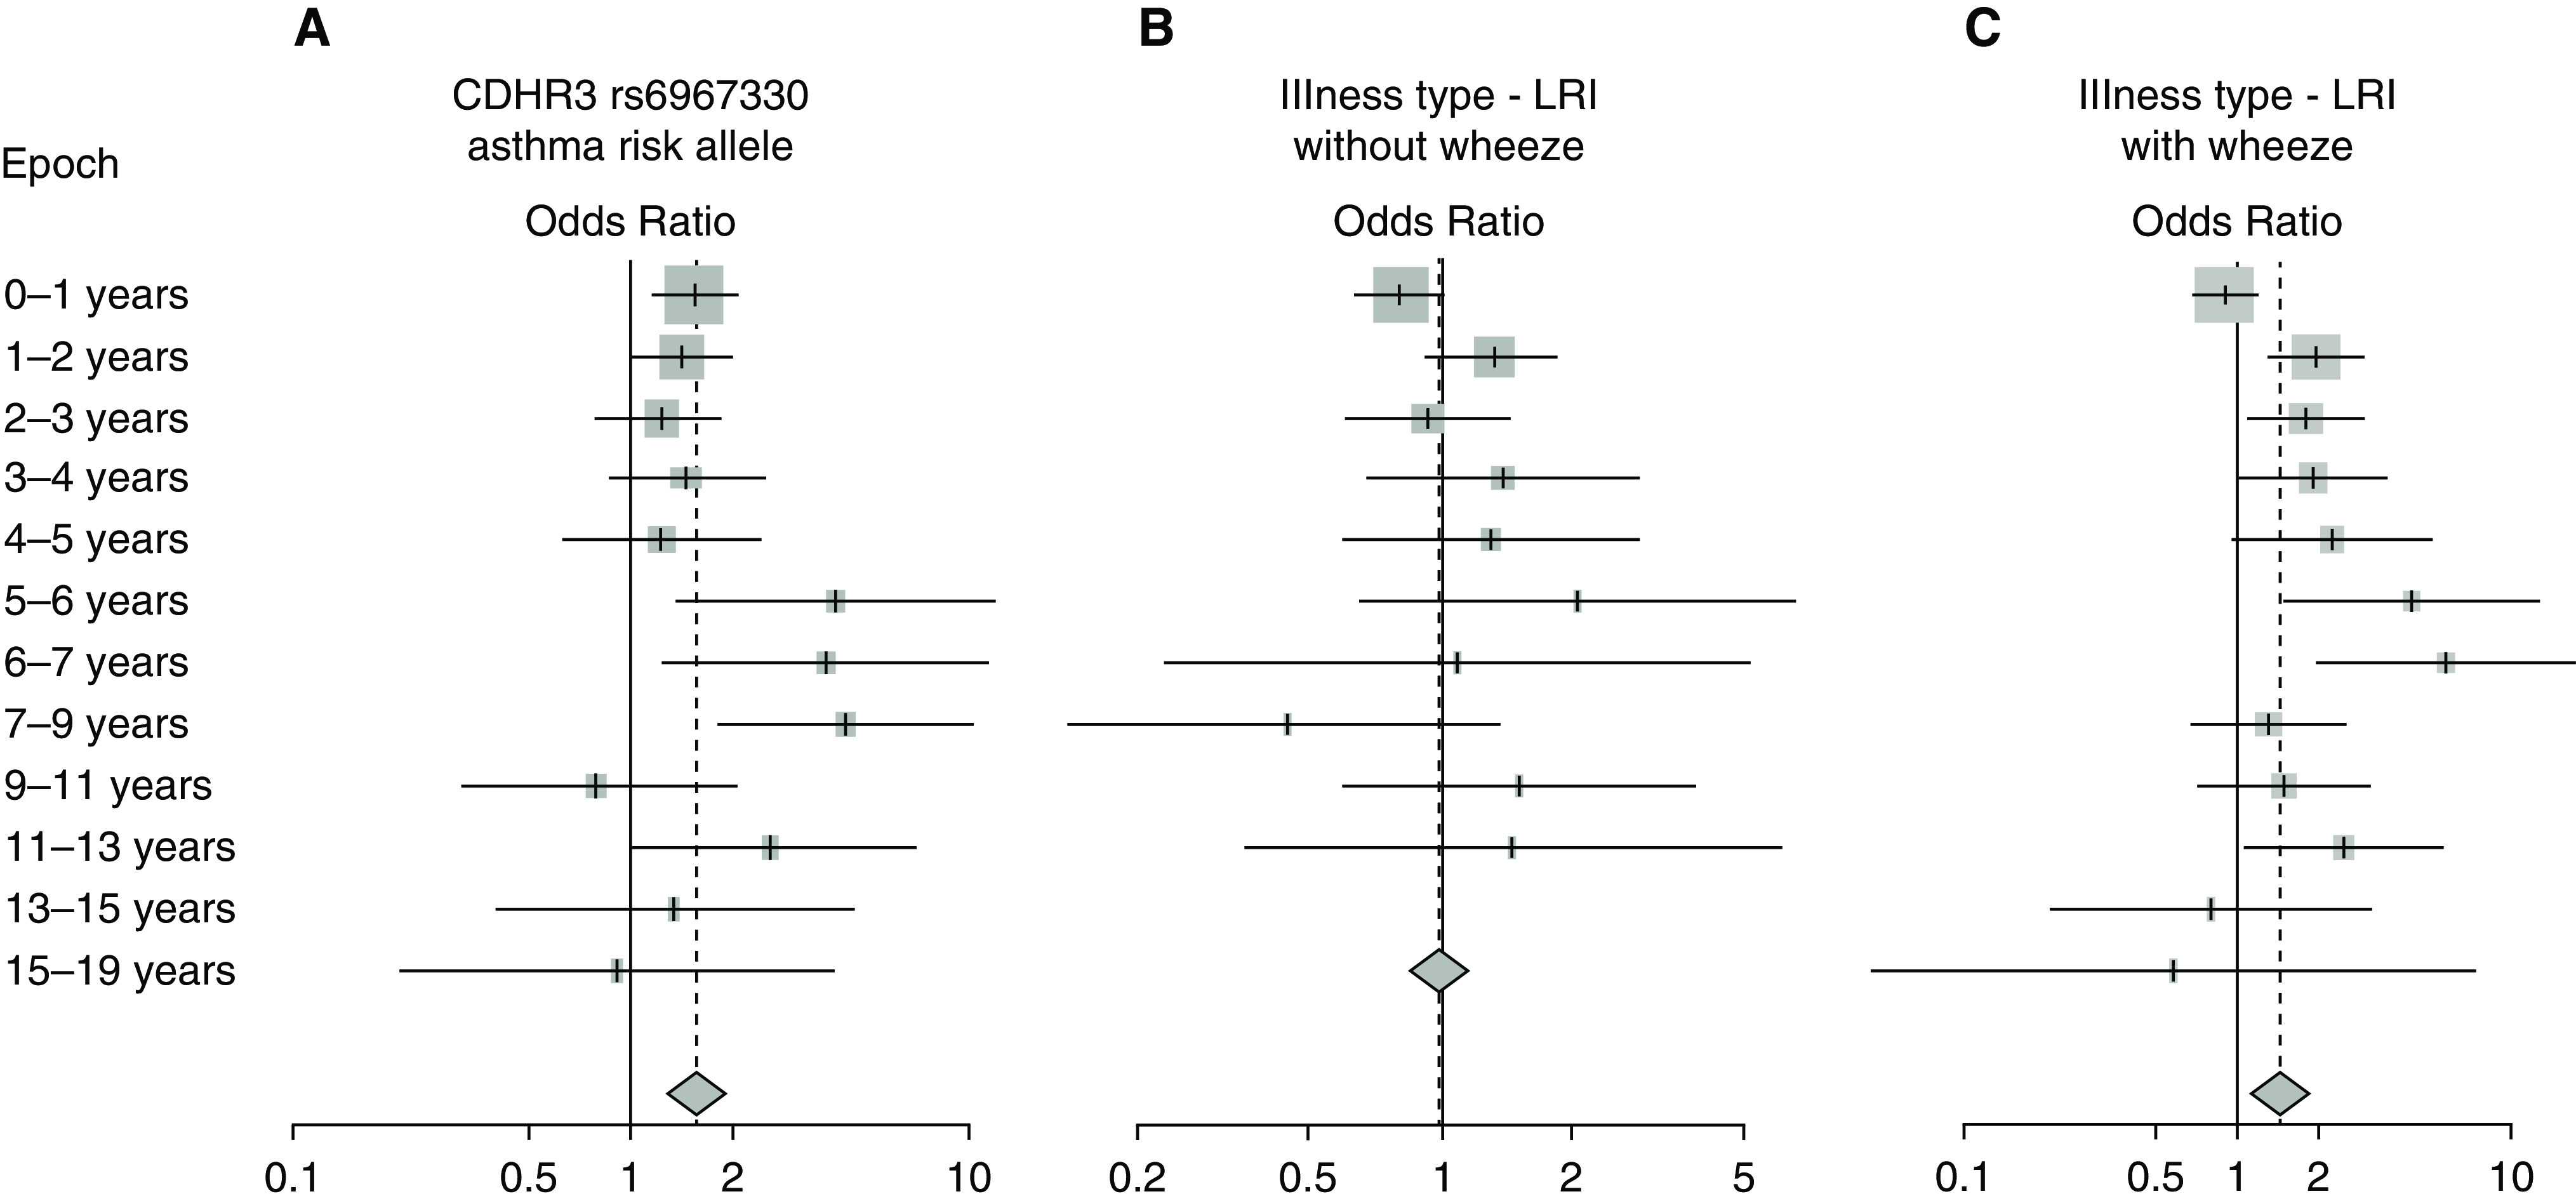
Rationale: Rhinovirus (RV) C can cause asymptomatic infection and respiratory illnesses ranging from the common cold to severe wheezing.Objectives: To identify how age and other individual-level factors are associated with susceptibility to RV-C illnesses.Methods: Longitudinal data from the COAST (Childhood Origins of Asthma) birth cohort study were analyzed to determine relationships between age and RV-C infections. Neutralizing antibodies specific for RV-A and RV-C (three types each) were determined using a novel PCR-based assay. Data were pooled from 14 study cohorts in the United States, Finland, and Australia, and mixed-effects logistic regression was used to identify factors related to the proportion of RV-C versus RV-A detection.Measurements and Main Results: In COAST, RV-A and RV-C infections were similarly common in infancy, whereas RV-C was detected much less often than RV-A during both respiratory illnesses and scheduled surveillance visits (P < 0.001, χ2) in older children. The prevalence of neutralizing antibodies to RV-A or RV-C types was low (5-27%) at the age of 2 years, but by the age of 16 years, RV-C seropositivity was more prevalent (78% vs. 18% for RV-A; P < 0.0001). In the pooled analysis, the RV-C to RV-A detection ratio during illnesses was significantly related to age (P < 0.0001), CDHR3 genotype (P < 0.05), and wheezing illnesses (P < 0.05). Furthermore, certain RV types (e.g., C2, C11, A78, and A12) were consistently more virulent and prevalent over time.Conclusions: Knowledge of prevalent RV types, antibody responses, and populations at risk based on age and genetics may guide the development of vaccines or other novel therapies against this important respiratory pathogen.
Keywords: CDHR3; epidemiology; genetics; rhinovirus; wheezing.
Figures

Comment in
-
A, B, and C Rhinoviruses: New Knowledge from an Impressive Consortium. A Step Forward for Rhinovirus Vaccine Efforts or a Step Back?Am J Respir Crit Care Med. 2021 Apr 1;203(7):786-788. doi: 10.1164/rccm.202102-0346ED. Am J Respir Crit Care Med. 2021. PMID: 33600736 Free PMC article. No abstract available.
References
Publication types
MeSH terms
Substances
Grants and funding
- U24 OD023382/OD/NIH HHS/United States
- R01 AI127507/AI/NIAID NIH HHS/United States
- U2C OD023375/OD/NIH HHS/United States
- UG3 OD035517/OD/NIH HHS/United States
- R01 AI148707/AI/NIAID NIH HHS/United States
- UH3 OD023282/OD/NIH HHS/United States
- R01 AI097172/AI/NIAID NIH HHS/United States
- UL1 TR001422/TR/NCATS NIH HHS/United States
- UG3 OD023282/OD/NIH HHS/United States
- U19 AI104317/AI/NIAID NIH HHS/United States
- UG3 OD035516/OD/NIH HHS/United States
- UM2 AI117870/AI/NIAID NIH HHS/United States
- TL1 RR024978/RR/NCRR NIH HHS/United States
- U24 OD023319/OD/NIH HHS/United States
- UM1 AI114271/AI/NIAID NIH HHS/United States
- R01 AI114552/AI/NIAID NIH HHS/United States
- UH3 OD023253/OD/NIH HHS/United States
- UL1 RR024975/RR/NCRR NIH HHS/United States
- P01 HL070831/HL/NHLBI NIH HHS/United States
- UG3 OD023253/OD/NIH HHS/United States
- U19 AI095227/AI/NIAID NIH HHS/United States
LinkOut - more resources
Full Text Sources
Other Literature Sources
Medical
Miscellaneous
