. 2021 Feb 17;109(4):713-723.e7.
doi: 10.1016/j.neuron.2020.11.024. Epub 2020 Dec 22.

Entorhinal and ventromedial prefrontal cortices abstract and generalize the structure of reinforcement learning problems

Affiliations

Entorhinal and ventromedial prefrontal cortices abstract and generalize the structure of reinforcement learning problems

Alon Boaz Baram et al. Neuron. .

Abstract

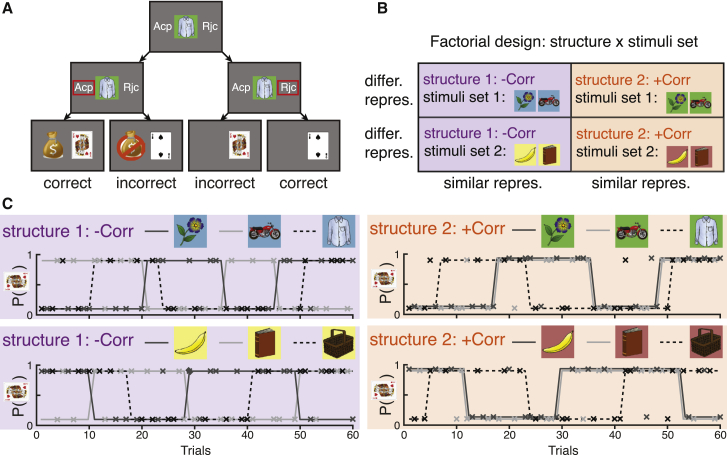
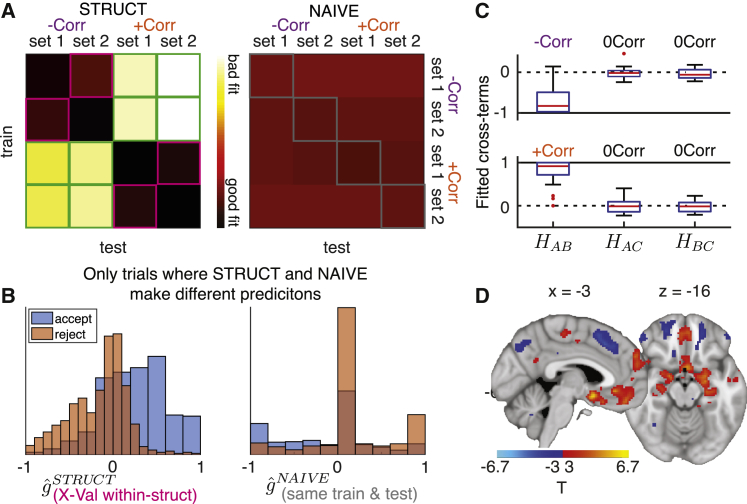
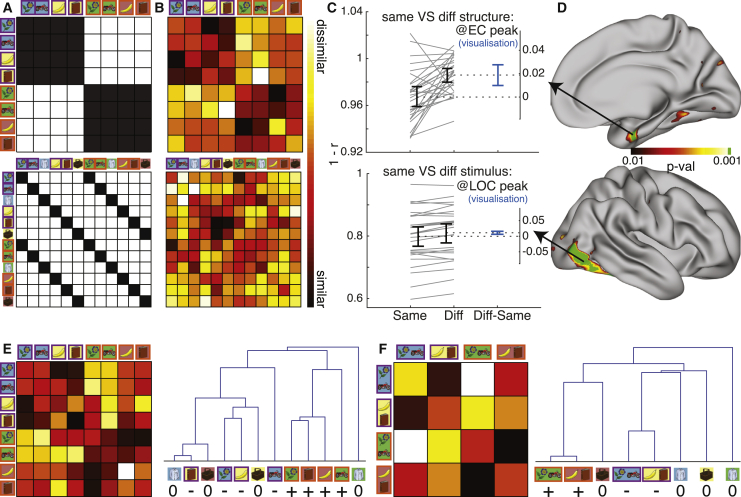
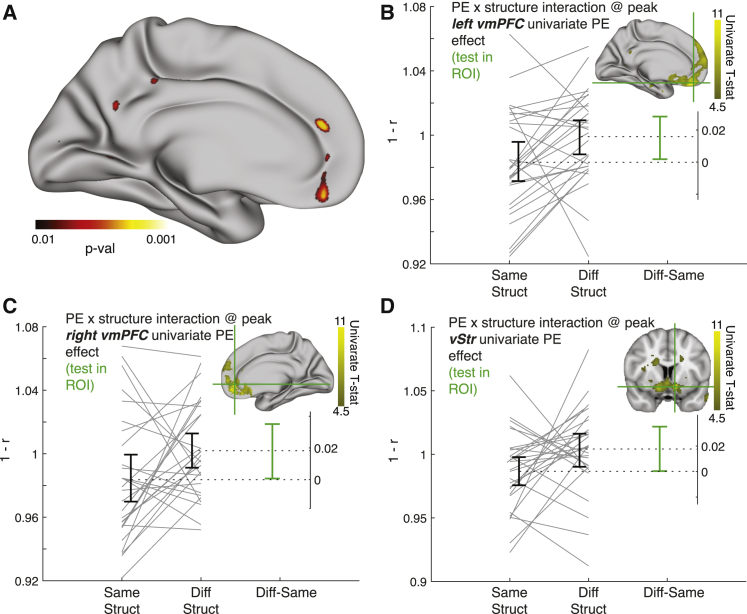
Knowledge of the structure of a problem, such as relationships between stimuli, enables rapid learning and flexible inference. Humans and other animals can abstract this structural knowledge and generalize it to solve new problems. For example, in spatial reasoning, shortest-path inferences are immediate in new environments. Spatial structural transfer is mediated by cells in entorhinal and (in humans) medial prefrontal cortices, which maintain their co-activation structure across different environments and behavioral states. Here, using fMRI, we show that entorhinal and ventromedial prefrontal cortex (vmPFC) representations perform a much broader role in generalizing the structure of problems. We introduce a task-remapping paradigm, where subjects solve multiple reinforcement learning (RL) problems differing in structural or sensory properties. We show that, as with space, entorhinal representations are preserved across different RL problems only if task structure is preserved. In vmPFC and ventral striatum, representations of prediction error also depend on task structure.

Keywords: RL; cognitive map; entorhinal cortex; generalization; grid cells; hippocampal formation; reinforcement learning; spatial cognition; structure learning; vmPFC.


Conflict of interest statement

Declaration of interests The authors declare no conflicting interests.

Figures

Figure 1
Figure 1
Task design (A) Possible progressions of a single trial. (B) Experimental design and neural predictions for structure-encoding brain regions: 2×2 factorial design of stimuli set × relational structure. (C) Example of the reward schedule for one subject in the four block-types. Solid gray lines and dashed black line are the probabilities of a good outcome for the related stimuli and the control stimulus, respectively. Xs mark the stimuli (color) and actual binary outcomes (y axis: 0.1 and 0.9 are bad and good outcomes, respectively) in each trial. For visualization purposes, the two 30 trials long blocks of each of the four block-types were concatenated. While related stimuli in +Corr blocks (right panels) are associated with exactly the same probability, their corresponding light and dark gray lines are slightly offset for visualization purposes.
Figure 2
Figure 2
Subjects use the correlation structure correctly (A) Negative log likelihoods for STRUCT (left) and NAÏVE (right) models (same scale for both matrices). Pink elements: STRUCT models, cross-validated within-structure. Green elements: STRUCT models, cross-validated across structures. Grey elements: NAÏVE models, trained and tested on the same data. (B) Histograms of the estimated outcome probabilities for trials where subjects accepted (blue) or rejected (orange). Left: STRUCT models trained on data with the same structure but different stimuli set (pink elements in A). Right: NAÏVE models, trained and tested on the same data (gray elements in A). Histograms only include trials where the models make different predictions. (C) Fitted cross-terms for pairs of stimuli in all −Corr (top) and +Corr (bottom) blocks. Red central line is the median, the box edges are the 25th and 75th percentiles, the whiskers extend to the most extreme datapoints that are not considered outliers, and the outliers are plotted as red circles. (D) Effect of the chosen action value estimates from STRUCT model, in a GLM where it competes with estimates from NAÏVE model (replication of Hampton et al., [2006]).
Figure 3
Figure 3
The relational structure of the task is represented in the entorhinal cortex Top: relational structure effect, peaking in EC. Bottom: stimulus identity effect, peaking in LOC. (A) Model RDMs. Black elements should be similar, white elements should be dissimilar. Pairs of stimuli with purple and orange rectangles around them are −Corr and +Corr, respectively. (B) Visualization of the data RDM from peak vertex of the effect, marked with an arrow in (D). (C) Visualization of the paired mean difference effects between same (black RDM elements in A) and different (white elements in A) pairs of conditions from the peak vertex of the effects. Both groups are plotted on the left axes as a slope-graph: each paired set of observations for one subject is connected by a line. The paired mean difference is plotted on a floating axis on the right, aligned to the mean of the same group. The mean difference is depicted by a dashed line (consequently aligned to the mean of the diff group). Error bars indicate the 95% confidence interval obtained by a bootstrap procedure. (D) Whole surface results, right hemisphere. Clusters surviving FWE correction across the whole surface at a cluster forming threshold of p < 0.001 are indicated in green. (E and F) Average data RDMs (left) across the entire (anatomically defined) right EC, and dendrograms constructed from them (right). (E) Same GLM as in (B–D). (GLM2); (F) A GLM where the two related stimuli in each block were collapsed onto a single regressor (GLM2a). The control stimuli were omitted from the data RDMs for visualization purposes but are included in the dendrograms (labeled “0”).
Figure 4
Figure 4
Prediction error signals in vmPFC and ventral striatum depend on the current relational structure of the task (A) Visualization of whole-surface results of the multivariate prediction error × relational structure interaction effect, medial left hemisphere. (B) Interaction effect at the left hemisphere vmPFC peak of the univariate prediction error effect (MNI: [−4,44,−20]). (C) Interaction effect at the right hemisphere vmPFC peak of the univariate prediction error effect (MNI: [8,44,−11]). (D) Interaction effect at the ventral striatum peak univariate prediction error effect (MNI: [−10,8,−12]). Brain images in the insets of (B), (C), and (D) show the univariate prediction error effect (projected on the surface in B and C). Legend for (B), (C), and (D) is the same as in Figure 3C.

References

    1. Baldassano C., Hasson U., Norman K.A. Representation of Real-World Event Schemas during Narrative Perception. J. Neurosci. 2018;38:9689–9699. - PMC - PubMed
    1. Banino A., Barry C., Uria B., Blundell C., Lillicrap T., Mirowski P., Pritzel A., Chadwick M.J., Degris T., Modayil J. Vector-based navigation using grid-like representations in artificial agents. Nature. 2018;557:429–433. - PubMed
    1. Bao X., Gjorgieva E., Shanahan L.K., Howard J.D., Kahnt T., Gottfried J.A. Grid-like Neural Representations Support Olfactory Navigation of a Two-Dimensional Odor Space. Neuron. 2019;102:1066–1075.e5. - PMC - PubMed
    1. Barron H.C., Dolan R.J., Behrens T.E.J. Online evaluation of novel choices by simultaneous representation of multiple memories. Nat. Neurosci. 2013;16:1492–1498. - PMC - PubMed
    1. Barry C., Ginzberg L.L., O’Keefe J., Burgess N. Grid cell firing patterns signal environmental novelty by expansion. Proc. Natl. Acad. Sci. USA. 2012;109:17687–17692. - PMC - PubMed

Publication types

LinkOut - more resources