. 2021 Jan 5;34(1):108590.
doi: 10.1016/j.celrep.2020.108590. Epub 2020 Dec 16.

Cell-Type-Specific Immune Dysregulation in Severely Ill COVID-19 Patients

Affiliations

Cell-Type-Specific Immune Dysregulation in Severely Ill COVID-19 Patients

Changfu Yao et al. Cell Rep. .

Erratum in

  • Cell-type-specific immune dysregulation in severely ill COVID-19 patients.
    Yao C, Bora SA, Parimon T, Zaman T, Friedman OA, Palatinus JA, Surapaneni NS, Matusov YP, Chiang GC, Kassar AG, Patel N, Green CER, Aziz AW, Suri H, Suda J, Lopez AA, Martins GA, Stripp BR, Gharib SA, Goodridge HS, Chen P. Yao C, et al. Cell Rep. 2021 Mar 30;34(13):108943. doi: 10.1016/j.celrep.2021.108943. Cell Rep. 2021. PMID: 33789116 Free PMC article. No abstract available.

Abstract

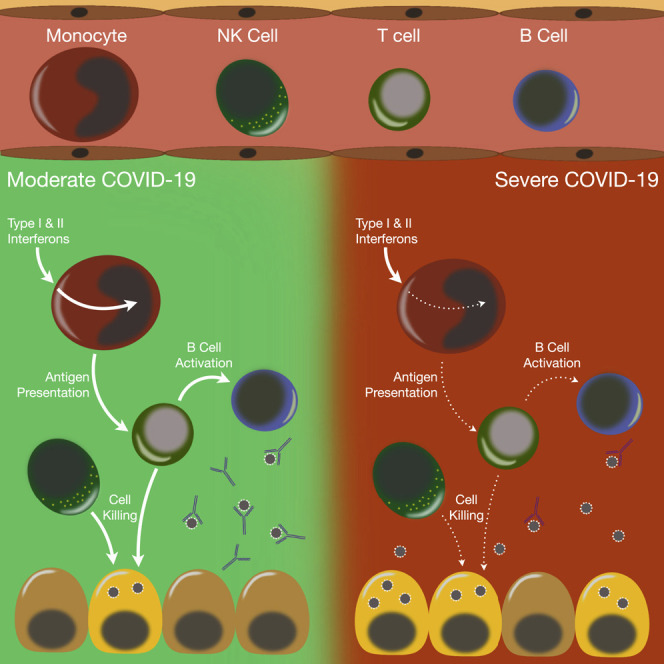
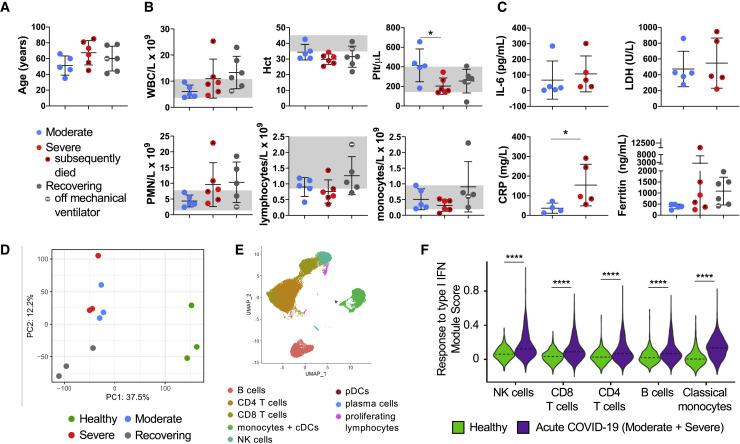
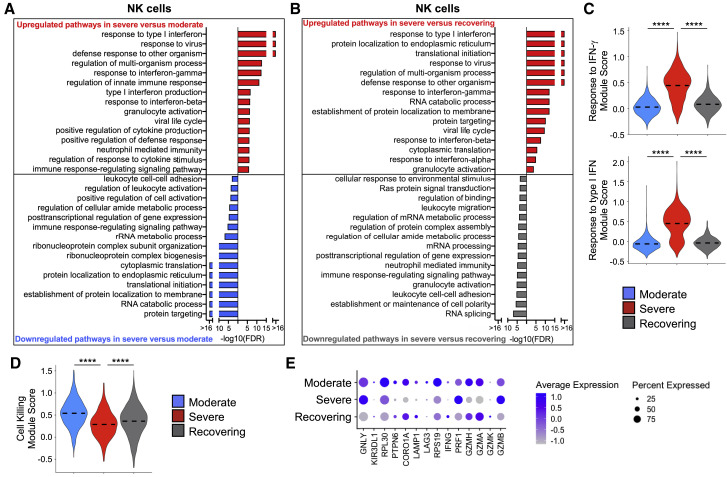
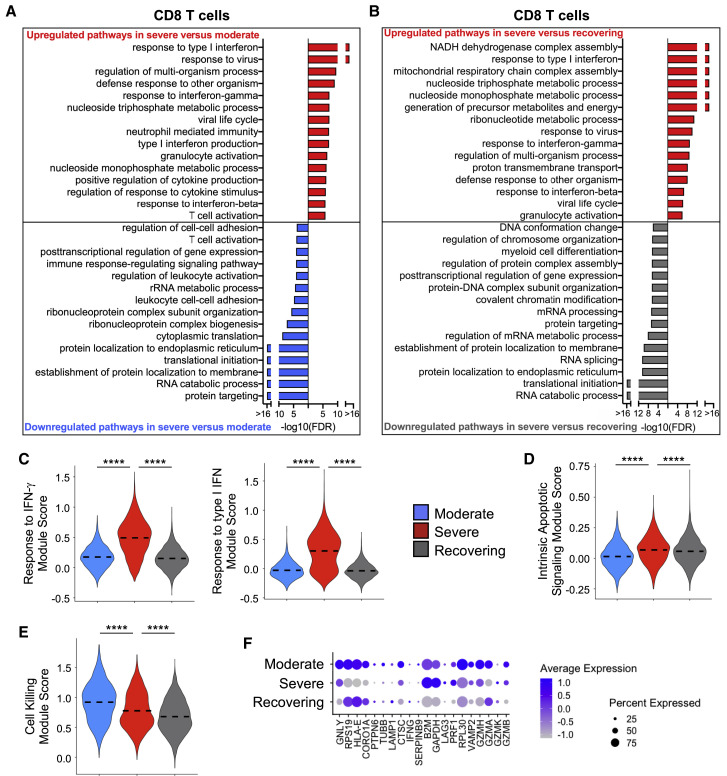
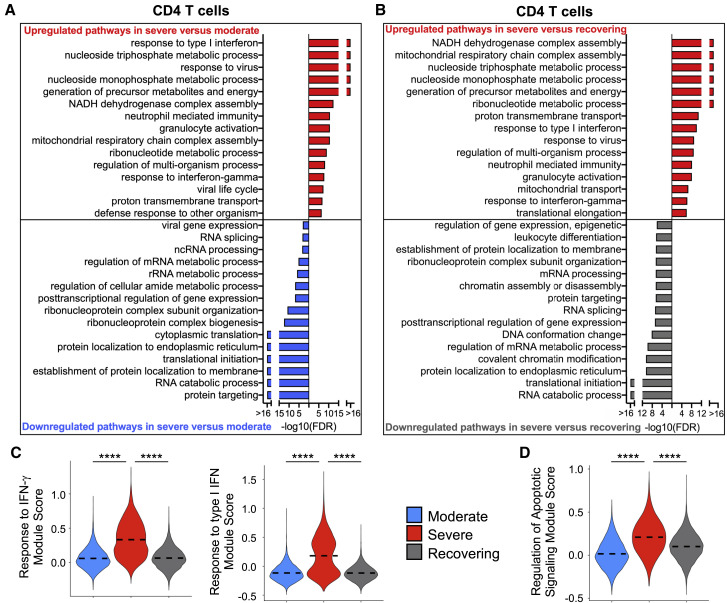
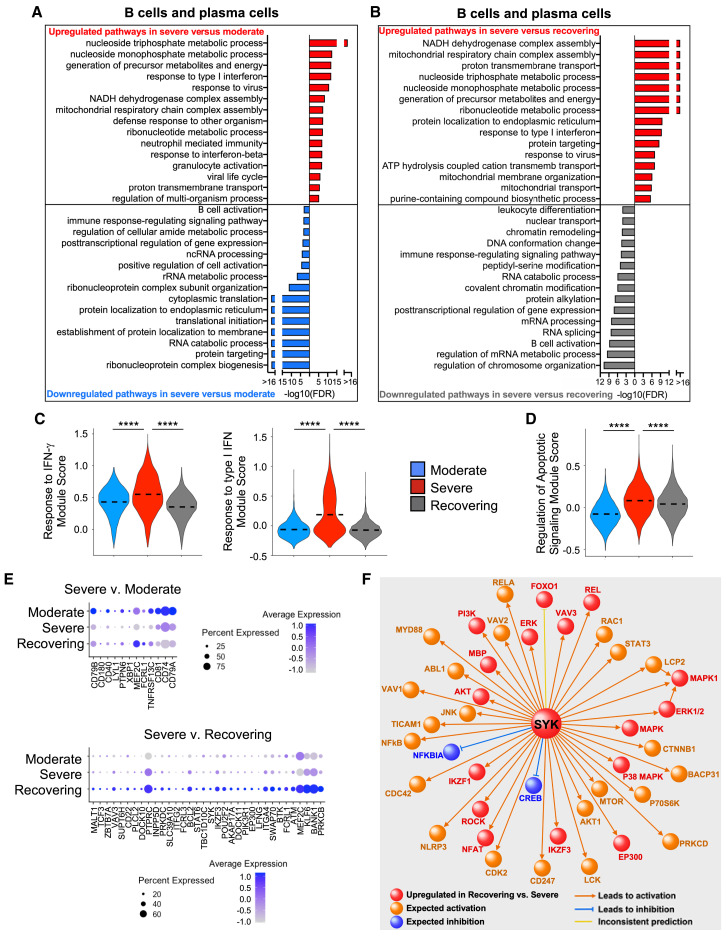
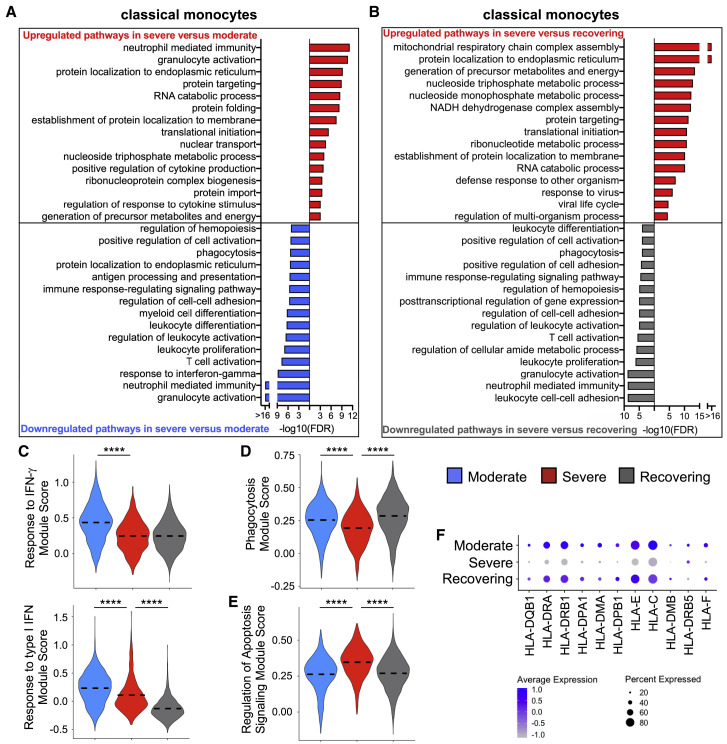
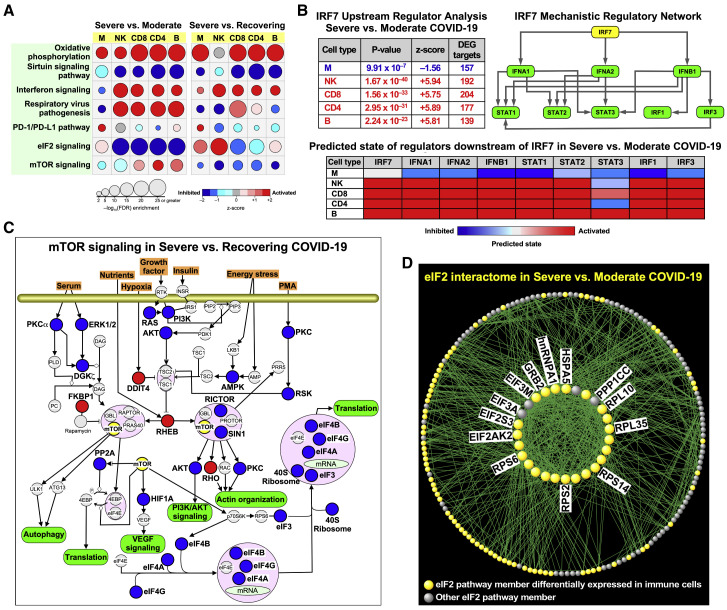
Recent studies have demonstrated immunologic dysfunction in severely ill coronavirus disease 2019 (COVID-19) patients. We use single-cell RNA sequencing (scRNA-seq) to analyze the transcriptome of peripheral blood mononuclear cells (PBMCs) from healthy (n = 3) and COVID-19 patients with moderate disease (n = 5), acute respiratory distress syndrome (ARDS, n = 6), or recovering from ARDS (n = 6). Our data reveal transcriptomic profiles indicative of defective antigen presentation and interferon (IFN) responsiveness in monocytes from ARDS patients, which contrasts with higher responsiveness to IFN signaling in lymphocytes. Furthermore, genes involved in cytotoxic activity are suppressed in both natural killer (NK) and CD8 T lymphocytes, and B cell activation is deficient, which is consistent with delayed viral clearance in severely ill COVID-19 patients. Our study demonstrates that COVID-19 patients with ARDS have a state of immune imbalance in which dysregulation of both innate and adaptive immune responses may be contributing to a more severe disease course.

Keywords: ARDS; COVID-19; SARS-CoV-2; acute respiratory distress syndrome; coronavirus disease 2019; network analysis; severe acute respiratory syndrome coronavirus 2; single-cell RNA sequencing.


Conflict of interest statement

Declaration of Interests The authors declare no competing interests.

Figures

None
Graphical abstract
Figure 1
Figure 1
Evaluation of Blood Cells Subsets in Moderate, Severe (ARDS), and Recovering (post-ARDS) COVID-19 Patients (A) Age distribution of hospitalized COVID-19 patients requiring minimal respiratory support (moderate, n = 5), with ARDS (severe, n = 6), and recovering from ARDS (recovering, n = 6). Mean ± SD overlaid on dot plot. (B) Clinical complete blood count (CBC) with differential cell count for COVID-19 patients. One-way ANOVA with Tukey’s multiple comparisons was used to test significance. Normal ranges are indicated by gray shading. Mean ± SD overlaid on dot plot. p < 0.05. (C) Inflammatory markers in patients’ peripheral blood samples at admission (IL-6, lactate dehydrogenase [LDH], and C-reactive protein [CRP] were not available for the recovering group). Mann-Whitney test was used for IL-6, LDH, and CRP, and Kruskal-Wallis test with Dunn’s multiple comparison was used for ferritin. p < 0.05. (D–F) Peripheral blood leukocytes from COVID-19 patients were assessed by scRNA-seq in comparison with healthy controls. Principal component analysis (PCA) of patient pairs from the same group sequenced together demonstrates clustering by disease stage (healthy control, acute COVID-19, recovering ARDS), but does not separate moderately and severely ill patients (D). UMAP visualization reveals the major immune cell subsets (E). Violin plot of response to type I IFN module genes for each cell from healthy versus acute COVID-19 patients (moderate and severe groups combined; F). Kruskal-Wallis test was used to test overall significance in module scores, p < 2.2 × 10−16. Wilcoxon test was used for pairwise comparisons, ∗∗∗∗p < 0.0001.
Figure 2
Figure 2
NK Cells in Severe Patients Have Gene Expression Profiles Indicative of Higher Interferon (IFN) Signaling but Defective Cell Killing (A and B) Global transcriptome differences between severe and moderate (A) and between severe and recovering (B) were evaluated in all NK cells by overrepresentation analysis of up- and downregulated biological processes. (C and D) Violin plots of response to IFN-γ and response to type I IFN modules (C) and cell killing module (D) of each cell from patient groups. Kruskal-Wallis test was used to test overall significance in module scores, p < 2.2 × 10−16. Wilcoxon test was used for pairwise comparisons, ∗∗∗∗p < 0.0001. (E) Average expression of differentially expressed genes (DEGs) involved in cytotoxicity from patient groups.
Figure 3
Figure 3
CD8 T Cells in Severe Group Patients Have Gene Expression Profiles Indicative of Higher IFN Signaling, Increased Apoptotic Gene Expression, and Defective Cell Killing (A and B) Global transcriptome differences between severe and moderate (A) and severe and recovering (B) were evaluated in all CD8 T cells by overrepresentation analysis of up- and downregulated biological processes. (C–E) Violin plots of response to IFN-γ and response to type I IFN modules (C), intrinsic apoptotic signaling module (D), and cell killing module (E) of each cell from patient groups. Kruskal-Wallis test was used to test overall significance in module scores, p < 2.2 × 10−16. Wilcoxon test was used for pairwise comparisons, ∗∗∗∗p < 0.0001. (F) Average expression of DEGs involved in cytotoxicity from patient groups.
Figure 4
Figure 4
CD4 T Cells in Severe Group Patients Have Gene Expression Profiles Indicative of Higher IFN Signaling, Increased Apoptotic Gene Expression, and Metabolic Activation (A and B) Global transcriptome differences between severe and moderate (A) and severe and recovering (B) were evaluated in CD4 T cells (all T cells expressing CD4) by overrepresentation analysis of up- and downregulated pathways for biological processes. (C and D) Violin plots of response to IFN-γ and response to type I IFN (C) and regulation of apoptotic signaling (D) modules of each cell from patient groups. Kruskal-Wallis test was used to test overall significance in module scores, p < 2.2 × 10−16. Wilcoxon test was used for pairwise comparisons, ∗∗∗∗p < 0.0001.
Figure 5
Figure 5
B Cells in Severe Group Patients Have Gene Expression Profiles Indicative of Higher IFN Signaling, Increased Apoptotic Gene Expression, and Defective Activation (A and B) Global transcriptome differences between severe and moderate (A) and severe and recovering (B) were evaluated in B cells and plasma cells by overrepresentation analysis of up- and downregulated pathways for biological processes. (C and D) Violin plots of response to IFN-γ and response to type I IFN (C) and regulation of apoptotic signaling (D) modules of each cell from patient groups. Kruskal-Wallis test was used to test overall significance in module scores, p < 2.2 × 10−16. Wilcoxon test was used for pairwise comparisons, ∗∗∗∗p < 0.0001. (E) Average expression of DEGs in the B cell activation pathway between moderate and severe and severe and recovering groups. (F) IPA causal pathway analysis demonstrates that SYK is the primary upstream mediator of the upregulated pathways in B cells from recovering versus severe groups.
Figure 6
Figure 6
Classical Monocytes in Severe Group Patients Have Decreased Gene Expression for IFN Signaling, Phagocytosis, and Antigen Presentation (A and B) Global transcriptome differences between severe and moderate (A) and severe and recovering (B) were evaluated in classical monocytes (CD14+CD16) by overrepresentation analysis of up- and downregulated pathways for biological processes. (C–E) Violin plots of response to IFN-γ and response to type I IFN (C), phagocytosis (D), and regulation of apoptotic signaling (E) modules of each cell from patient groups. Kruskal-Wallis test was used to test overall significance in module scores, p < 2.2 × 10−16. Wilcoxon test was used for pairwise comparisons, ∗∗∗∗p < 0.0001. (F) Average expression of differentially expressed human leukocyte antigen (HLA) genes by classical monocytes from patient groups.
Figure 7
Figure 7
Canonical Pathway Analysis Demonstrates Defective Signaling Programs across All Immune Cells in Severely Ill COVID-19 Patients (A) Significantly enriched pathways activated or inhibited between severe versus moderate and severe versus recovering groups in all cell types. An FDR < 0.01 was used to designate a pathway as significantly enriched, and z-score was applied to determine the activation/inhibition state of a given pathway in the severe condition. (B) Upstream regulator analysis of DEGs identified IRF7 as a putative master regulator across all cell types. Top left: the mechanistic regulatory network, with IRF7 as the key orchestrator, was constructed based on the overlap between the patterns of differential gene expression and IPA’s knowledge base across immune cell types. Top right: each member of this network is itself a key regulator of many other DEG targets in each cell type. Bottom: a heatmap summary highlighting whether each regulator is expected to be activated or inhibited for each immune cell population in severe versus moderate groups. (C) mTOR canonical pathway in severe versus recovering group. The up- (red) and downregulated (blue) nodes are based on composite information across all cell types. Some of the nodes do not represent a single DEG but potentially a family of genes (e.g., 40S ribosome). (D) Gene product interaction network analysis of the eIF2 pathway, which is downregulated in lymphocytes, but not monocytes, in the severe versus moderate group. A majority of the interactome’s nodes were differentially expressed across cell types, particularly within the densely connected network hubs shown in the center (selectively labeled in the figure and fully detailed in Table S9).

Update of

Similar articles

Cited by

References

    1. Abel A.M., Yang C., Thakar M.S., Malarkannan S. Natural Killer Cells: Development, Maturation, and Clinical Utilization. Front. Immunol. 2018;9:1869. - PMC - PubMed
    1. Acharya D., Liu G., Gack M.U. Dysregulation of type I interferon responses in COVID-19. Nat. Rev. Immunol. 2020;20:397–398. - PMC - PubMed
    1. Bermejo-Martin J.F., Cilloniz C., Mendez R., Almansa R., Gabarrus A., Ceccato A., Torres A., Menendez R., NEUMONAC group Lymphopenic Community Acquired Pneumonia (L-CAP), an Immunological Phenotype Associated with Higher Risk of Mortality. EBioMedicine. 2017;24:231–236. - PMC - PubMed
    1. Budayeva H.G., Rowland E.A., Cristea I.M. Intricate Roles of Mammalian Sirtuins in Defense against Viral Pathogens. J. Virol. 2015;90:5–8. - PMC - PubMed
    1. Cajander S., Tina E., Bäckman A., Magnuson A., Strålin K., Söderquist B., Källman J. Quantitative Real-Time Polymerase Chain Reaction Measurement of HLA-DRA Gene Expression in Whole Blood Is Highly Reproducible and Shows Changes That Reflect Dynamic Shifts in Monocyte Surface HLA-DR Expression during the Course of Sepsis. PLoS ONE. 2016;11:e0154690. - PMC - PubMed

Publication types