. 2020 Dec 22;33(12):108524.
doi: 10.1016/j.celrep.2020.108524.

Direct Measurement of Cerebrospinal Fluid Production in Mice

Affiliations

Direct Measurement of Cerebrospinal Fluid Production in Mice

Guojun Liu et al. Cell Rep. .

Abstract

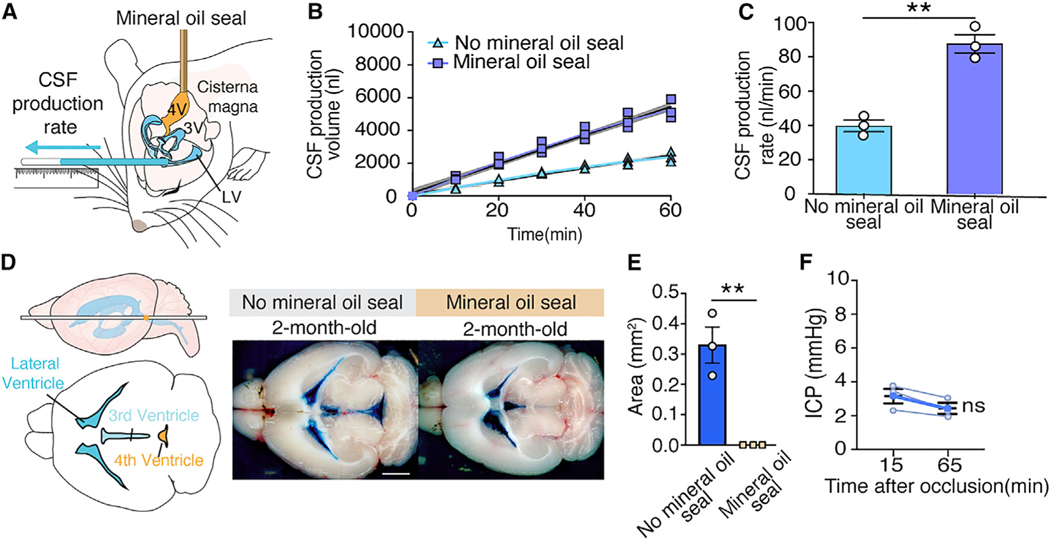
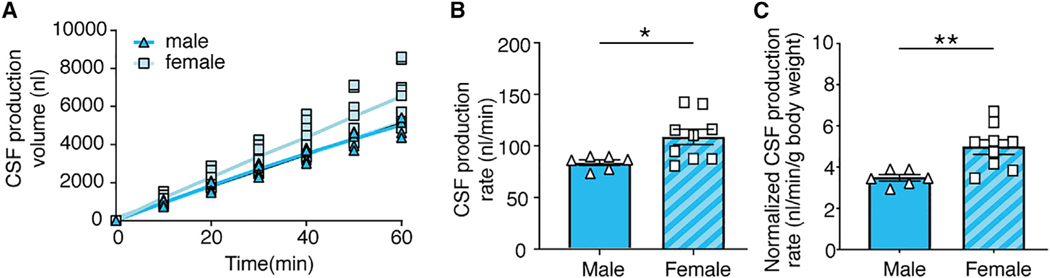
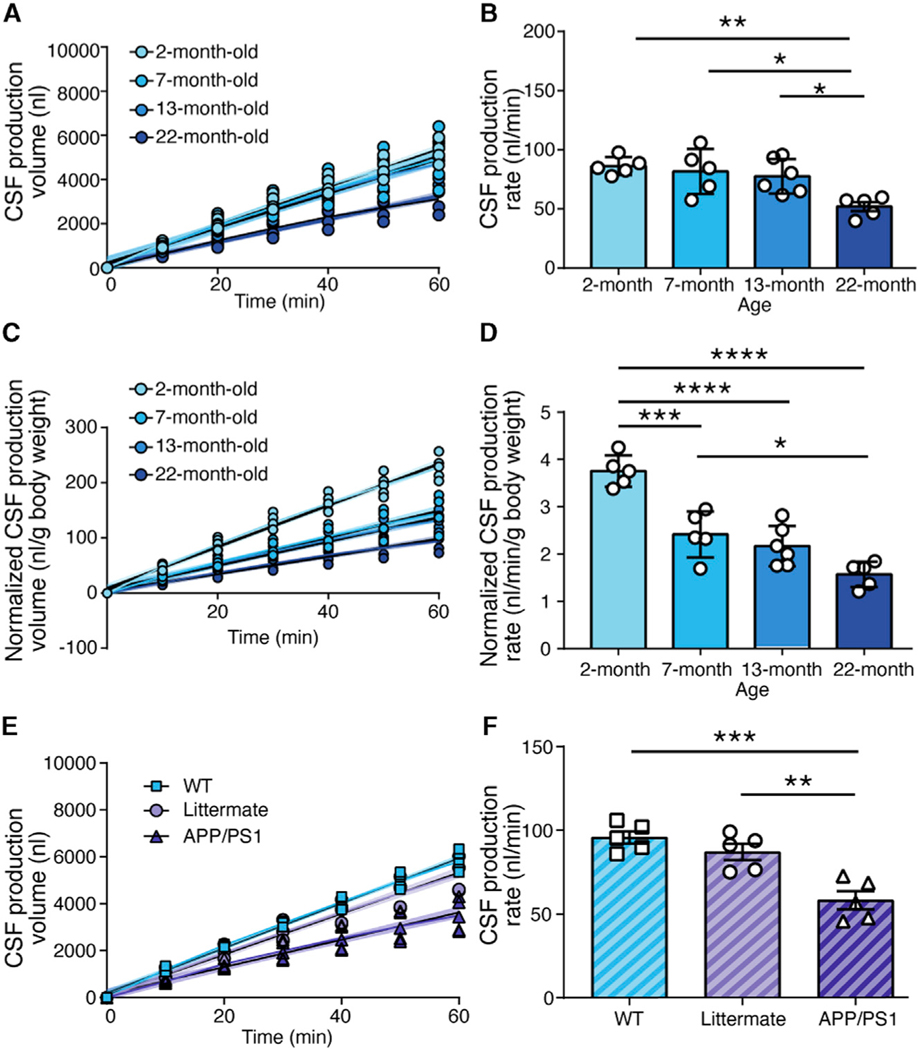
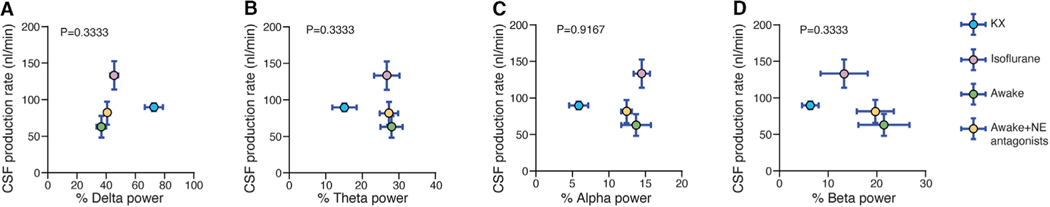
The emerging interest in brain fluid transport has prompted a need for techniques that provide an understanding of what factors regulate cerebrospinal fluid (CSF) production. Here, we describe a methodology for direct quantification of CSF production in awake mice. We measure CSF production by placing a catheter in a lateral ventricle, while physically blocking outflow from the 4th ventricle. Using this methodology, we show that CSF production increases during isoflurane anesthesia, and to a lesser extent with ketamine/xylazine anesthesia, relative to the awake state. Aged mice have reduced CSF production, which is even lower in aged mice overexpressing amyloid-β. Unexpectedly, CSF production in young female mice is 30% higher than in age-matched males. Altogether, the present observations imply that a reduction in CSF production might contribute to the age-related risk of proteinopathies but that the rate of CSF production and glymphatic fluid transport are not directly linked.

Keywords: aging; amyloid-β; glymphatic system; sex difference; sleep-wake cycle.


Conflict of interest statement

Declaration of Interests The authors declare no competing interests.

Figures

Figure 1.
Figure 1.. Assessment of the Patency of 4th Ventricular Mineral Oil Seal
(A) To measure CSF production in mice, a small burr hole was made over the right lateral ventricle (anterior-posterior [AP]: −0.10 mm, medial-lateral [ML]: 0.85 mm from bregma) in C57BL/6J male mice anesthetized with ketamine/xylazine (K/X). A 30-G needle connected to PE-10 tubing was lowered 2.00 mm through the burr hole. The atlantooccipital membrane was surgically exposed and the head rotated 90 degrees downward. A 30-G needle connected to PE-10 tubing filled with mineral oil was inserted into the 4th ventricle, and mineral oil (1 μL, 1 μL/min) was infused, thus occluding the aqueduct of Sylvius. After closure of the aqueduct of Sylvius, CSF was obliged to exit by the needle inserted in the lateral right ventricle. The position of CSF in the PE-10 tube was marked every 10 min for a total of 60 min. The cannula was not inserted in the 4th ventricle in control mice without the mineral oil seal. (B) CSF production was measured in young male mice under K/X anesthesia with and without injection of mineral oil seal in the 4th ventricle. The best fit lines from the linear regression (colored line) with 95% confidence intervals (shaded region) are plotted. The linear regression in mice without the mineral oil seal is R2 = 0.99, p < 0.0001 and in mice with the mineral oil seal is R2 = 0.99, p < 0.0001. (C) Comparison of the rates of CSF production with and without the mineral oil seal. CSF production rate is the slope from the linear regression in (B). **p < 0.01, unpaired t test. Bar graphs represent mean ± SEM. (D) To assess the efficacy of the mineral oil seal on CSF outflow, Evans blue (0.5%, 0.5 μL, 0.5 μL/min, 60-min circulation) was infused into the right lateral ventricle. The brain was harvested, and the distribution of Evans blue was documented by macroscopic imaging. Evans blue remained trapped in the lateral and the 3rd ventricles when the aqueduct of Sylvius was blocked. In contrast, when Evans blue (0.5%, 0.5 μL, 0.5 μL/min, 60-min circulation) was infused in mice with a patent aqueduct of Sylvius, Evans blue was abundantly present in the 4th ventricle (scale bar: 2 mm). (E) Comparison of Evans blue coverage area in 4th ventricle in mice with (n = 3) or without (n = 3) a mineral oil seal. **p < 0.01, unpaired t test. Bar graphs represent mean ± SEM. (F) ICP at 15 and 65 min after direct CSF production measurement in mice with mineral oil seal of the 4th ventricle. Paired t test; ns, not significant.
Figure 2.
Figure 2.. The Effect of Sex on CSF Production
(A) CSF production volume was plotted as a function of time in young male and female mice. The linear regression (colored line) was plotted with 95% confidence intervals (shaded region). Results from the linear regression in male mice are R2 = 0.998, p < 0.0001 and in female mice are R2 = 1.000, p < 0.0001. (B) Comparison of the rate of CSF production in male and female mice. CSF production rate is the slope from the linear regression in (A). *p < 0.05, unpaired t test. Bar graphs represent mean ± SEM. (C) Comparison of CSF production rate in young male and female mice normalized to body weight. **p < 0.01, unpaired t test. Bar graphs represent mean ± SEM.
Figure 3.
Figure 3.. Pan-inhibition of Noradrenergic Receptors Increases CSF Production in Awake Mice, but K/X and to a Lesser Degree Isoflurane Anesthesia Are More Effective
(A) Schematic diagram of the method used for measuring CSF production in awake mice, with and without pan-inhibition of Noradrenergic (NE) receptors. (B) CSF production was measured in awake mice after receiving a cocktail of NE receptor antagonists or vehicle. Plots of the linear regression (colored line) with 95% confidence interval (shaded region): awake mice, R2 = 0.9889, p < 0.0001; NE receptor antagonists, R2 = 0.991, p < 0.0001. (C) Comparison of the rate of CSF production in awake mice receiving a cocktail of NE receptor antagonists or vehicle. CSF production rate is the slope from the linear regression in (B). *p < 0.05, unpaired t test. Bar graphs represent mean ± SEM. (D) CSF production was measured in awake, K/X, and isoflurane-anesthetized mice. Plots of the linear regression (colored line) with 95% confidence interval (shaded region): awake, R2 = 0.850, p < 0.0001; K/X, R2 = 0.988, p < 0.0001; isoflurane, R2 = 0.953, p < 0.0001. (E) Comparison of the rate of CSF production in awake, K/X, and isoflurane groups. CSF production rate is the slope from the linear regression in (D). ****p < 0.0001, ***p < 0.001, *p < 0.05; one-way ANOVA with post hoc Tukey’s test. Bar graphs represent mean ± SEM.
Figure 4.
Figure 4.. The Effect of Age and Overexpression of Amyloid-β on CSF Production
(A) CSF production was measured in 2-, 7-, 13-, and 22-month-old K/X-anesthetized male mice. The linear regressions (colored line) and 95% confidence intervals (shaded region) are plotted for each set of data: 2-month-old mice, R2 = 0.970, p < 0.0001; 7-month-old mice, R2 = 0.886, p < 0.0001; 13-month-old mice, R2 = 0.916, p < 0.0001; 22-month-old mice, R2 = 0.915, p < 0.0001. (B) Comparison of the rate of CSF production in 2-, 7-, 13-, and 22-month-old mice. CSF production rate is the slope from the linear regression in (A). **p < 0.01, *p < 0.05; one-way ANOVA with post hoc Tukey’s test. Bar graphs represent mean ± SEM. (C) CSF production volume normalized to body weight in male mice of the four ages. The linear regression (colored line) and 95% confidence interval (shaded region) are plotted for each set of data: normalized 2-month-old mice, R2 = 0.968, p < 0.0001; normalized 7-month-old mice, R2 = 0.908, p < 0.0001; normalized 13-month-old mice, R2 = 0.911, p < 0.0001; normalized 22-month-old mice, R2 = 0.906, p < 0.0001. (D) Comparison of the normalized rate of CSF production in male mice of the four ages. Normalized CSF production rate is the slope from the linear regression in (C). ****p < 0.0001, ***p < 0.001, *p < 0.05; one-way ANOVA with post hoc Tukey’s test. Bar graphs represent mean ± SEM. (E) CSF production was measured in 6-month-old wild-type, littermate, and APP/PS1 female mice with K/X anesthesia. Linear regression (colored line) and 95% confidence intervals (shaded region) are plotted: wild-type mice, R2 = 0.986, p < 0.0001; littermate controls, R2 = 0.956, p < 0.0001; APP/PS1 mice, R2 = 0.898, p < 0.0001. (F) Comparison of the rates of CSF production in wild-type, littermate, and APP/PS1 female mice. CSF production rate is the slope from the linear regression in (E). ***p < 0.001, **p < 0.01; one-way ANOVA with post hoc Tukey’s test. Bar graphs represent mean ± SEM.
Figure 5.
Figure 5.. CSF Production Does Not Correlate with EEG Architecture
Scatterplots depicting the correlation between CSF production rate and delta (A), theta (B), alpha (C), and beta (D) power in the EEG. Comparisons were made across awake controls and awake mice with pan-inhibition of noradrenergic (NE) receptors, K/X, and isoflurane-anesthetized mice. Each dot represents the group mean (whiskers, SD). Correlations were calculated using group means; p values are displayed for each correlation (R2 = 0.64 for delta, theta, and beta power; R2 = 0.04 for alpha power). K/X, n = 5 animals for CSF production rate and n = 7 animals for EEG; isoflurane, n = 5 animals for CSF production rate and n = 8 animals for EEG; NE antagonists, n = 6 animals for CSF production rate and n = 8 animals for EEG; awake, n = 7 animals for CSF production rate, n = 8 animals for EEG.

References

    1. Andresen M, Hadi A, and Juhler M. (2016). Evaluation of Intracranial Pressure in Different Body Postures and Disease Entities. Acta Neurochir. Suppl. (Wien) 122, 45–47. - PubMed
    1. Antila S, Karaman S, Nurmi H, Airavaara M, Voutilainen MH, Mathivet T, Chilov D, Li Z, Koppinen T, Park JH, et al. (2017). Development and plasticity of meningeal lymphatic vessels. J. Exp. Med. 214, 3645–3667. - PMC - PubMed
    1. Aspelund A, Antila S, Proulx ST, Karlsen TV, Karaman S, Detmar M, Wiig H, and Alitalo K. (2015). A dural lymphatic vascular system that drains brain interstitial fluid and macromolecules. J. Exp. Med. 212, 991–999. - PMC - PubMed
    1. Balusu S, Brkic M, Libert C, and Vandenbroucke RE (2016). The choroid plexus-cerebrospinal fluid interface in Alzheimer’s disease: more than just a barrier. Neural Regen. Res. 11, 534–537. - PMC - PubMed
    1. Benveniste H, Lee H, Ding F, Sun Q, Al-Bizri E, Makaryus R, Probst S, Nedergaard M, Stein EA, and Lu H. (2017). Anesthesia with Dexmedetomidine and Low-dose Isoflurane Increases Solute Transport via the Glymphatic Pathway in Rat Brain When Compared with High-dose Isoflurane. Anesthesiology 127, 976–988. - PMC - PubMed

Publication types

LinkOut - more resources