. 2021 Jan 21;184(2):545-559.e22.
doi: 10.1016/j.cell.2020.12.021. Epub 2020 Dec 23.

Dynamic 3D proteomes reveal protein functional alterations at high resolution in situ

Affiliations

Dynamic 3D proteomes reveal protein functional alterations at high resolution in situ

Valentina Cappelletti et al. Cell. .

Abstract

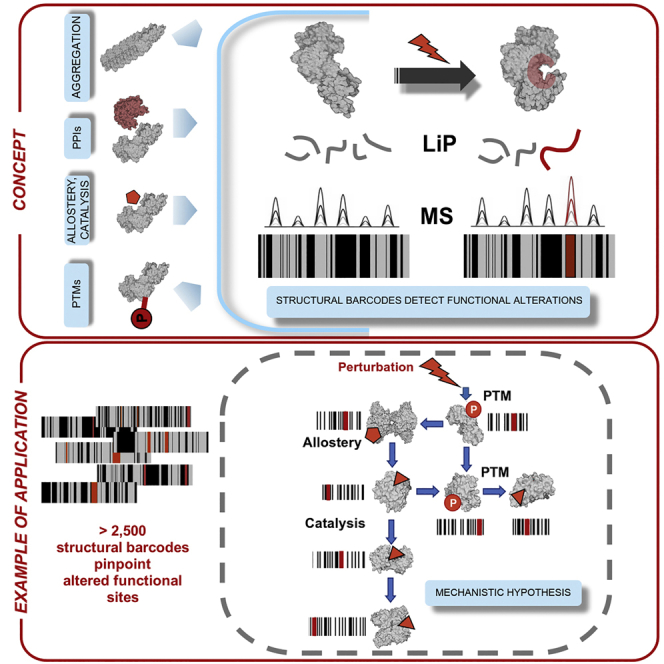
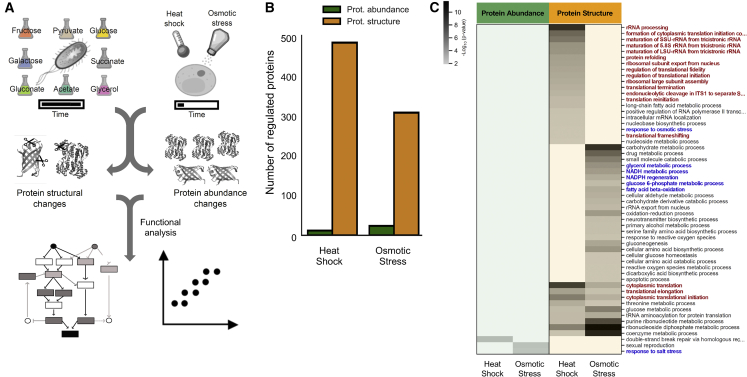
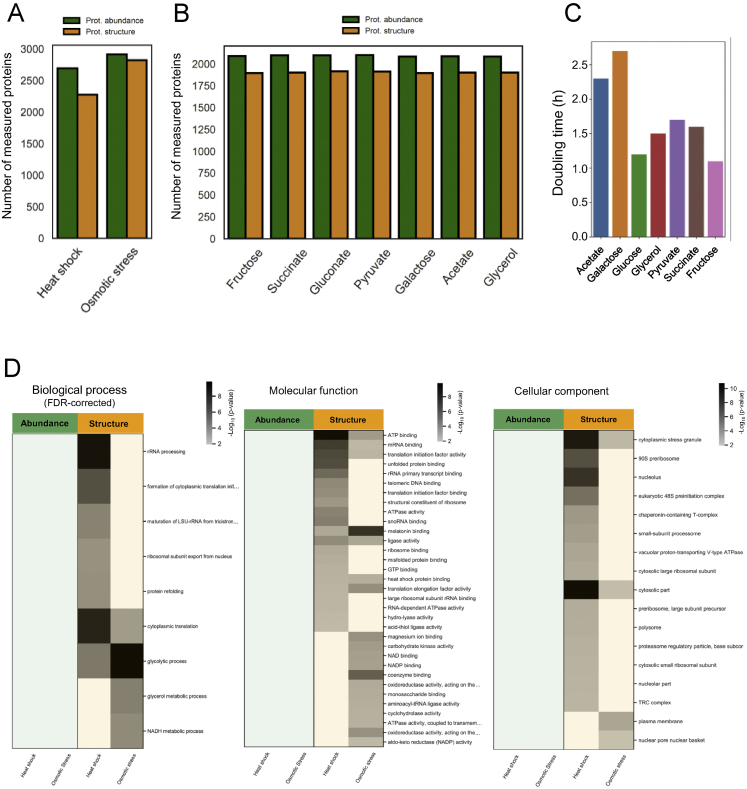
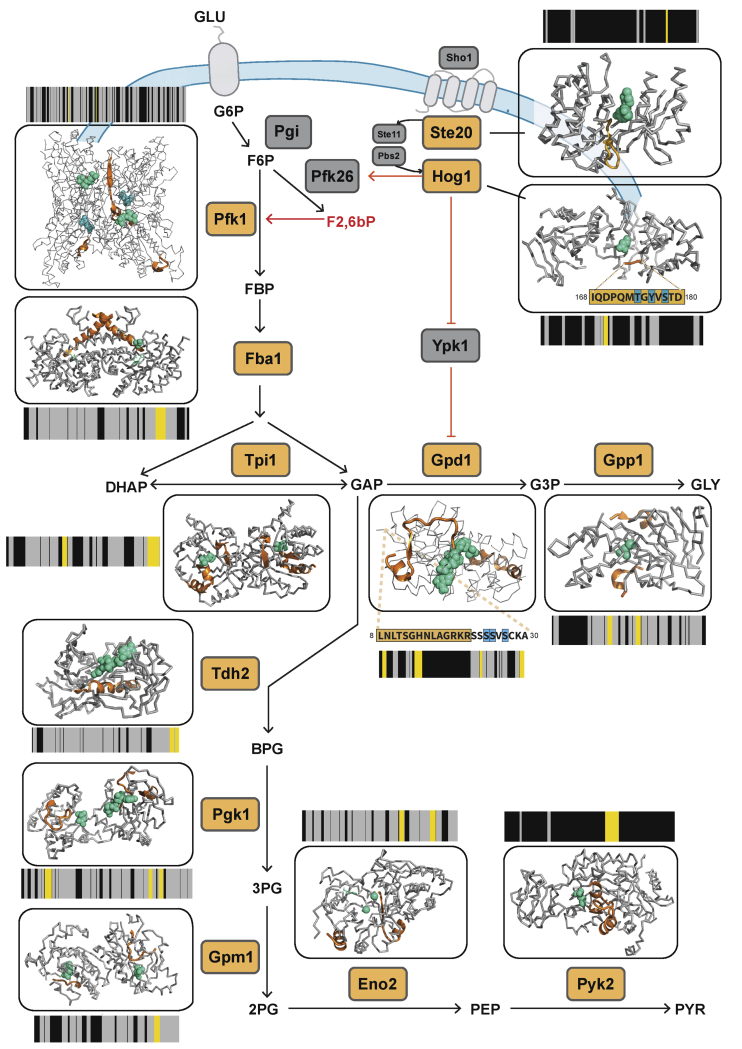
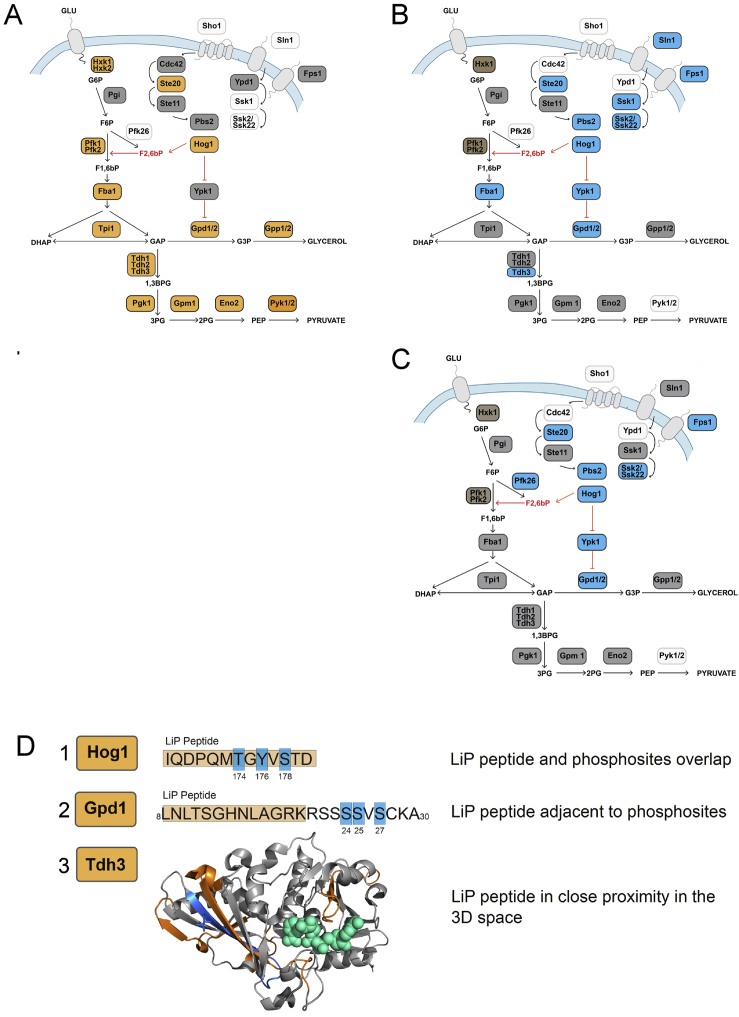
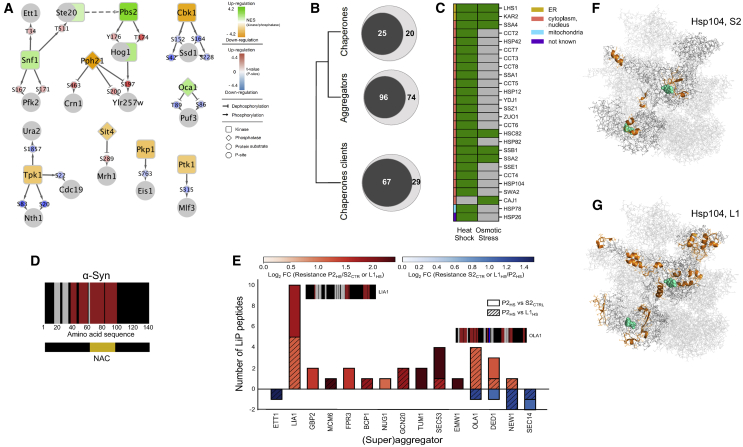
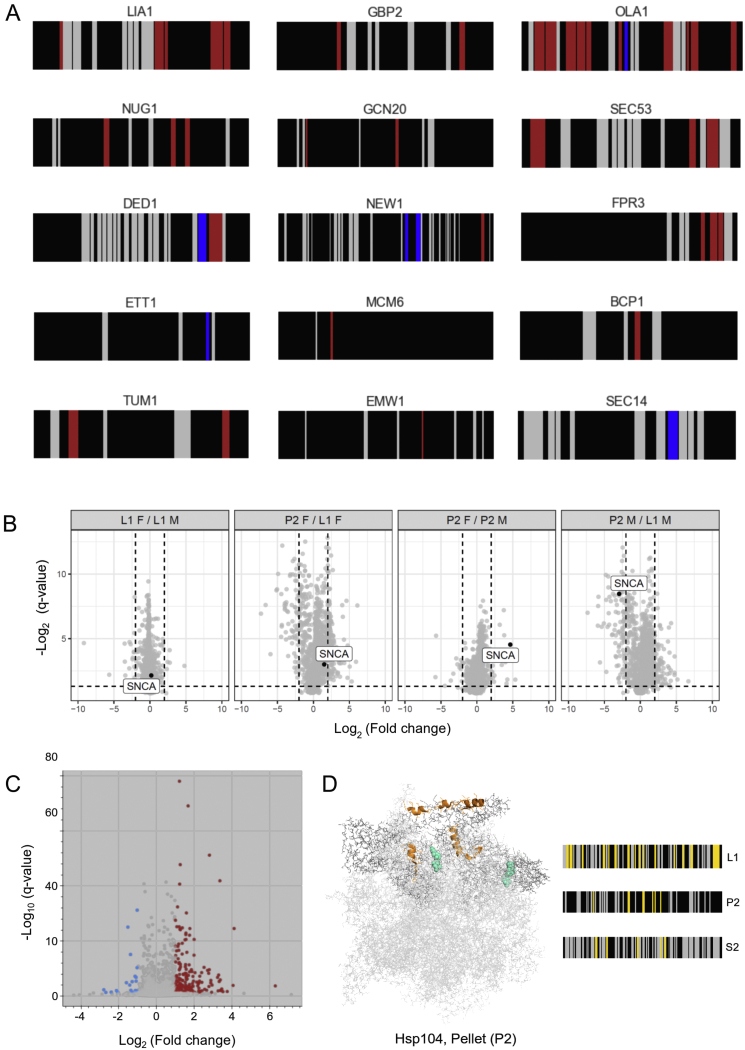
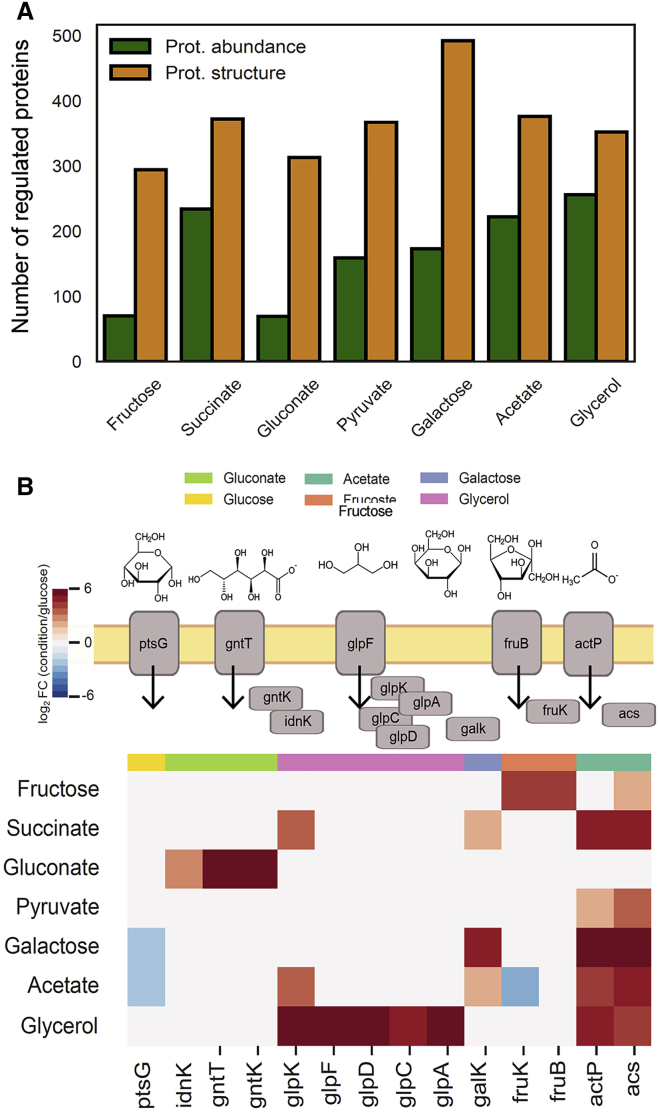
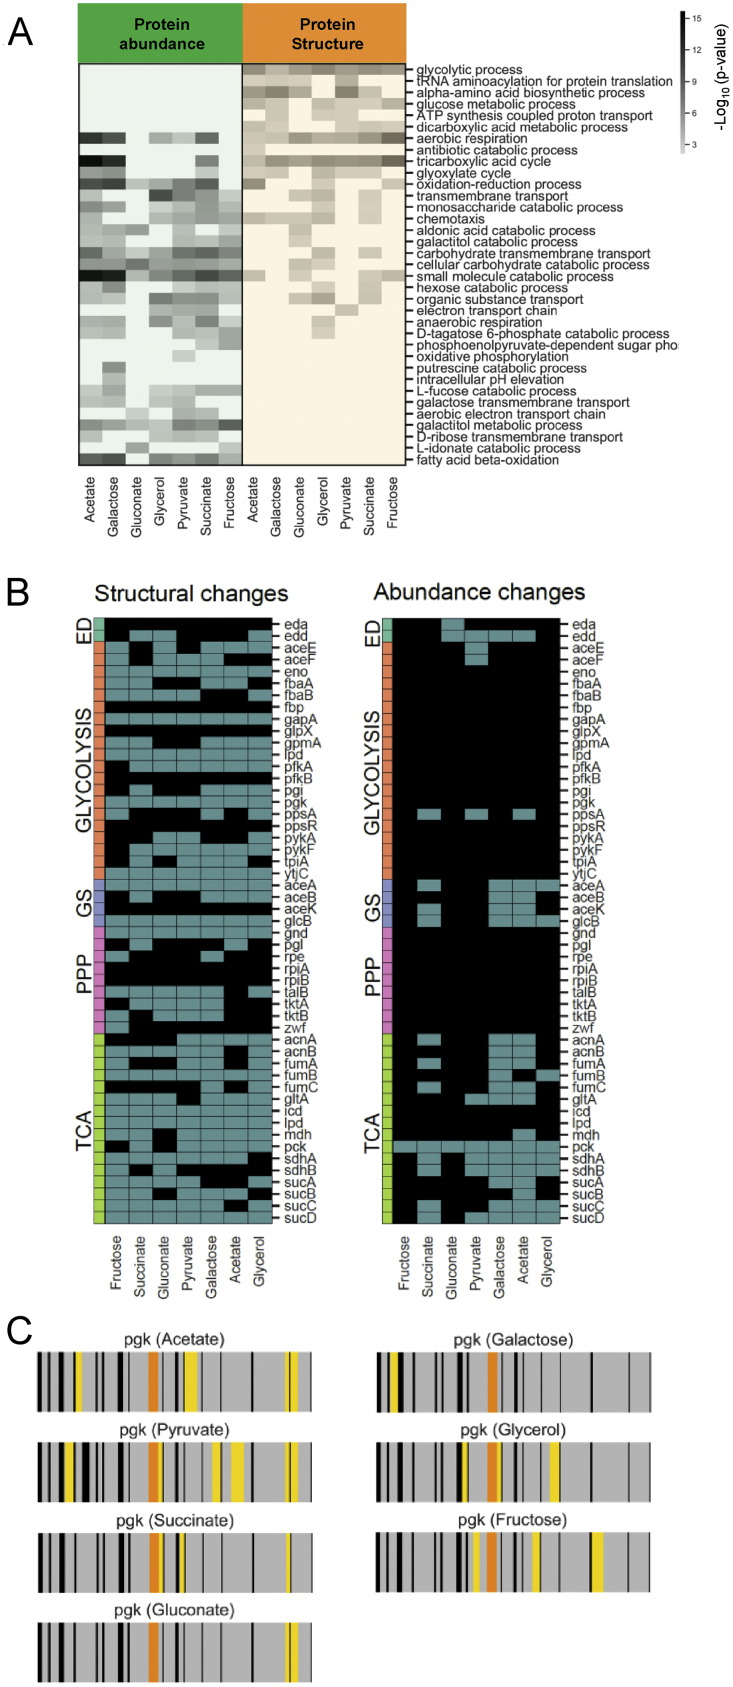
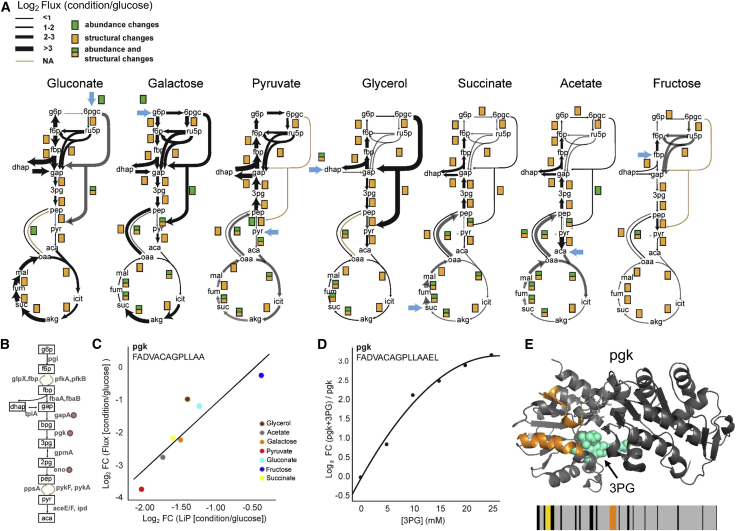
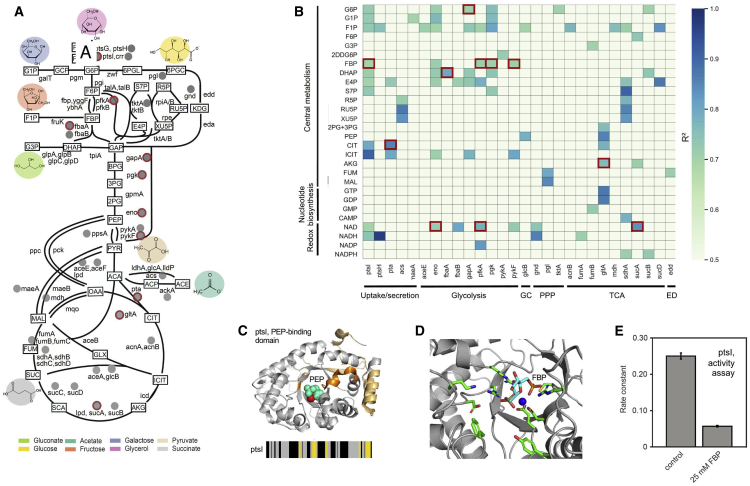
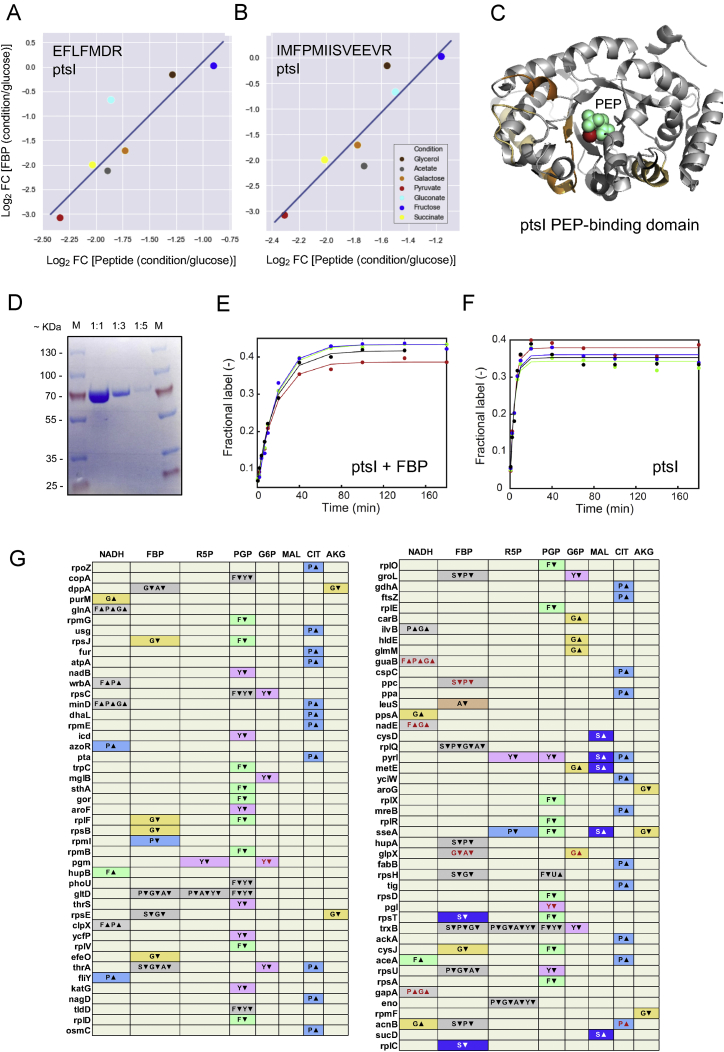
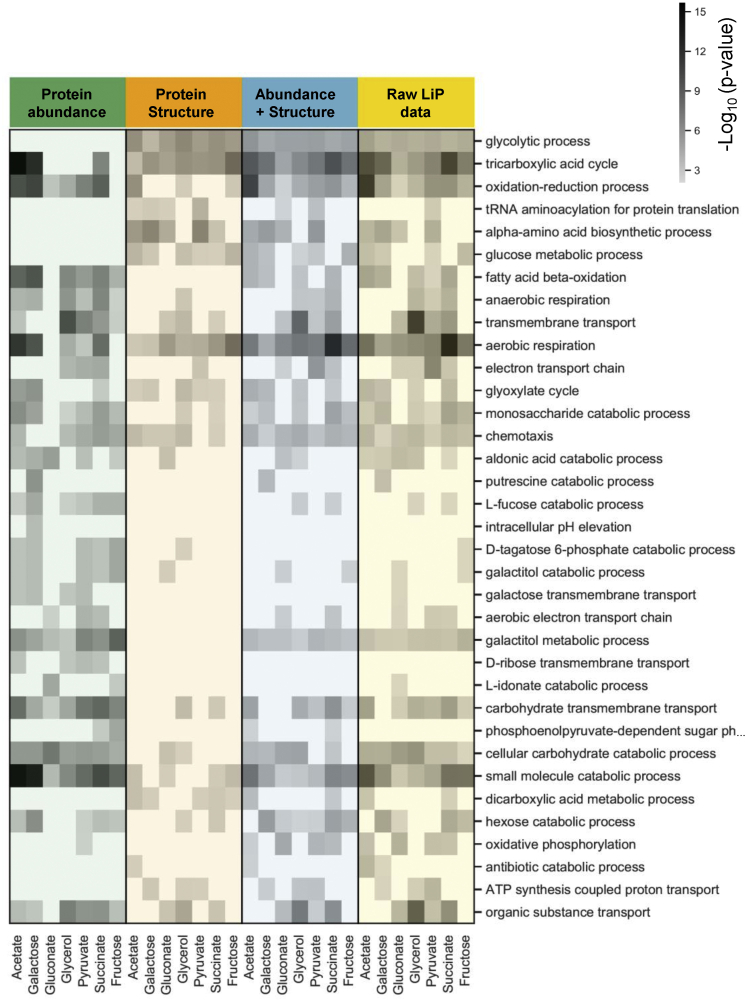
Biological processes are regulated by intermolecular interactions and chemical modifications that do not affect protein levels, thus escaping detection in classical proteomic screens. We demonstrate here that a global protein structural readout based on limited proteolysis-mass spectrometry (LiP-MS) detects many such functional alterations, simultaneously and in situ, in bacteria undergoing nutrient adaptation and in yeast responding to acute stress. The structural readout, visualized as structural barcodes, captured enzyme activity changes, phosphorylation, protein aggregation, and complex formation, with the resolution of individual regulated functional sites such as binding and active sites. Comparison with prior knowledge, including other 'omics data, showed that LiP-MS detects many known functional alterations within well-studied pathways. It suggested distinct metabolite-protein interactions and enabled identification of a fructose-1,6-bisphosphate-based regulatory mechanism of glucose uptake in E. coli. The structural readout dramatically increases classical proteomics coverage, generates mechanistic hypotheses, and paves the way for in situ structural systems biology.

Keywords: E. coli; functional proteomics; limited proteolysis; mass spectrometry; metabolism; protein aggregation; structural biology; structural proteomics; structural systems biology; yeast.


Conflict of interest statement

Declaration of interests P.P. is a scientific advisor for the company Biognosys AG (Zurich, Switzerland) and an inventor of a patent licensed by Biognosys AG that covers the LiP-MS method used in this manuscript.

Figures

None
Graphical abstract
Figure 1
Figure 1
Global protein structural and abundance changes during cellular responses in yeast and E. coli (A) The experimental systems used in this work. We studied E. coli grown on eight different nutrient sources and yeast subjected to acute heat or osmotic shock. We monitored protein abundance and structural changes with LiP-MS and assessed the functional information content of both readouts. (B) The number of proteins significantly changed (|log2FC| >1, q-value < 0.05) in abundance (green) or structure (yellow) in yeast subjected to heat shock or osmotic stress (two-sample t test with Storey method correction for multiple testing). (C) Heat map of GO biological processes enriched among significantly changed proteins in yeast subjected to heat shock or osmotic stress. p values for the enrichment (gray scale) were determined with Fisher’s exact tests. Blank cells indicate biological processes that were not enriched significantly (i.e., p value > 0.01). Red and blue indicate categories expected to be enriched under heat and osmotic shock, respectively. See also Figure S1 and Table S1.
Figure S1
Figure S1
Proteomic coverage and growth rate of bacteria in this study, and functional analysis of proteins that show structural and abundance changes during yeast response to acute stress, related to Figure 1 (A) The plot shows the number of yeast proteins detected by LC/MS-MS after digestion with trypsin only (which measures protein abundance, green bars) or upon limited proteolysis (which identifies structure-specific peptides, yellow bars), after the indicated stresses. (B) The plot shows the number of E. coli proteins detected by LC/MS-MS after digestion with trypsin only (which measures protein abundance, green bars) or upon limited proteolysis (which identifies structure-specific peptides, yellow bars) under the indicated conditions. (C) The plot shows the doubling time of E. coli in the seven different nutrient conditions used in this study. (D) The heat maps show functional categories (GO Biological Processes, Molecular Functions or Cellular Components) enriched among proteins that significantly change (|log2FC| >1, q-value < 0.05) in abundance (green) or structure (yellow) under the indicated stress conditions. P values for the enrichment (gray scale) were determined using Fisher’s exact test. Blank cells indicate molecular functions or cellular components that were not significantly enriched (i.e with p-value > 0.01) in a given condition. For the heat map showing Biological Processes, p-values were corrected for multiple hypothesis testing with the Benjamini-Hochberg method; blank cells indicate biological processes that were not significantly enriched (i.e with q-value > 0.05) in a given condition.
Figure S2
Figure S2
Tests of LiP-MS reproducibility, related to STAR Methods Correlation of replicate LiP-MS data sets in yeast responding to stress. (A-B) Reproducibility of the data set in yeast responding to osmotic stress. Correlation matrix of LiP peptide intensities between control conditions (C1-C3) and osmotic stress conditions (OS1-OS3; 10 min in 0.4M NaCl) after limited proteolysis (A) or in the trypsin-only control (B). (C-D) Reproducibility of the heat stress data set. Correlation matrix of LiP peptide intensities between control conditions (C1-C4) and heat stress conditions (HS1-HS4; 3 min at 42 degrees) after limited proteolysis (C) or in the trypsin-only control (D). The color scale indicates the Pearson correlation coefficient. (E-F) LiP-MS reproducibility across operators and replicates. LiP-MS experiments were conducted on unperturbed S. cerevisiae lysates by two different operators and in three replicates each. Shown is a principal component analysis of peptide intensities in all eight replicates, colored by operator (E). (F) The differential analysis shows the number of changing peptides between the two operators. 5 out of 16924 detected peptides change significantly (|log2FC| >1, q-value < 0.05).
Figure 2
Figure 2
Structural changes capture multiple regulatory events in yeast responding to osmotic shock A schematic of the yeast HOG-MAPK pathway and its links to glycolytic and glycerol biosynthesis pathways. Proteins undergoing significant structural alterations upon osmotic shock are indicated with orange labels (|log2FC| >1, q-value < 0.05, two-sample t test with Storey method correction for multiple testing). The barcodes represent the changes in proteolytic fingerprints from N to C terminus. Each vertical bar represents a peptide that could be detected in samples subject to LiP. Peptides that changed in intensity between conditions are indicated by yellow (|log2FC| >1, q-value < 0.05), peptides detected by MS but unchanged between conditions are in gray, and peptides not detected by MS are in black. The structural models show changed LiP peptides (orange) mapped onto the 3D protein structures of yeast protein-metabolite complexes or evolutionary conserved holo-complex structures obtained by homology modeling; metabolites positioned in allosteric or active sites are indicated in green. For Hog1 and Gpd1, phosphorylation sites are indicated in blue on protein sequences. The allosteric regulator Fructose 2, 6-bisphosphate (F2,6bP), is depicted in red. The models shown are based on available structures: Pfk1 (PDB: 3o8o), Fba1 (PDB: 3qm3), Ste20 (PDB: 4zlo), Hog1 (PDB: 5ci6), Tpi1 (PDB: 1nf0), Gpd1 (PDB: 6e9o), Gpp1 (PDB: 2qlt), Tdh2 (PDB: 3pym), Pgk1 (PDB: 1qpg), Gpm (PDB: 1qhf), Eno2 (PDB: 1ebh), and Pyk2 (PDB: 1a3x). See also Figure S3 and Table S1.
Figure S3
Figure S3
LiP-MS detects phosphorylation events in yeast responding to acute osmotic stress, related to Figure 2 (A-C): The schematics depict the yeast HOG1-MAPK pathway, including its links to the glycolysis and glycerol biosynthesis pathways. Proteins with altered structure (A) and phosphorylation (B-C) upon acute osmotic stress are shown. Depicted are: proteins with significantly altered structure (|log2FC| >1, q-value < 0.05, two-sample t-test with Storey methods correction for multiple testing) as detected by LiP-MS (A, yellow) and proteins with significantly altered phosphorylation (|log2FC| >1, q-value < 0.05; empirical Bayes moderated t-test, P values adjusted for multiple testing using the Benjamini-Hochberg method) as detected by phosphoproteomics in our data (B, blue) and as reported by (Kanshin et al., 2015) (C, blue) during acute osmotic stress. (D) Examples of significant (as in panel A) structural alterations associated with phosphorylation. For Hog1 and Gpd1, the altered LiP peptide (yellow) is overlapping or near the known phosphorylation sites (blue) in the linear sequence. For Tdh3, the LiP peptide (orange) is near the phosphorylation site (green) in 3D space.
Figure 3
Figure 3
Molecular events underlying structural changes in the yeast proteome upon osmotic and heat shock (A) Network representation of deregulated kinase activities and their target phosphosites on proteins showing structural changes upon osmotic shock of yeast cells. Structurally altered proteins are indicated by gray circles, kinases by squares, and phosphatases by diamonds; phosphorylation sites are indicated. Kinase and phosphatase activities are reported as normalized enrichment scores (NES), and phosphosite abundance changes are reported as p value-associated z-scores. (B) Venn diagrams of the numbers of proteins of the indicated categories that are significantly structurally altered (|log2FC| >1, q-value < 0.05; two-sample t test with Storey method correction for multiple testing) after heat stress (inner circle) in relation with all detected proteins in that category (outer circle). (C) Specific chaperones that show significant structural alterations (|log2FC| >1, q-value < 0.05; two-sample t test with Storey method correction for multiple testing) in heat or osmotic stress labeled by subcellular location. (D) Structural barcode indicating differences in proteolytic resistance of alpha-synuclein fibrils versus monomer. Red/blue vertical bars indicate regions that show an increase/decrease in proteolytic resistance between fibril and monomer based on peptide intensity (|log2FC| >1, q-value < 0.05; Welch modified two-sample t test, p values adjusted for multiple testing with the Benjamini-Hochberg method). Detected peptides that do not change between conditions and non-detected peptides are plotted as grey and black bars, respectively. The aggregation core (NAC) is indicated. (E) Bar plot showing protease resistance for all superaggregators and aggregators that become insoluble upon heat shock. The clear and hatched regions of the histograms show peptides indicative of increased/decreased (red/blue) proteolytic resistance for the indicated comparisons. The number of changed LiP peptides is plotted for each protein; hues indicate average strength of the fold change. Structural barcodes (as in D) are shown for selected proteins with large fold changes upon heat shock. Red/blue bars in the barcodes represent protein regions that increase/decrease proteolytic resistance in either of the two shown comparisons. (F and G) LiP peptides (orange) of Hsp104 in (F) supernatant S2 and (G) whole-cell lysate L1 that change in response to heat shock mapped to the Hsp104 hexameric structure (PDB: 6n8t). ATP molecules binding to the chaperone catalytic site are depicted in cyan. See also Figure S4 and Table S1.
Figure S4
Figure S4
LiP-MS detects multiple molecular events after yeast heat shock, related to Figure 3 (A) Structural barcodes for the 9 superaggregators or 6 aggregators detected in the insoluble fractions (P2) upon heat shock. The barcodes represent the change in proteolytic fingerprints along the sequence of each protein (N- to C-term) between conditions. Each vertical bar represents a potential LiP peptide, colored to show: peptides that increase/decrease in intensity between conditions (|log2FC| >1, q-value < 0.05) (red/blue), detected peptides that do not change between conditions (gray), and peptides that are not detected by MS (black). (B) Differential analysis of alpha-synuclein (a-syn) monomer (M) or fibril (F) upon ultracentrifugation. a-syn was spiked into yeast lysates either in monomeric or fibrillar form and the samples were ultracentrifuged to separate soluble and insoluble fractions. The whole lysate before centrifugation is referred to as L1 and the insoluble pellet after centrifugation is referred to as P2. The differential analyses compare different fractions (L1 or P2) with spiked-in monomer (M) or fibril (F) as indicated. Each dot represents a protein and a-syn is indicated (SNCA). The dotted lines indicate a log2FC of 2. We interpret the plots in the following way (left-to right): The L1F/L1M comparison shows that monomer and fibril have been spiked into the same levels in the lysate. The P2F/L1F comparison shows that a-syn fibrils are not substantially lost upon ultracentrifugation. The P2F/P2M comparison shows that the a-syn fibril is enriched in the insoluble pellet after ultracentrifugation. The P2M/L1M comparison shows that the a-syn monomer is enriched in the soluble supernatant after ultracentrifugation. (C) Differential analysis of protein abundance in the pelleted fraction of a yeast lysate in heat shocked versus control samples. Significantly upregulated (red) and downregulated (blue) peptides in heat shocked pellets are indicated (|log2FC| >1, q-value < 0.05). (D) Structural changes in the fraction of the ATPase chaperone Hsp104 that pellets upon ultracentrifugation after heat stress in yeast. LiP peptides that change during the response to heat shock (orange) are mapped to the Hsp104 structure (PDB ID: 6n8t). The hexameric structure is shown. ATP molecules binding to the chaperone catalytic site are depicted in cyan. The structural barcodes indicate changes in the proteolytic pattern of Hsp104 upon heat shock and are calculated as in Figure 3D. Each vertical bar represents a potential LiP peptide, colored to show: peptides that change in intensity upon heat shock irrespective of the direction of the change (|log2FC| >1, q-value < 0.05) (yellow), detected peptides that do not change between conditions (gray), and peptides that are not detected by MS (black). Structural barcodes are shown for Hsp104 in the P2, L1 and S2 fractions. Additional changes that appear in S2 and P2 may be due to increased coverage of the analysis once soluble and insoluble Hsp104 have been separated by centrifugation.
Figure 4
Figure 4
Global protein structural and abundance changes during nutrient adaptation in E. coli (A) Number of proteins significantly changed (|log2FC| >2, q-value < 0.05; p values adjusted for multiple testing with the Benjamini-Hochberg method) in structure (green) or abundance (yellow) under the indicated nutrient conditions in relation with glucose. (B) Schematic of the known regulators for different nutrient sources (upper). Abundance differences of known nutrient transporters and uptake regulators under the indicated nutrient conditions in relation with growth in glucose (log2FC) (lower). See also Figure S5 and Table S3.
Figure S5
Figure S5
Functional analysis of proteins that show structural and abundance changes during nutrient adaptation in E. coli, related to Figures 4 and 5 (A) The plot shows functional categories (GO biological processes) enriched among proteins significantly changing (|log2FC| >2, q-value < 0.05; P values adjusted for multiple testing using the Benjamini-Hochberg method) in abundance (green) and structure (yellow) under the indicated nutrient conditions, relative to glucose. P values for the enrichment (gray scale) were determined using Fisher’s exact test. Blank cells indicate biological processes that were not significantly enriched (i.e with p-value > 0.01) in a given condition. (B) The heat maps show which E. coli CCM proteins significantly change (blue, |log2FC| >2, q-value < 0.05; P values adjusted for multiple testing using the Benjamini-Hochberg method) in either structure (left) or abundance (right) under the indicated nutrient conditions, relative to glucose. Proteins are arranged according to the CCM pathway to which they belong. (TCA= tricarboxylic acid cycle, GS = glyoxylate shunt, PPP = pentose phosphate pathway, ED = Entner-Doudoroff pathway). (C) The barcodes represent the change in proteolytic fingerprints along the sequence of Pgk (N- to C-term), comparing growth in the indicated carbon source relative to growth in glucose. Each vertical bar represents a peptide that could be detected in samples subject to LiP. The color code indicates: peptides that change in intensity (|log2FC| >1, q-value < 0.05) between galactose and glucose, correlate with flux across all conditions, and correlate with substrate levels in an in vitro LiP experiment (orange), peptides that change in intensity between galactose and glucose but do not meet the other two conditions (yellow), peptides detected by MS but that do not change between conditions (gray), and peptides that are not detected by MS (black).
Figure 5
Figure 5
Structural changes reflect functional flux alterations of E. coli metabolic enzymes (A) 13C-based metabolic flux maps for E. coli grown in indicated nutrient conditions reported in Gerosa et al. (2015). The thickness of the black arrows indicates the flux fold change in relation to growth in glucose. Proteins with significant changes (|log2FC| >2, q-value < 0.05; p values adjusted for multiple testing with the Benjamini-Hochberg method) in abundance (green), structure (yellow), or both are indicated. (B) Schematic of glycolytic enzymes. Red circles indicate enzymes with correlations between LiP peptide levels and metabolic flux. (C) Linear regression between levels of the indicated LiP peptides derived from pgk and relative flux values through pgk across all nutrient conditions. (D) Level of the best correlating LiP peptide of recombinant pgk spiked into an E. coli lysate with increasing 3-phosphoglycerate (3PG) concentration. This peptide is almost identical to the one correlated with flux across growth conditions in vivo (in [C]). (E) The two LiP peptides that correlate with flux (orange) mapped onto the structure of pgk (PDB: 1zmr). 3PG bound to pgk is indicated in cyan. The barcode represents the change in proteolytic fingerprint along the sequence of pgk in galactose in relation to glucose (for barcodes corresponding to all growth conditions, see Figure S5C). Orange indicates peptides that change in intensity (|log2FC| >1, q-value < 0.05) between galactose and glucose, correlate with flux across all conditions, and correlate with substrate levels in an in vitro LiP experiment; yellow indicates peptides that change in intensity between galactose and glucose but do not meet the other two conditions; gray indicates peptides detected by MS that do not change between conditions; and black indicates peptides that are not detected by MS. See also Table S3.
Figure 6
Figure 6
Structural changes capture allosteric regulators of E. coli metabolic enzymes (A) Depiction of E. coli CCM showing the 32 enzymes with significant correlations between LiP peptide levels and regulatory metabolite levels (gray dots) across all growth conditions. Red outlines indicate interactions supported by previous data. Metabolites are denoted by rectangular boxes, and the points of entry of different nutrient sources are shown. (B) Correlations between levels of metabolites (rows) and CCM enzyme-derived LiP peptides (columns) in a linear regression analysis across all nutrient conditions. All metabolites with at least one significant correlation are plotted (|log2FC| >1, q-value < 0.05 in at least four conditions and for the regression analysis an adjusted p value <0.05 with R2 >0.7). The color scale indicates the correlation coefficient. (C) LiP peptides of purified ptsI with significance level |log2FC| >2, q-value < 0.01 (two-sample t test with Storey methods correction for multiple testing) mapped onto the 3D structure of ptsI (PDB: 2xz7). Peptides in dark orange are positioned within the active site (< 6.4 Å), light orange peptides are outside the active site. A close-up of the ptsI active site is shown with PEP in cyan and Mg2+ in red. The structure shown is the only one for which a 3D structure with bound PEP was available. (D) Binding mode of FBP (carbon atoms in cyan) to ptsI (gray, with carbon atoms in active-site side chains in green) as predicted by ligand docking and molecular dynamics simulations (PDB: 2xz7). A close-up of the ptsI active site is shown with FBP and the cofactor Mg2+ (blue sphere). (E) ptsI in vitro activity assay. Bar plot of the fitted rate constants of the PEP-labeling reaction, which is a measure of ptsI activity. Rates are shown as means; error bars indicate the standard deviation (n=4). See also Figure S6, Video S1, and Table S3.
Figure S6
Figure S6
Molecular events underlying structural changes in E. coli metabolic enzymes, related to Figure 6 (A-B) The plots show linear regressions between levels of the indicated LiP peptide derived from ptsI and levels of FBP, across all nutrient conditions. (C) LiP peptides that correlate with levels of fructose-bis-phosphate (FBP) in vivo (shown in A and B) are mapped (orange) onto the 3D structure of ptsI (PDB ID: 2xz7). Dark orange peptides indicate those positioned within the active site (< 6.4 Å) and light orange peptides indicate those outside the active site. A close-up of the ptsI active site is shown, with phosphoenolpyruvate (PEP) in cyan and the cofactor Mg2+ in red. The structure shown is the only one for which a 3D structure with bound PEP was available. (D-F) Controls for the ptsI activity assay. The gel (D) shows the purified protein used for the assay, in the indicated dilutions. The plots (E-F), show time-course data of the labeled fraction of phosphoenolpyruvate (PEP) in the presence (E) and absence (F) of 25 mM FBP. The colors indicate four independent assays; the solid line indicates the weighted non-linear least-squares regression using the following equation: L(t) = 0.45[1-exp(kt)] + c, where L denotes the fractional labeling of PEP, k the rate constant, t the time and c the intercept. (G) The table shows protein-metabolite interactions upon growth in each of six nutrient conditions versus growth in glucose. Proteins are shown in rows and metabolites are shown in columns. Plotted are interactions for which the metabolite showed an at least 3-fold change in any condition versus glucose (Gerosa et al., 2015) and which overlap with a dataset of interactions previous detected in vitro (Piazza et al., 2018). Colored cells indicate protein-metabolite interactions where the in vivo protein structural changes detected exactly match a previously determined in vitro structural change dependent on the same metabolite (see Methods). Gray cells indicate protein-metabolite pairs for which changes are detected in multiple conditions relative to glucose, other colors indicate condition-specific changes according to the following code: G/orange- galactose, F/green – fructose, S/dark blue – succinate, Y/pink – glycerol, A/peach – acetate, P/light blue – pyruvate. Triangles indicate whether the interaction is higher in glucose (apex down) or in the compared condition (apex up). Interactions marked in red text have been previously characterized.
Figure S7
Figure S7
LiP-MS data captures both abundance and structural changes, related to Figure 4 The plot shows functional categories (GO biological processes) enriched among proteins significantly changing (|log2FC| >2, q-value < 0.05; P values adjusted for multiple testing using the Benjamini-Hochberg method) in E. coli grown in the indicated nutrient conditions, relative to growth in glucose. Proteins showing only abundance changes, only structural changes (measured by normalizing LiP-MS data for proteins that also show abundance changes), both abundance and structure changes (consisting of the previous two categories added together) and proteins detected as changing based on the raw (i.e. non-normalized) LiP-MS data, are plotted separately. P values for the enrichment (gray scale) were determined using Fisher’s exact test. Blank cells indicate biological processes that were not significantly enriched (i.e with p-value > 0.01) in a given condition.

Comment in

References

    1. Aebersold R., Mann M. Mass spectrometry-based proteomics. Nature. 2003;422:198–207. - PubMed
    1. Aebersold R., Mann M. Mass-spectrometric exploration of proteome structure and function. Nature. 2016;537:347–355. - PubMed
    1. Alexa A., Rahnenführer J., Lengauer T. Improved scoring of functional groups from gene expression data by decorrelating GO graph structure. Bioinformatics. 2006;22:1600–1607. - PubMed
    1. Alvarez M.J., Shen Y., Giorgi F.M., Lachmann A., Ding B.B., Ye B.H., Califano A. Functional characterization of somatic mutations in cancer using network-based inference of protein activity. Nat. Genet. 2016;48:838–847. - PMC - PubMed
    1. Ardito F., Giuliani M., Perrone D., Troiano G., Lo Muzio L. The crucial role of protein phosphorylation in cell signaling and its use as targeted therapy (Review) Int. J. Mol. Med. 2017;40:271–280. - PMC - PubMed

Publication types

MeSH terms