. 2021 Jan 21;184(2):352-369.e23.
doi: 10.1016/j.cell.2020.11.042. Epub 2020 Dec 23.

FBXO44 promotes DNA replication-coupled repetitive element silencing in cancer cells

Affiliations

FBXO44 promotes DNA replication-coupled repetitive element silencing in cancer cells

Jia Z Shen et al. Cell. .

Abstract

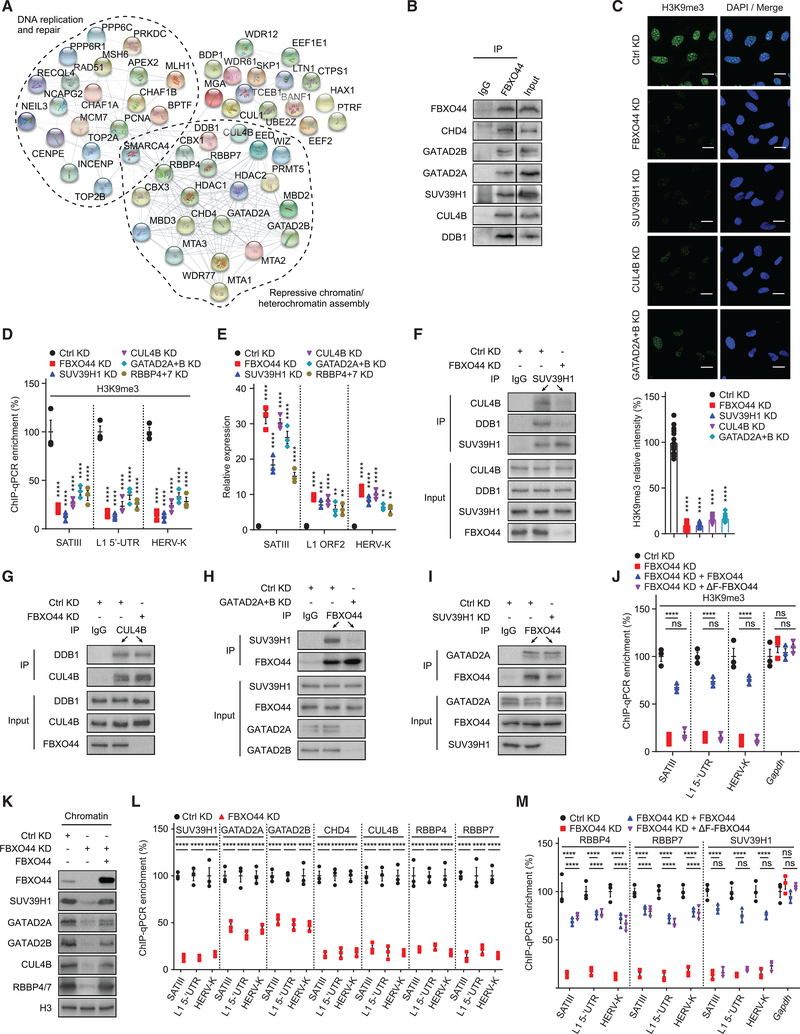
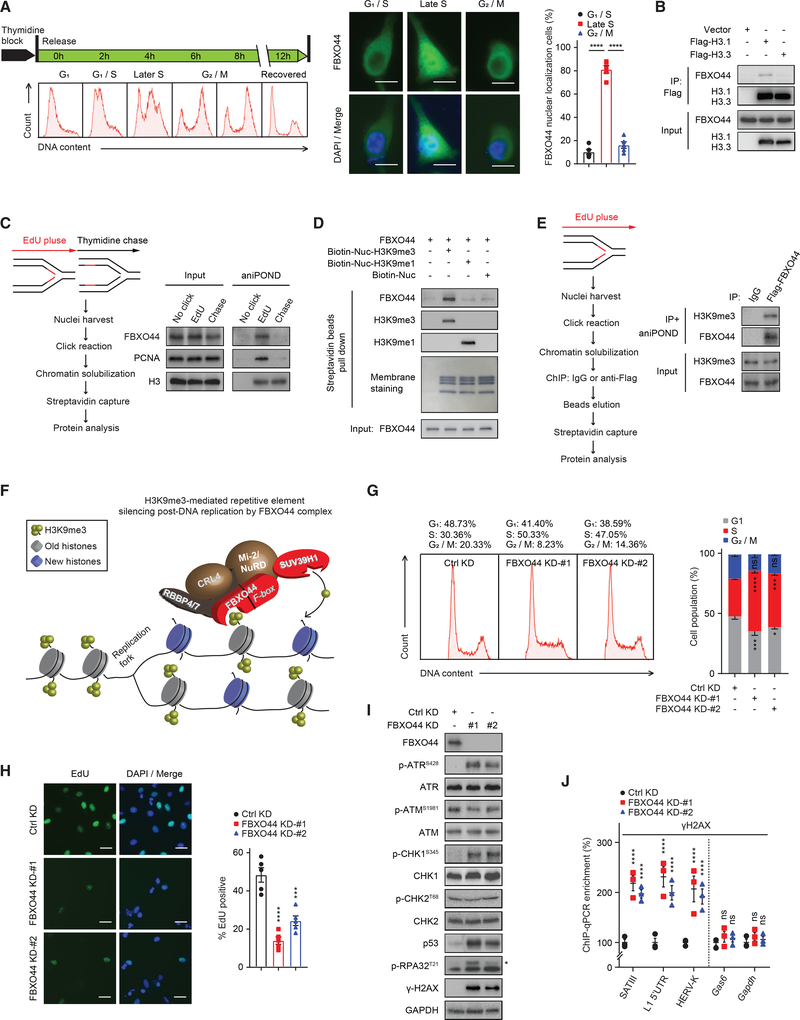
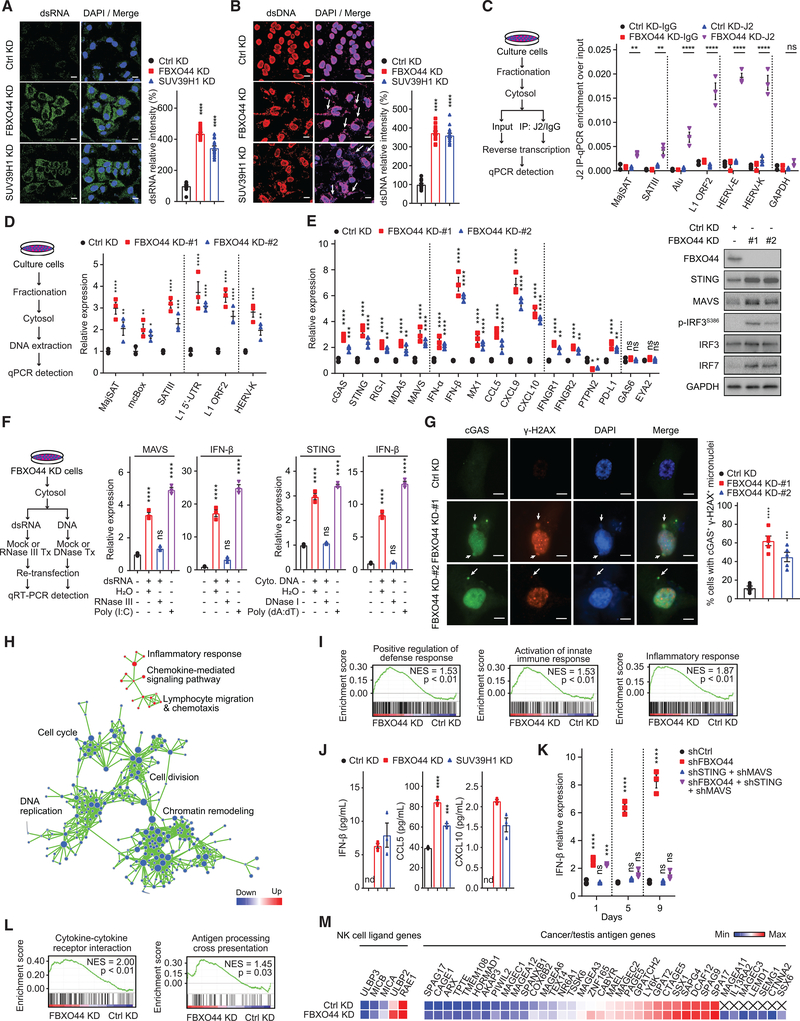
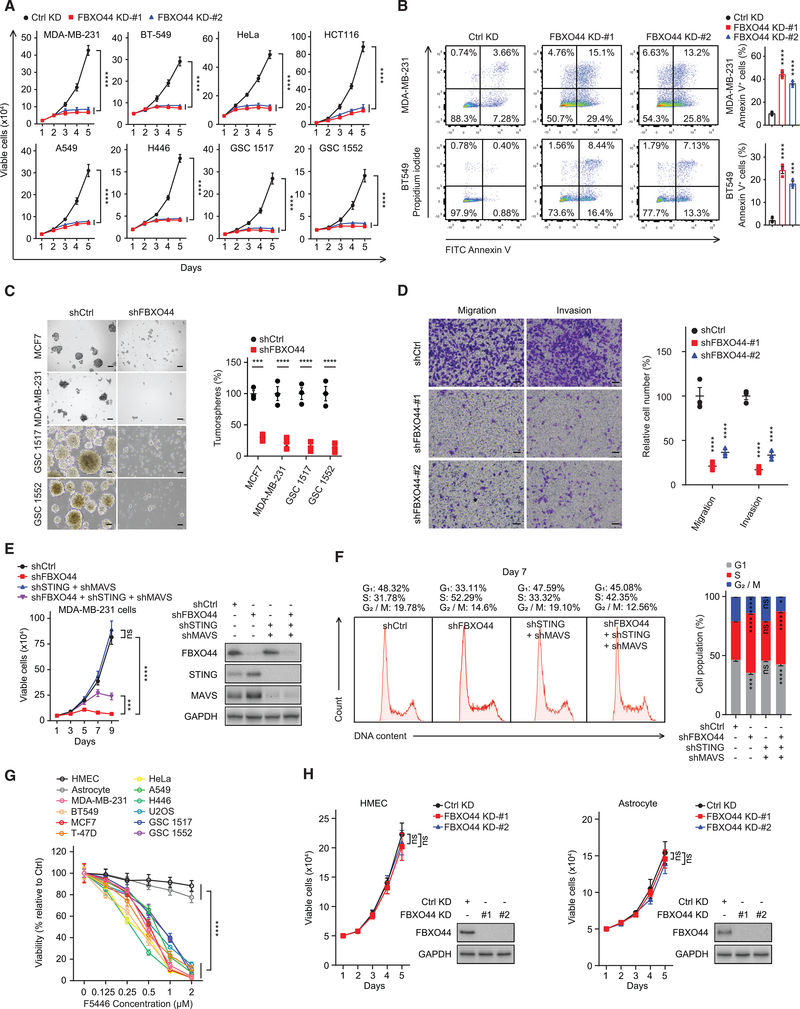
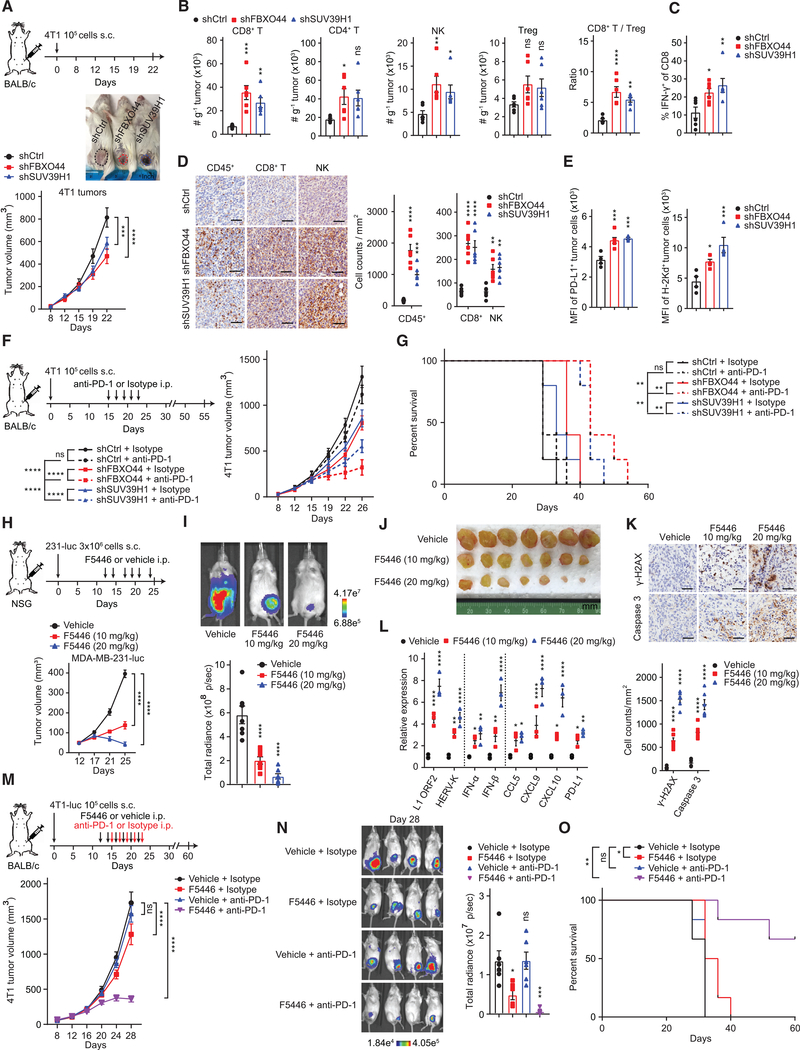
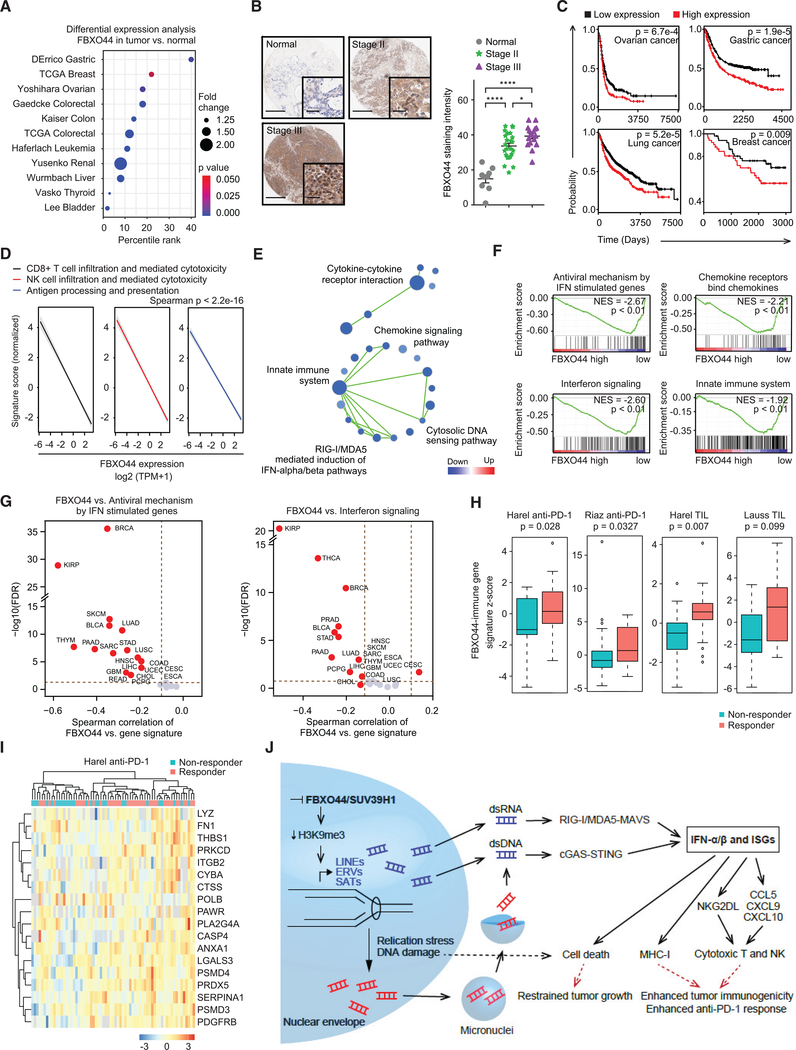
Repetitive elements (REs) compose ∼50% of the human genome and are normally transcriptionally silenced, although the mechanism has remained elusive. Through an RNAi screen, we identified FBXO44 as an essential repressor of REs in cancer cells. FBXO44 bound H3K9me3-modified nucleosomes at the replication fork and recruited SUV39H1, CRL4, and Mi-2/NuRD to transcriptionally silence REs post-DNA replication. FBXO44/SUV39H1 inhibition reactivated REs, leading to DNA replication stress and stimulation of MAVS/STING antiviral pathways and interferon (IFN) signaling in cancer cells to promote decreased tumorigenicity, increased immunogenicity, and enhanced immunotherapy response. FBXO44 expression inversely correlated with replication stress, antiviral pathways, IFN signaling, and cytotoxic T cell infiltration in human cancers, while a FBXO44-immune gene signature correlated with improved immunotherapy response in cancer patients. FBXO44/SUV39H1 were dispensable in normal cells. Collectively, FBXO44/SUV39H1 are crucial repressors of RE transcription, and their inhibition selectively induces DNA replication stress and viral mimicry in cancer cells.

Keywords: FBXO44; H3K9me3; SUV39H1; immunotherapy; repetitive elements.


Conflict of interest statement

Declaration of interests The authors declare no competing interests.

Figures

Figure 1.
Figure 1.. FBXO44 regulates H3K9me3-mediated transcriptional silencing of REs in cancer cells
(A and B) Schematic (A) and result (B) of the H3K9me3 regulator screen. (C) IF images of chromatin-associated H3K9me3 in MDA-MB-231 cells. Scale bar, 20 μm. (D) Quantification of H3K9me3 relative intensity (n = 15) (top panel) and immunoblots (bottom panel) for cells in (C). (E) Immunoblot of FBXO44 in cytoplasmic, nuclear, and chromatin fractions. (F) CoIP of endogenous FBXO44 with histone H3 in chromatin fractions. (G) Immunoblots of the indicated chromatin modifications in chromatin fractions. (H) ChIP-seq results for FBXO44 chromatin binding peaks categorized by chromosome feature. (I) RE annotation of FBXO44 chromatin binding peaks. (J) Heatmaps of FBXO44 and H3K9me3 ChIP-seq signals. (K) ChIP-seq enrichment profiles of FBXO44 and H3K9me3 peaks. (L) Venn diagram plots of ChIP-seq peaks for FBXO44 and H3K9me3, H3K27me3, and H3K4me3. (M) Visualization of FBXO44 chromatin binding sites and H3K9me3 modifications for a segment of chromosome 8 harboring satellite repeats (SAR). H3K27me3 and H3K4me3 modifications are shown. (N) ChIP analysis of FBXO44 binding to the indicated REs (n = 3). (O) ChIP analysis of H3K9me3 levels at the indicated REs (n = 3). (P) qRT-PCR analysis of the indicated REs (n = 3). Data represent mean ± SEM. ns, not significant; *p < 0.05, **p < 0.01, ***p < 0.001, ****p < 0.0001 by one-way ANOVA followed by Tukey’s multiple comparisons test (D), and two-way ANOVA followed by Tukey’s multiple comparisons test (N), Tukey’s multiple comparisons test (O), Sidak’s multiple comparisons test (P). See also Figure S1 and Tables S1, S2, and S3.
Figure 2.
Figure 2.. FBXO44 recruits SUV39H1, CRL4RBBP4/7, and Mi-2/NuRD to REs
(A) STRING network plot for interactions among FBXO44-interacting proteins. B) CoIP of endogenous FBXO44 with SUV39H1 and components of CRL4 and Mi-2/NuRD. (C) IF images of chromatin associated H3K9me3 in MDA-MB-231 cells (top panel). Scale bar, 10 μm. Quantification is shown (n = 15) (bottom panel). (D) ChIP analysis of H3K9me3 levels at indicated REs (n = 3). (E) qRT-PCR analysis of RE transcripts (n = 3). (F) CoIP of endogenous SUV39H1 with CUL4B and DDB1. (G–I) CoIP of endogenous CUL4B with DDB1 (G) and endogenous FBXO44 with SUV39H1 (H) and GATAD2A (I). (J) ChIP analysis of H3K9me3 levels at the indicated REs (n = 3). (K) Immunoblots of the indicated proteins in chromatin fractions. (L and M) ChIP analysis of binding of the indicated Flag-tagged proteins to various REs (n = 3). Data represent mean ± SEM. ns, not significant; **p < 0.01, ***p < 0.001, ****p < 0.0001 by one-way ANOVA followed by Tukey’s multiple comparisons test (C), and two-way ANOVA followed by Sidak’s multiple comparisons test (D and L), Tukey’s multiple comparisons test (E, J, and M). See also Figure S2 and Table S4.
Figure 3.
Figure 3.. FBXO44 promotes RE silencing post-DNA replication
(A) IF images of FBXO44 (middle panel) in HeLa cells synchronized at the indicated cell cycle phases (left panel). Scale bar, 10 μm. Quantification of cells with FBXO44 nuclear localization is shown (n = 5) (right panel). (B) CoIP of endogenous FBXO44 with Flag-histone H3.1 or H3.3. (C) aniPOND analysis of FBXO44 chromatin binding. Schematic of protocol (left panel) and immunoblots of FBXO44, DNA replication fork protein PCNA, and histone H3 (control) are shown (right panel). (D) In vitro binding assay using recombinant FBXO44 and H3K9me1−, H3K9me3−, or un-modified nucleosomes. (E) aniPOND analysis of FBXO44 binding to H3K9me3-modified nucleosomes. Schematic of protocol (left panel) and immunoblots are shown (right panel). (F) Model of FBXO44 regulation of H3K9me3-mediated RE silencing post-DNA replication. (G) Flow cytometry analysis of cell cycle (left panel) and quantification (n = 3) (right panel). (H) IF images of EdU incorporation in DNA of MDA-MB-231 cells (left panel) and quantification (n = 5) (right panel). Scale bar, 20 μm. (I) Immunoblots of DNA replication checkpoint and DNA damage response (DDR) proteins. *p-RPA32T21. (J) ChIP analysis of γH2AX levels at the indicated REs (n = 3). Data represent mean ± SEM. ns, not significant; *p < 0.05, ***p < 0.001, ****p < 0.0001 by one-way ANOVA followed by Tukey’s multiple comparisons test (A), Dunnett’s multiple comparisons test (H), and two-way ANOVA followed by Dunnett’s multiple comparisons test (G), Tukey’s multiple comparisons test (J). See also Figure S3.
Figure 4.
Figure 4.. FBXO44 inhibition activates RIG-I/MDA5-MAVS and cGAS-STING antiviral pathways and IFN signaling and enhances cancer cell immunogenicity
(A and B) IF images of MDA-MB-231 cells (left panels) and quantification of relative intensity (right panels) of dsRNA (A) and dsDNA (B, arrows) (n = 15). Scale bar, 10 μm. (C and D) qRT-PCR analysis of the indicated REs (n = 3) (right panels). Protocols are shown (left panels). (E) qRT-PCR analysis (n = 3) (left panel). Immunoblots of the indicated proteins (right panel). (F) qRT-PCR analysis (n = 3) (middle and right panels). Schematic of protocol (left panel). (G) IF images of cGAS and γH2AX positive micronuclei (left panel). DNA stained with DAPI. Scale bar, 5 μm. Quantification is shown (n = 5) (right panel). (H) Pathway enrichment map for significantly enriched gene sets in GSEA of FBXO44 KD RNA-seq. p < 0.01; false discovery rate (FDR) <0.1. (I) GSEA enrichment plots for selected gene sets in FBXO44 KD RNA-seq. (J) ELISA quantification of IFN-β, CCL5, and CXCL10 (n = 3). (K) qRT-PCR analysis of IFN-β (n = 3). Day is time post-KD. (L) GSEA analysis of immune-stimulatory pathways. (M) Heatmap of representative genes from RNA-seq data. Data represent mean ± SEM. ns, not significant; nd, not detected; *p < 0.05, **p < 0.01, ***p < 0.001, ****p < 0.0001 by one-way ANOVA followed by Tukey’s multiple comparisons test (A, B, and F), Dunnett’s multiple comparisons test (G), two-way ANOVA followed by Tukey’s multiple comparisons test (C and K), Dunnett’s multiple comparisons test (D), Sidak’s multiple comparisons test (E), and unpaired Student’s t test (J). See also Figure S4 and Table S5.
Figure 5.
Figure 5.. FBXO44/SUV39H1 inhibition selectively decreases cancer cell proliferation and viability in vitro
(A) Growth curves of the indicated cancer cell lines and patient-derived glioblastoma cultures (n = 3). (B) Representative flow cytometry analysis of apoptotic (annexin V+) cells (left panel). Quantification is shown (n = 3) (right panel). (C) Representative images (left panel) and quantification (right panel) of tumorspheres (n = 3) at day 14. Scale bar, 100 μm. (D) Representative images (left panel) and quantification (n = 3) (right panel) of migration and invasion analyses of MDA-MB-231 cells. Scale bar, 50 μm. (E) Growth curves (n = 3) (left panel) and immunoblots of FBXO44, MAVS, and STING (right panel). (F) Flow cytometry analysis of cell cycle (left panel) and quantification (n = 3) (right panel). (G) Viabilities of the indicated cells after treatment with F5446 for 48 h (n = 3). (H) Growth curves of HMECs and astrocytes (n = 3) (left panels) and immunoblots of the indicated proteins (right panels). Data represent mean ± SEM. ns, not significant; ***p < 0.001, ****p < 0.0001 by one-way ANOVA followed by Dunnett’s multiple comparisons test (B and D), and two-way ANOVA followed by Dunnett’s multiple comparisons test (A), Sidak’s multiple comparisons test (C), Tukey’s multiple comparisons test (E, F, G, and H). See also Figure S5.
Figure 6.
Figure 6.. FBXO44/SUV39H1 inhibition decreases tumor growth, enhances antitumor immune response, and overcomes resistance to ICB therapy
(A) Representative images of syngeneic immunocompetent mice at day 22 post-transplantation (top panel) and tumor growth curves (n = 6) (bottom panel). (B and C) Flow cytometry quantification of the indicated infiltrating immune cells in tumors in (A) (n = 6). (D) Representative IHC images of indicated infiltrating immune cells in tumors in (A) (left panel) and quantification (n = 6) (right panels). Scale bar, 50 μm. (E) Flow cytometry analysis of PD-L1 and MHC-I (H-2Kd) surface expression on 4T1 tumor cells in (A). shCtrl (n = 4), shFBXO44 (n = 6), and shSUV39H1 (n = 4). (F) Growth curves of tumors in syngeneic immunocompetent mice (n = 5). (G) Survival curves for mice in (F). (H) Growth curves of tumors in immunodeficient mice (n = 10 for days 12, 17, and 21; n = 7 for day 25). (I) Representative bioluminescent images of mice in (H) following treatment with vehicle or F5446 at day 25. (J) Images of mammary tumors dissected from mice in (H) following treatment with vehicle or F5446 at day 25. (K) Representative IHC images of tumors stained with anti-γH2AX or anti-cleaved caspase 3 antibody (top panel) and quantification (n = 6) (bottom panel). Scale bar, 50 μm. (L) qRT-PCR analysis for tumors dissected from mice in (H) (n = 3). (M) Growth curves of tumors in syngeneic immunocompetent mice (n = 6). (N) Representative bioluminescent images of tumors in (M) at day 28 (left panel) and quantification of total body radiance (n = 6) (right panel). (O) Survival curves for mice in (M). Data represent mean ± SEM. ns, not significant; *p < 0.05, **p < 0.01, ***p < 0.001, ****p < 0.0001 by one-way ANOVA followed by Dunnett’s multiple comparisons test (B, C, D [for CD45+ cells], and E), Tukey’s multiple comparisons test (N), two-way ANOVA followed by Tukey’s multiple comparisons test (A, D [for CD8+ T and NK cells], F, H, L, and M), Sidak’s multiple comparisons test (K), and log-rank test (G and O). See also Figure S6.
Figure 7.
Figure 7.. FBXO44 is associated with poor clinical outcomes in cancer patient datasets
(A) Analysis of FBXO44 expression in indicated cancer types relative to normal adjacent tissue (Oncomine, Compendia Bioscience, Ann Arbor, MI). (B) Representative IHC images (left panels) and quantification of FBXO44 expression in normal breast tissue and breast tumors (n = 8 normal, n = 24 stage II, and n = 16 stage III) (right panel). Scale bar, 0.5 mm; inset scale bar, 50 μm. (C) Survival plots for patients with FBXO44 high- versus low-expressing tumors (http://www.kmplot.com). (D) Pan-cancer analysis of TCGA dataset for FBXO44 expression with indicated gene expression signatures. (E) Pathway enrichment map for GSEA for gene sets enriched among significantly upregulated (red) or downregulated (blue) genes in FBXO44 high- versus low-expressing tumors in pan-cancer analysis of the TCGA dataset. FDR <0.1. (F) GSEA analysis of various immune-stimulatory pathways in FBXO44 high- versus low-expressing tumors in pan-cancer analysis of the TCGA dataset. (G) Correlation analysis between FBXO44 expression level and z-scores of the indicated gene sets in different cancer types from the TCGA dataset. (H) Boxplots of FBXO44-immune gene signature Z scores in non-responder and responder groups of patients with anti-PD-1 or TIL therapy in the indicated datasets. (I) Heatmap of the FBXO44-immune gene signature differentially enriched in responder versus non-responder patients in Harel anti-PD-1 therapy dataset. (J) Model of FBXO44/SUV39H1 inhibition-induced antitumor effects and enhancement of immunotherapy response. Data represent mean ± SEM. *p < 0.05, ****p < 0.0001 by two-way ANOVA followed by Tukey’s multiple comparisons test (B) and unpaired Student’s t test (H). See also Figure S7 and Tables S6 and S7.

Comment in

References

    1. Abbas T, and Dutta A (2011). CRL4Cdt2: master coordinator of cell cycle progression and genome stability. Cell Cycle 10, 241–249. - PMC - PubMed
    1. Alabert C, Bukowski-Wills JC, Lee SB, Kustatscher G, Nakamura K, de Lima Alves F, Menard P, Mejlvang J, Rappsilber J, and Groth A (2014). Nascent chromatin capture proteomics determines chromatin dynamics during DNA replication and identifies unknown fork components. Nat. Cell Biol 16, 281–293. - PMC - PubMed
    1. Alabert C, Barth TK, Reveron-Gomez N, Sidoli S, Schmidt A, Jensen ON, Imhof A, and Groth A (2015). Two distinct modes for propagation of histone PTMs across the cell cycle. Genes Dev. 29, 585–590. - PMC - PubMed
    1. Allshire RC, and Madhani HD (2018). Ten principles of heterochromatin formation and function. Nat. Rev. Mol. Cell Biol 19, 229–244. - PMC - PubMed
    1. Anwar SL, Wulaningsih W, and Lehmann U (2017). Transposable Elements in Human Cancer: Causes and Consequences of Deregulation. Int. J. Mol. Sci 18, e974. - PMC - PubMed

Publication types

MeSH terms