

Health and economic impact of air pollution in the states of India: the Global Burden of Disease Study 2019
- PMID: 33357500
- PMCID: PMC7805008
- DOI: 10.1016/S2542-5196(20)30298-9
Health and economic impact of air pollution in the states of India: the Global Burden of Disease Study 2019
Abstract
Background: The association of air pollution with multiple adverse health outcomes is becoming well established, but its negative economic impact is less well appreciated. It is important to elucidate this impact for the states of India.
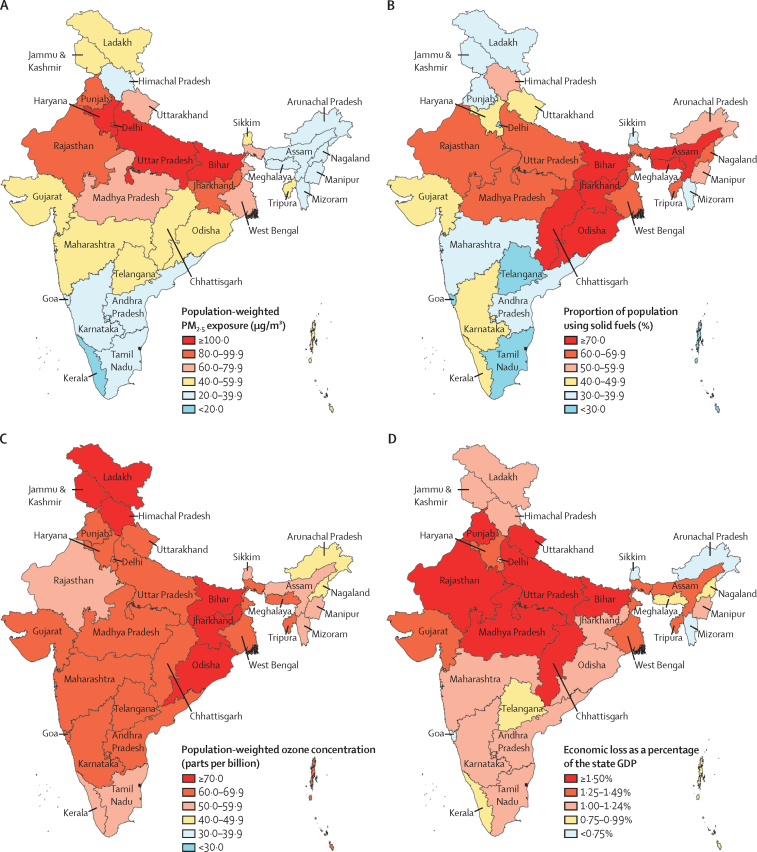
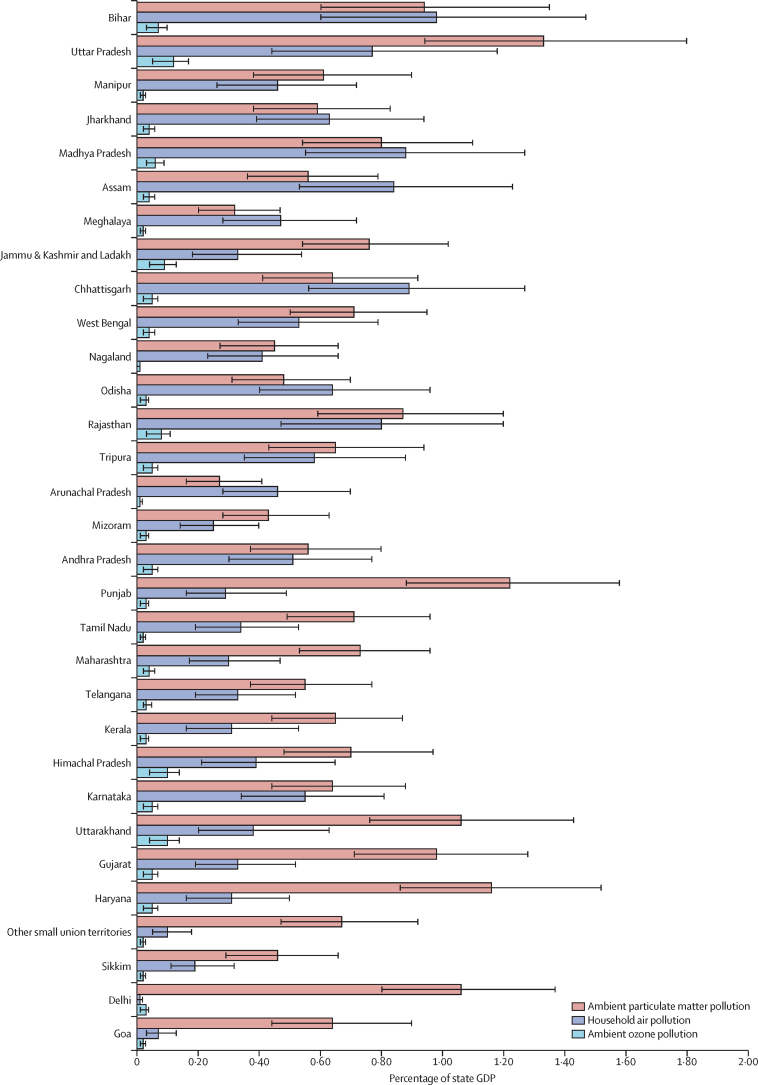
Methods: We estimated exposure to ambient particulate matter pollution, household air pollution, and ambient ozone pollution, and their attributable deaths and disability-adjusted life-years in every state of India as part of the Global Burden of Disease Study (GBD) 2019. We estimated the economic impact of air pollution as the cost of lost output due to premature deaths and morbidity attributable to air pollution for every state of India, using the cost-of-illness method.
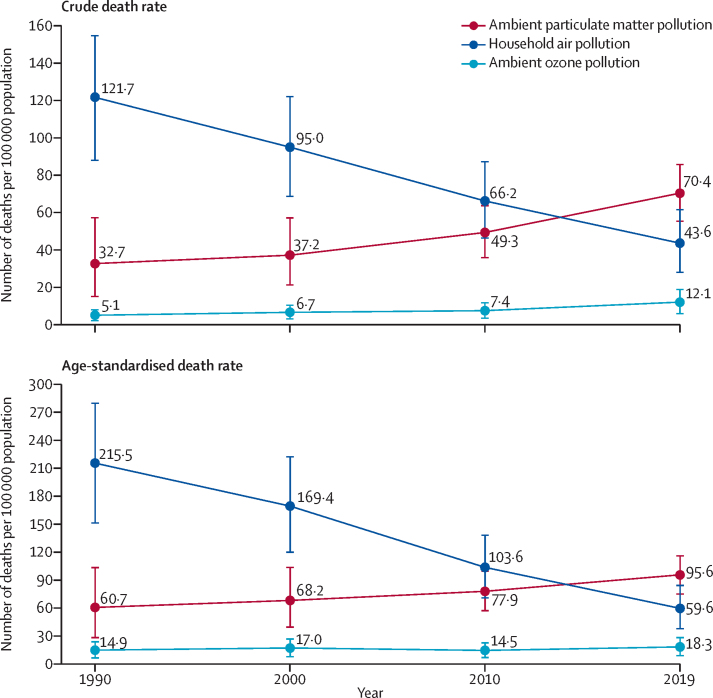
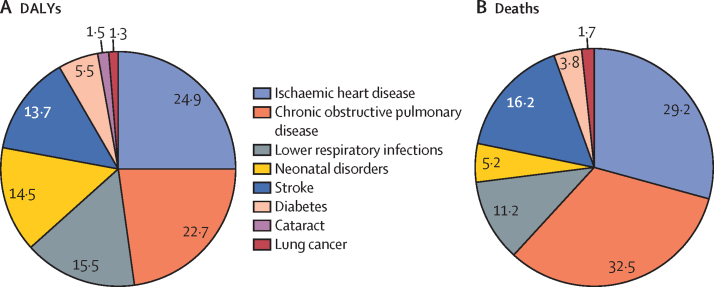
Findings: 1·67 million (95% uncertainty interval 1·42-1·92) deaths were attributable to air pollution in India in 2019, accounting for 17·8% (15·8-19·5) of the total deaths in the country. The majority of these deaths were from ambient particulate matter pollution (0·98 million [0·77-1·19]) and household air pollution (0·61 million [0·39-0·86]). The death rate due to household air pollution decreased by 64·2% (52·2-74·2) from 1990 to 2019, while that due to ambient particulate matter pollution increased by 115·3% (28·3-344·4) and that due to ambient ozone pollution increased by 139·2% (96·5-195·8). Lost output from premature deaths and morbidity attributable to air pollution accounted for economic losses of US$28·8 billion (21·4-37·4) and $8·0 billion (5·9-10·3), respectively, in India in 2019. This total loss of $36·8 billion (27·4-47·7) was 1·36% of India's gross domestic product (GDP). The economic loss as a proportion of the state GDP varied 3·2 times between the states, ranging from 0·67% (0·47-0·91) to 2·15% (1·60-2·77), and was highest in the low per-capita GDP states of Uttar Pradesh, Bihar, Rajasthan, Madhya Pradesh, and Chhattisgarh. Delhi had the highest per-capita economic loss due to air pollution, followed by Haryana in 2019, with 5·4 times variation across all states.
Interpretation: The high burden of death and disease due to air pollution and its associated substantial adverse economic impact from loss of output could impede India's aspiration to be a $5 trillion economy by 2024. Successful reduction of air pollution in India through state-specific strategies would lead to substantial benefits for both the health of the population and the economy.
Funding: UN Environment Programme; Bill & Melinda Gates Foundation; and Indian Council of Medical Research, Department of Health Research, Ministry of Health and Family Welfare, Government of India.
Copyright © 2021 The Author(s). Published by Elsevier Ltd. This is an Open Access article under the CC BY 4.0 license. Published by Elsevier Ltd.. All rights reserved.
Figures
Comment in
-
India's air pollution: the need for city-centric plans and regulations.Lancet Planet Health. 2021 Apr;5(4):e185. doi: 10.1016/S2542-5196(21)00032-2. Lancet Planet Health. 2021. PMID: 33838730 No abstract available.
-
Mitigating agriculture's contribution to air pollution in India.Lancet Planet Health. 2021 Apr;5(4):e186. doi: 10.1016/S2542-5196(21)00029-2. Lancet Planet Health. 2021. PMID: 33838731 No abstract available.
-
Urgent need for planetary health education for healthcare professionals and students in India.Indian J Med Ethics. 2024 Apr-Jun;IX(2):127-130. doi: 10.20529/IJME.2023.075. Indian J Med Ethics. 2024. PMID: 38755775
References
-
- Lelieveld J, Evans JS, Fnais M, Giannadaki D, Pozzer A. The contribution of outdoor air pollution sources to premature mortality on a global scale. Nature. 2015;525:367–371. - PubMed
-
- Landrigan PJ, Fuller R, Acosta NJR. The Lancet Commission on pollution and health. Lancet. 2018;391:462–512. - PubMed
-
- WHO Air pollution. https://www.who.int/health-topics/air-pollution#tab=tab_1
Publication types
MeSH terms
Substances
LinkOut - more resources
Full Text Sources
Other Literature Sources
Medical
