. 2020 Dec;6(14):1827-1840.
doi: 10.1016/j.jacep.2020.09.012. Epub 2020 Nov 25.

Evidence of Superior and Inferior Sinoatrial Nodes in the Mammalian Heart

Affiliations

Evidence of Superior and Inferior Sinoatrial Nodes in the Mammalian Heart

Jaclyn A Brennan et al. JACC Clin Electrophysiol. 2020 Dec.

Abstract

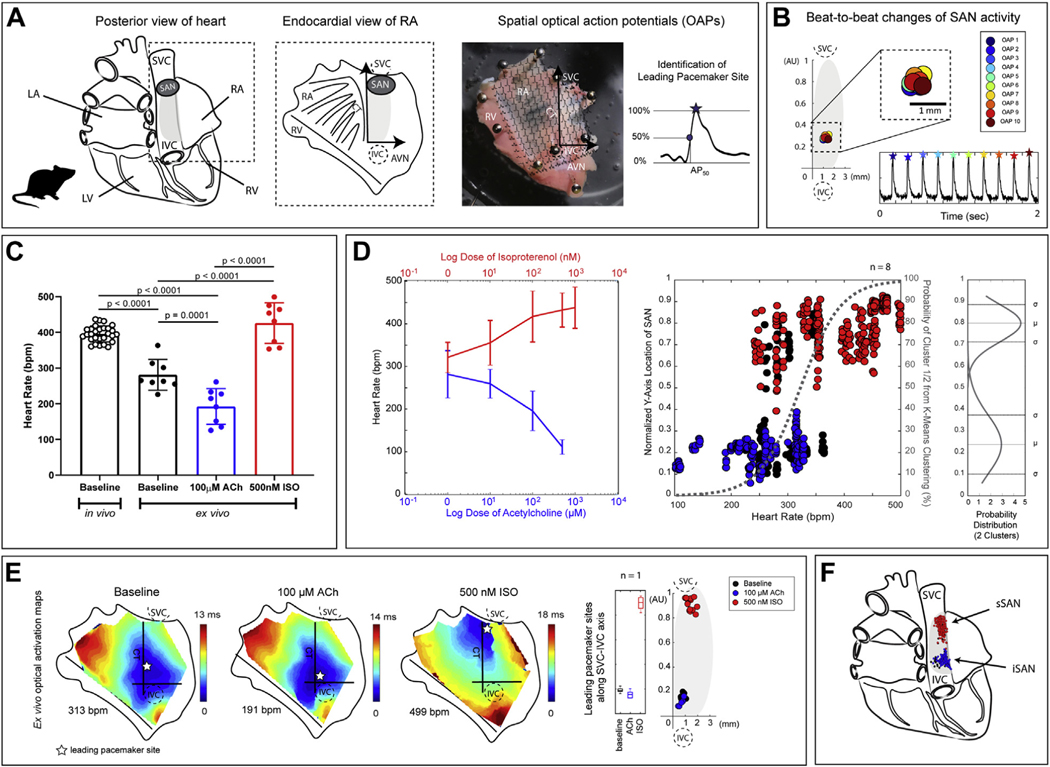
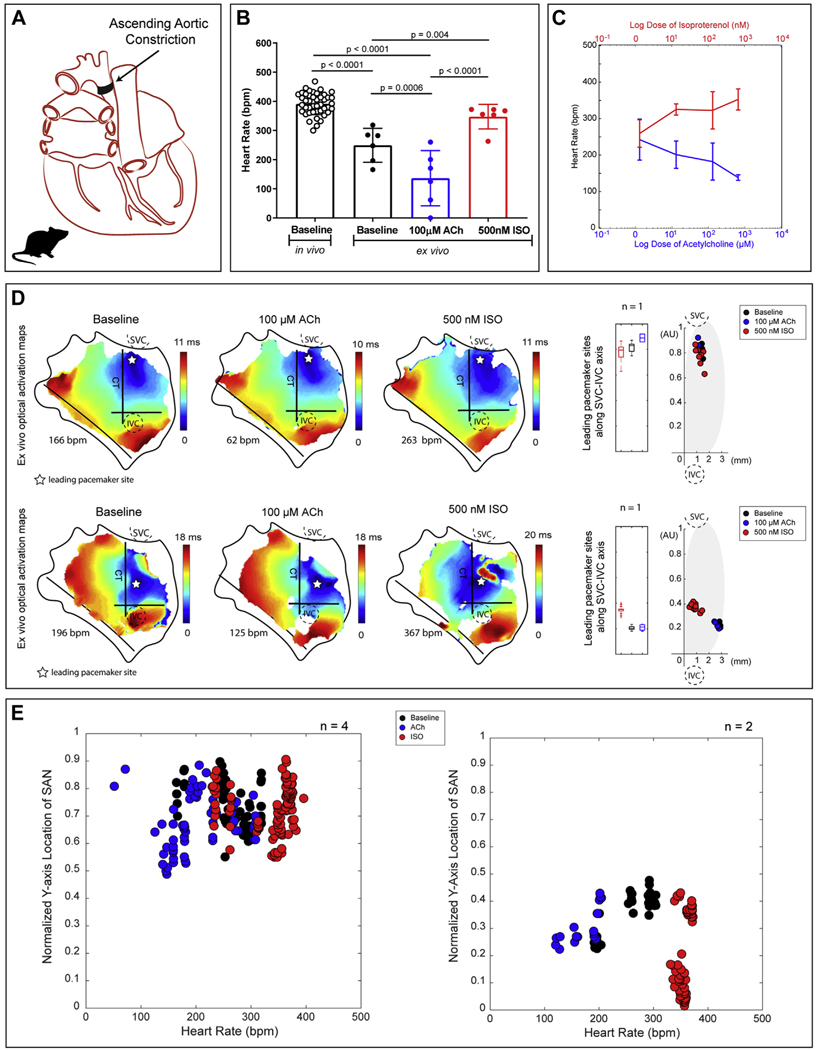
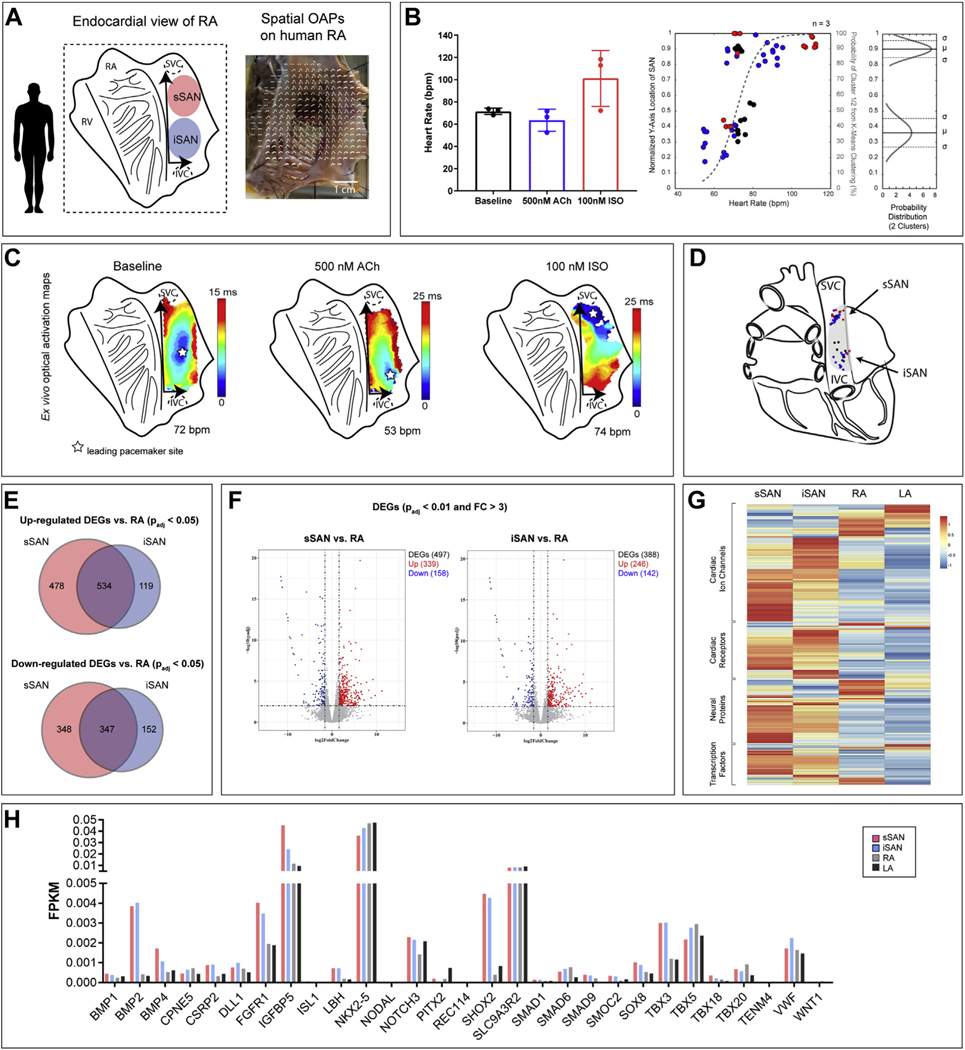
Objectives: This study sought to investigate the shift of leading pacemaker locations in healthy and failing mammalian hearts over the entire range of physiological heart rates (HRs), and to molecularly characterize spatial regions of spontaneous activity.

Background: A normal heartbeat originates as an action potential in a group of pacemaker cells known as the sinoatrial node (SAN), located near the superior vena cava. HRs and the anatomical site of origin of pacemaker activity in the adult heart are known to dynamically change in response to various physiological inputs, yet the mechanism of this pacemaker shift is not well understood.

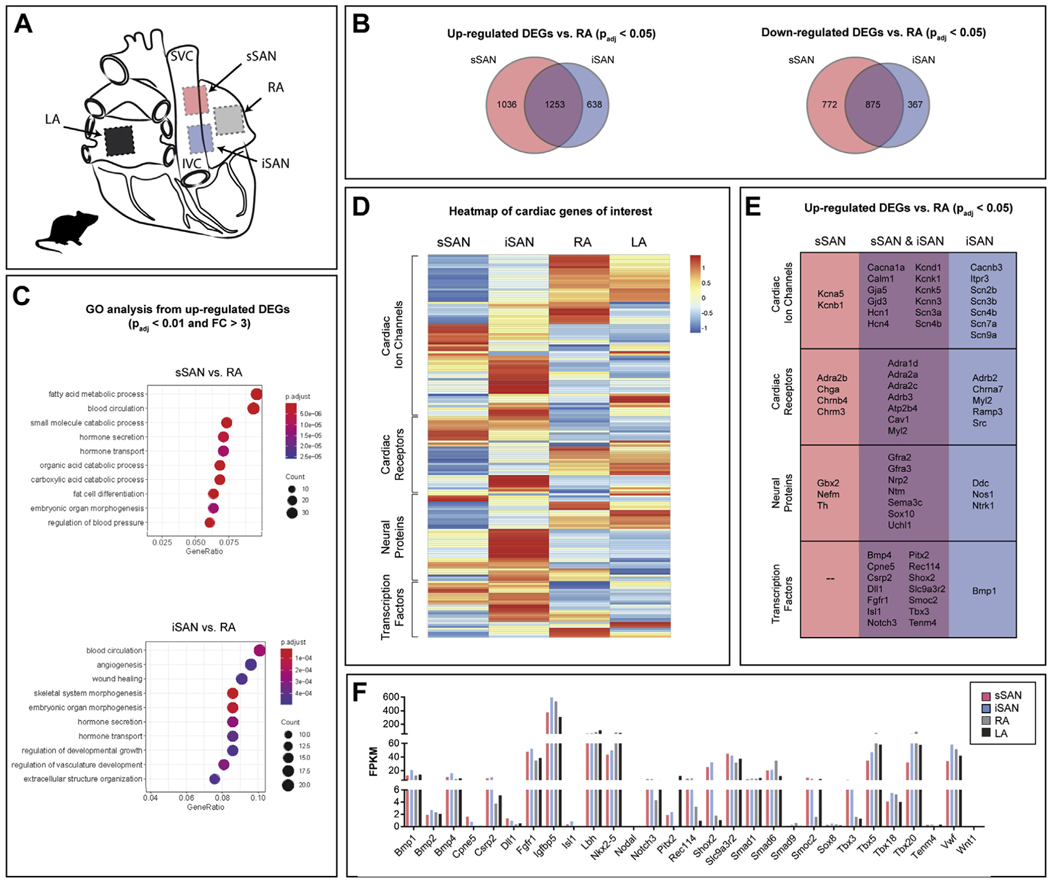
Methods: Optical mapping was applied to ex vivo rat and human isolated right atrial tissues, and HRs were modulated with acetylcholine and isoproterenol. RNA sequencing was performed on tissue areas that elicited spontaneous activity, and comparisons were made to neighboring myocardial tissues.

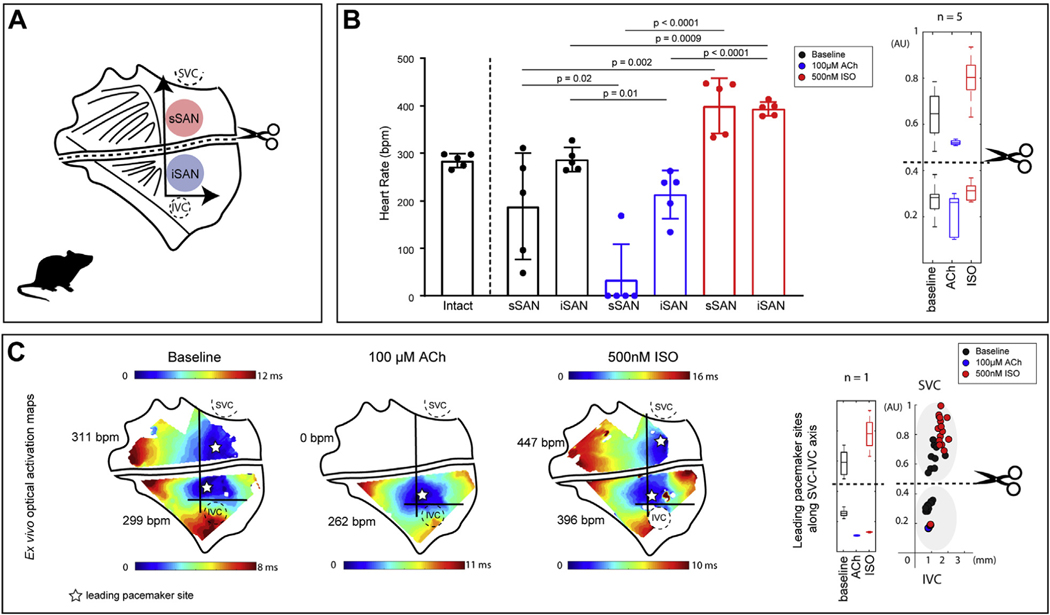
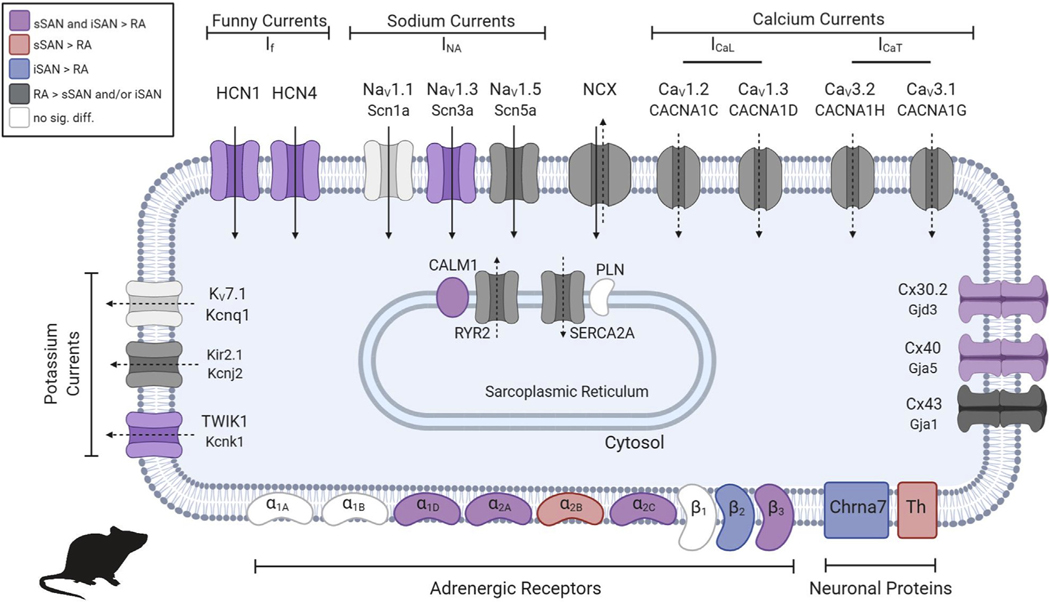
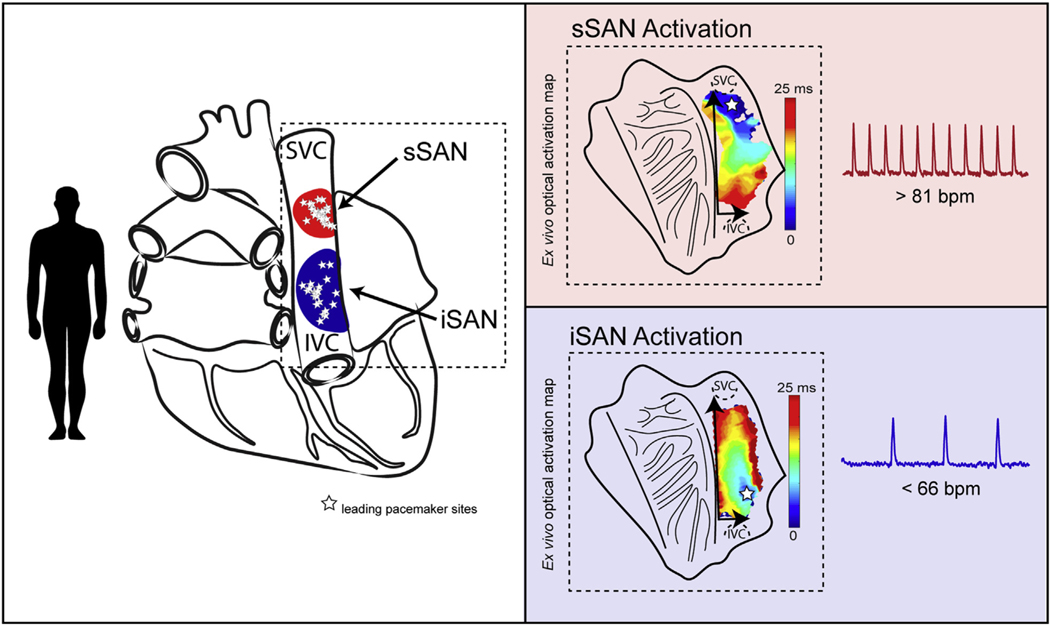
Results: Functional and molecular evidence identified and confirmed the presence of 2 competing right atrial pacemakers localized near the superior vena cava and the inferior vena cava-the superior SAN (sSAN) and inferior SAN (iSAN), respectively-which preferentially control the fast and slow HRs. Both of these regions were evident in non-failing rat and human hearts and maintained spontaneous activity in the rat heart when physically separated from one another. Molecular analysis of these 2 pacemaker regions revealed unique but similar transcriptional profiles, suggesting iSAN dominance when the sSAN is silent.

Conclusions: The presence of 2 spatially distinct dominant pacemakers, sSAN and iSAN, in the mammalian heart clarifies previous identification of migrating pacemakers and corresponding changes in P-wave morphology in mammalian species.

Keywords: arrhythmias; optical mapping; pacemaker; sinoatrial node.


Conflict of interest statement

Author Disclosures Drs. Brennan and Efimov were supported by National Institutes of Health Stimulating Peripheral Activity to Relieve Conditions (SPARC) grant 3OT2OD023848. Drs. Chen and Peng were supported by National Institutes of Health grants AI121080 and AI139874. All other authors have reported that they have no relationships relevant to the contents of this paper to disclose.

Figures

FIGURE 1
FIGURE 1. Functional Evidence of sSAN and iSAN in the Isolated Ex Vivo Rat Heart
(A) (Left) Schematic of the posterior view of the rat heart with the “textbook” location of the sinoatrial node (SAN) located at the junction of the superior vena cava (SVC) and right atria (RA). (Middle) Schematic of the endocardial view of the isolated RA. (Right) Representative image of an isolated RA preparation of the rat heart overlaid with optical action potentials (OAPs) (time 100 ms). The leading pacemaker site is identified as the location within the preparation that displays the earliest activation time as identified during the upstroke by 50% of the OAP amplitude (AP50). (B) Representative OAPs for 10 consecutive beats over a 2-s optical recording. Points are replotted onto a new y-axis in arbitrary units (AU) along the crista terminalis (CT) between the inferior vena cava (IVC) to the SVC and normalized between 0 and 1. (C) Intrinsic heart rates (HRs) of in vivo (8 to 12 weeks of age; n = 7) rat hearts and ex vivo (8 to 12 weeks of age; n = 8) rat SANs. (D) (Left) HR changes caused by the administration of ACh or ISO in all rats (n = 8). (Middle) Normalized locations of leading pacemaker sites under baseline conditions (black), ACh (blue), and ISO (red) plotted against corresponding HRs. Points were assigned to 1 of 2 cluster locations (superior or inferior) and fitted with a logistic regression curve using k-means clustering analysis (gray dashed line). (Right) The two clusters are fitted with a normal probability distribution (μ = mean, σ = standard deviation). Representative activation maps of an isolated RA tissue preparation during baseline sinus rhythm, high parasympathetic stimulation (100-mM acetylcholine chloride [ACh]), and high sympathetic stimulation (500-nM isoproterenol [ISO]). Points are replotted onto the new axis on a beat-to-beat basis and color-coded according to corresponding condition (baseline = black, ACh = blue, ISO = red). (F) New schematic of the posterior view of the rat heart with 2 spatially unique pacemakers: the superior SAN (sSAN) and inferior SAN (iSAN). A AVN = atrioventricular node; LA = left atria; RV = right ventricle.
FIGURE 2
FIGURE 2. Functional Characterization of the Physically Separated Rat sSAN and iSAN
(A) Schematic of the rat RA preparation surgically cut to isolate the sSAN and iSAN. (B) (Left) HR responses of ex vivo intact and physically separated SANs under baseline conditions (black) and after exposure to high parasympathetic stimulation (100-μM ACh [blue]) and high sympathetic stimulation (500 nM ISO [red]) (n = 5). (Right) Boxplots display the distribution of y-axis locations of leading pacemaker sites under each of the 3 experimental conditions after the physical separation of the SAN (n = 5). (C) (Left) Representative optical activation maps of a separated SAN during baseline sinus rhythm, high parasympathetic stimulation, and high sympathetic stimulation. (Right) Sites are replotted onto the new axis and color-coded according to corresponding condition (baseline = black, ACh = blue, ISO = red), with boxplots showing distribution of leading pacemaker locations (n = 1). Abbreviations as in Figure 1.
FIGURE 3
FIGURE 3. Functional Evidence of Only 1 Pacemaking Region, Either sSAN or iSAN, in the Failing Rat Heart
(A) Schematic of the posterior view of a failing rat heart created by ascending aortic constriction. (B) Intrinsic HRs of in vivo (8 to 12 weeks of age; n = 11) failing rats and ex vivo (10 to 12 weeks of age; n = 6) end-stage failing rat SANs under baseline conditions (black), 100-µM ACh (blue), and 500-nM ISO (red). (C) HR changes with ACh and ISO in all ex vivo failing rat hearts (n = 6). (D) Representative activation maps of 2 isolated RA tissue preparation from heart failure rats during baseline sinus rhythm, high parasympathetic stimulation (100-µM ACh), and high sympathetic stimulation (500-nM ISO). Points are replotted onto the new axis on a beat-to-beat basis and color-coded according to corresponding condition (baseline = black, ACh = blue, ISO = red). (E) Four hearts displayed pacemaking activity from the sSAN alone during all treatment conditions, and 2 hearts displayed pacemaking activity from the iSAN alone during all treatment conditions. Abbreviations as in Figure 1.
FIGURE 4
FIGURE 4. Molecular Characterization of the Rat sSAN and iSAN
(A) Tissue segments of healthy rat hearts (n=4) were dissected for RNA sequencing from the sSAN, iSAN, RA, and LA. (B) Venn diagrams depict the number of up- and down-regulated differentially expressed genes (DEGs) (padj < 0.05) for the sSAN and iSAN as compared with the neighboring RA. (C) Most enriched Gene Ontology (GO) terms for up-regulated DEGs in the sSAN (top) and iSAN (bottom) as compared with the RA. (D) Heatmap showing the expression patterns of 4 categories of genes of interest for the different tissue regions. Genes within each category were subject to hierarchical clustering. Gene set enrichment analysis (GSEA) of the 4 gene sets found significant differences between sSAN and iSAN in the cardiac receptor group (data not shown). (E) List of up-regulated cardiac-specific DEGs for the sSAN and iSAN, as compared to the RA. (F) Fragments per kilobase of transcript per million mapped reads (FPKM) of cardiac-specific transcription factors across tissues. Abbreviations as in Figure 1.
FIGURE 5
FIGURE 5. Ion Channels and Surface Receptors in the 2 Rat Pacemakers: sSAN and iSAN
Channels which allow for the inward passage of sodium ions or outward passage of potassium ions are indicated with solid arrows (membrane clock). Channels which allow for the permeability of calcium ions are indicated with dashed arrows (calcium clock). Channels and receptors are colored according to the legend if their presence is statistically significant (p < 0.05). Created with BioRender.
FIGURE 6
FIGURE 6. Functional and Molecular Characterization of the Human sSAN and iSAN
(A) Schematic of the endocardial view of the isolated human RA as well as a representative image of an isolated RA preparation with spatially overlaid OAPs. (B) (Left) Intrinsic HRs ex vivo human SANs under baseline conditions and pharmacological stimulation (n = 3). (Right) Normalized y-axis locations of leading pacemaker sites under baseline conditions (black), ACh (blue), and ISO (red) plotted against corresponding HRs. Points were assigned to 1 of 2 cluster locations (superior or inferior) and fitted with logistic regression curves using k-means clustering analysis (gray dashed line) and a normal probability distribution. (C) Representative OAPs of an isolated human RA preparation during baseline sinus rhythm, high parasympathetic stimulation (500-nM ACh), and high sympathetic stimulation (100-nM ISO). (D) Schematic of the posterior view of the human heart with the 2 spatially distinct pacemakers. (E) Venn diagrams depicting the number of up- and down-regulated DEGs for the sSAN and iSAN as compared with the neighboring RA. (F) Volcano plots for the sSAN and iSAN as compared with RA. (G) Heatmap showing the expression patterns of 4 categories of genes of interest for 4 different tissue regions. Genes within each category were subject to hierarchical clustering. GSEA analysis of the 4 gene sets found no significant differences between sSAN and iSAN in any category. (H) Fragments per kilobase of transcript per million mapped reads (FPKM) of cardiac-specific transcription factors across tissues.
CENTRAL ILLUSTRATION
CENTRAL ILLUSTRATION. Sinus Rhythm Is Driven by 2 Distinct Pacemaking Regions in the Human Heart
The normal sinus rhythm is driven by 2 distinct pacemaking regions in the human heart: the superior sinoatrial node (sSAN) and inferior SAN (iSAN), which are located near the superior vena cava (SVC) and inferior vena cava (IVC), respectively. The sSAN and iSAN preferentially control high and low physiological heart rates, respectively. (Left) Ex vivo leading pacemaker sites during normal sinus rhythm across a range of heart rates in 3 human hearts and (right) representative optical activation maps for beats during fast sinus rhythm (top right) and slow sinus rhythm (bottom right). SVC = superior vena cava; IVC = inferior vena cava; sSAN = superior sinoatrial node; iSAN = inferior sinoatrial node.

Comment in

References

    1. Schuessler RB, Boineau JP, Bromberg BI. Origin of the sinus impulse. J Cardiovasc Electrophysiol 1996;7:263–74. - PubMed
    1. Boyett MR, Honjo H, Kodama I. The sinoatrial node, a heterogeneous pacemaker structure. Cardiovasc Res 2000;47:658–87. - PubMed
    1. Glukhov AV, Fedorov VV, Anderson ME, Mohler PJ, Efimov IR. Functional anatomy of the murine sinus node: High-resolution optical mapping of ankyrin-B heterozygous mice. Am J Physiol Heart Circ Physiol 2010;299:H482–91. - PMC - PubMed
    1. Lu HH. Shifts in pacemaker dominance within the sinoatrial region of cat and rabbit hearts resulting from increase of extracellular potassium. Circ Res 1970;26:339–46. - PubMed
    1. Mackaay AJC, Op’t Hof T, Bleeker WK, Jongsma HJ, Bouman LN. Interaction of adrenaline and acetylcholine on cardiac pacemaker function. Functional inhomogeneity of the rabbit sinus node. J Pharmacol Exp Ther 1980;214:417–22. - PubMed

Publication types