Review
. 2021 May 1;110(1):11-20.
doi: 10.1016/j.ijrobp.2020.11.020. Epub 2020 Dec 23.

A Primer on Dose-Response Data Modeling in Radiation Therapy

Affiliations
Review

A Primer on Dose-Response Data Modeling in Radiation Therapy

Vitali Moiseenko et al. Int J Radiat Oncol Biol Phys. .

Abstract

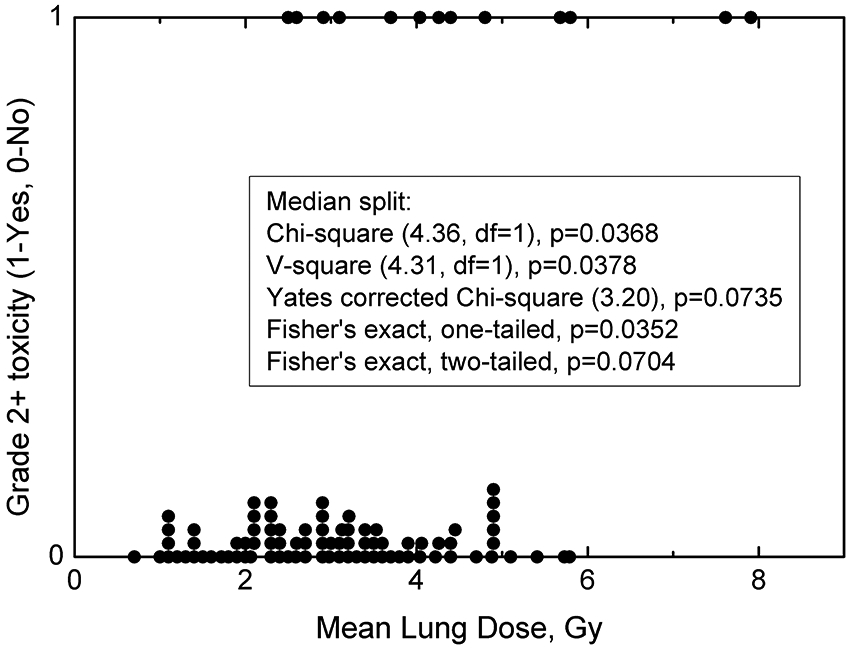
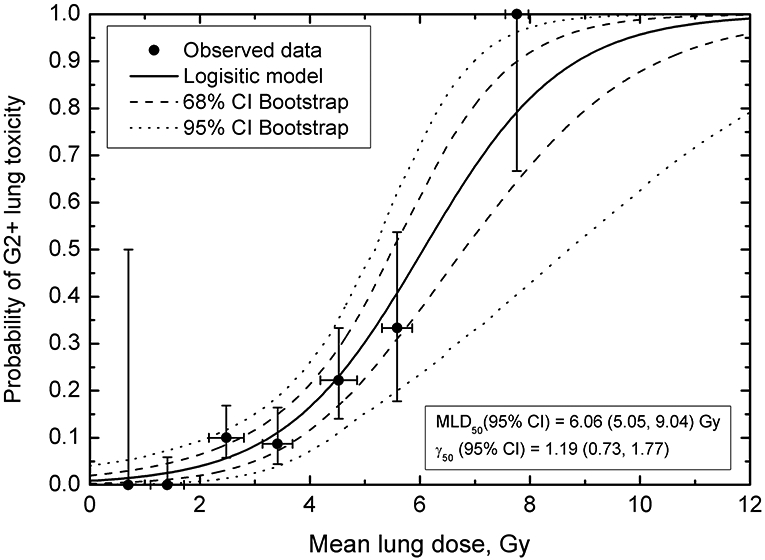
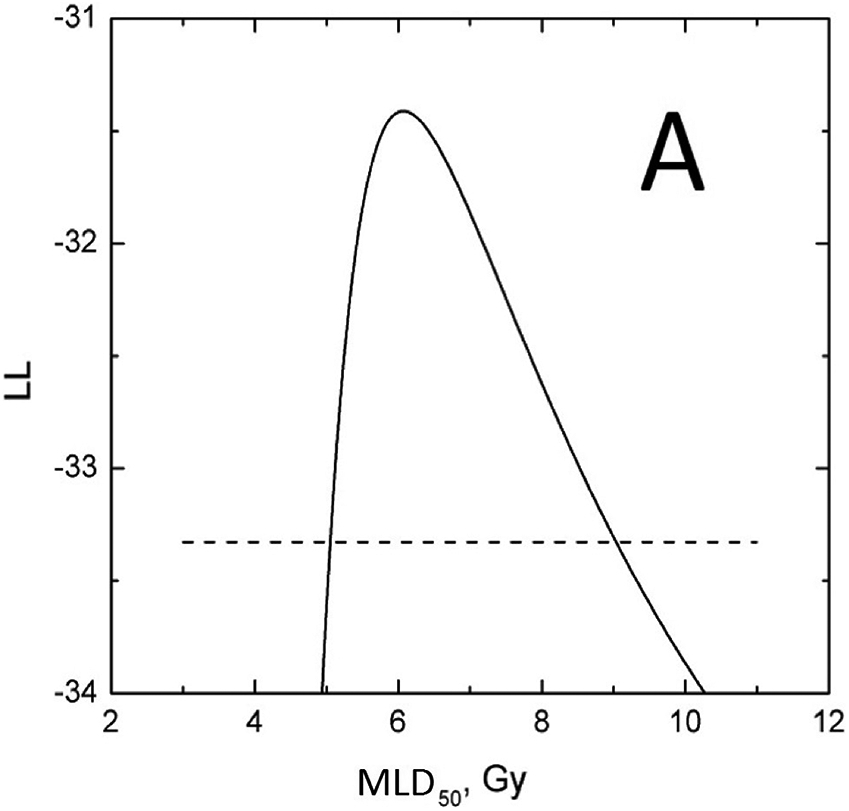
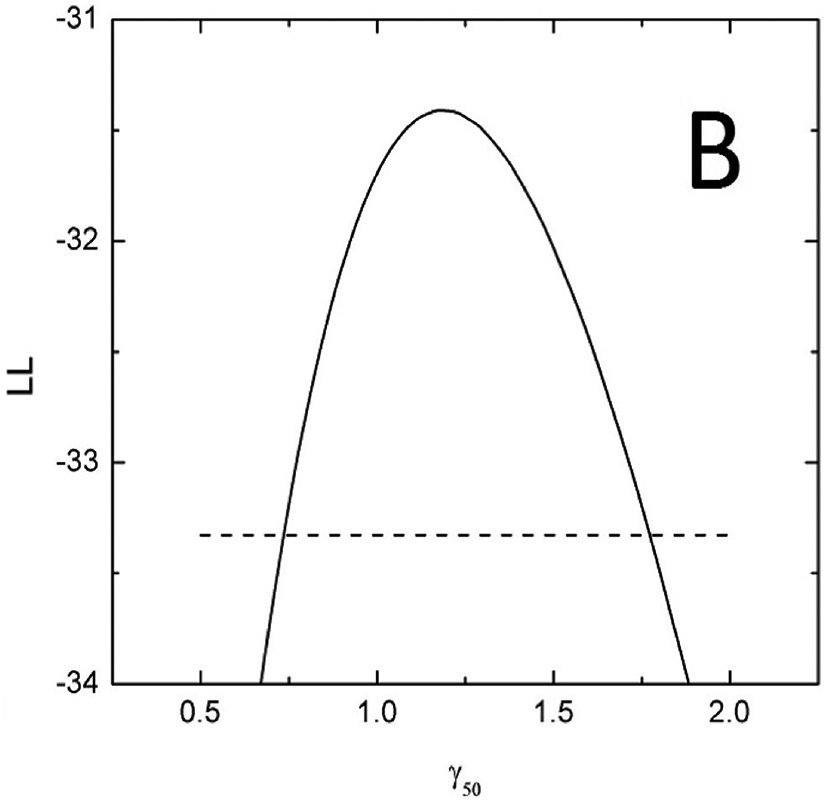
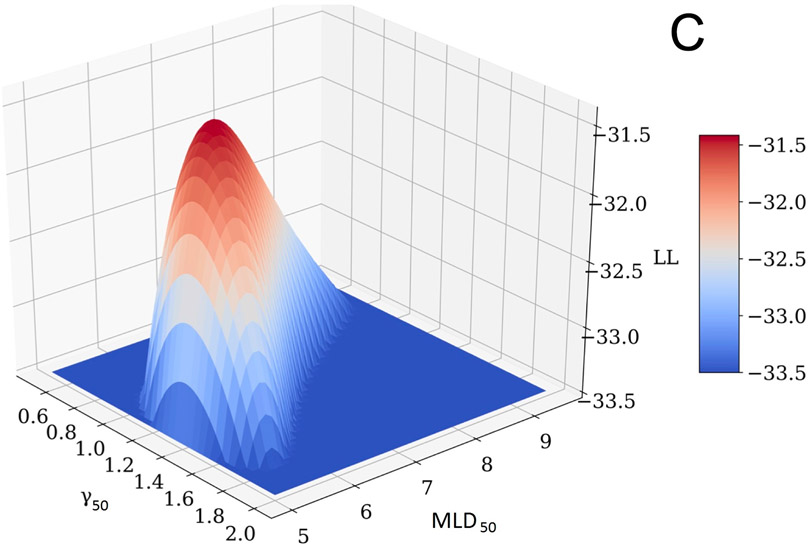
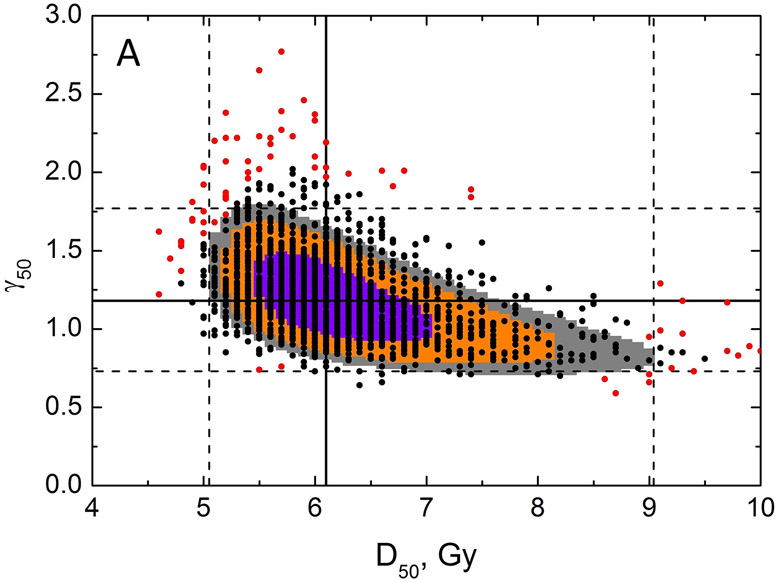
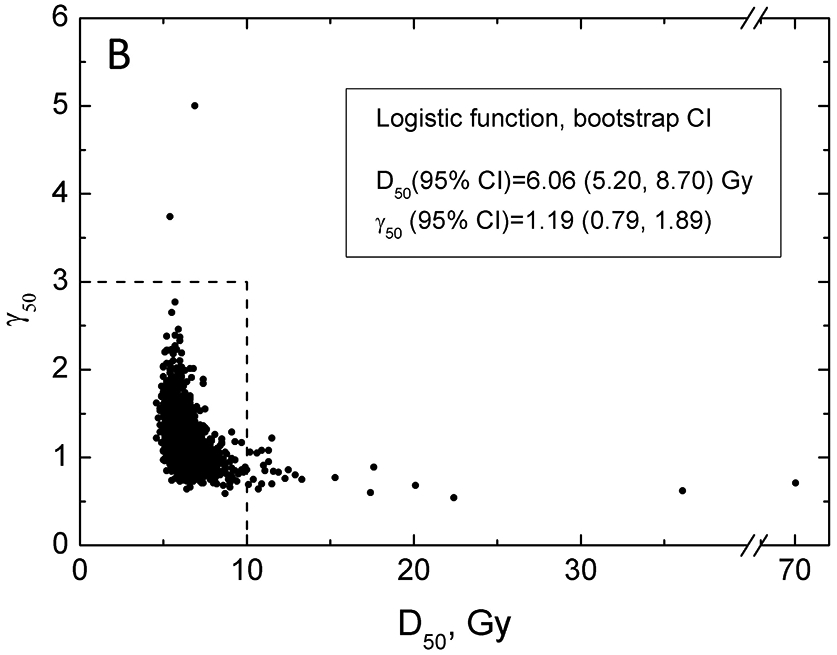
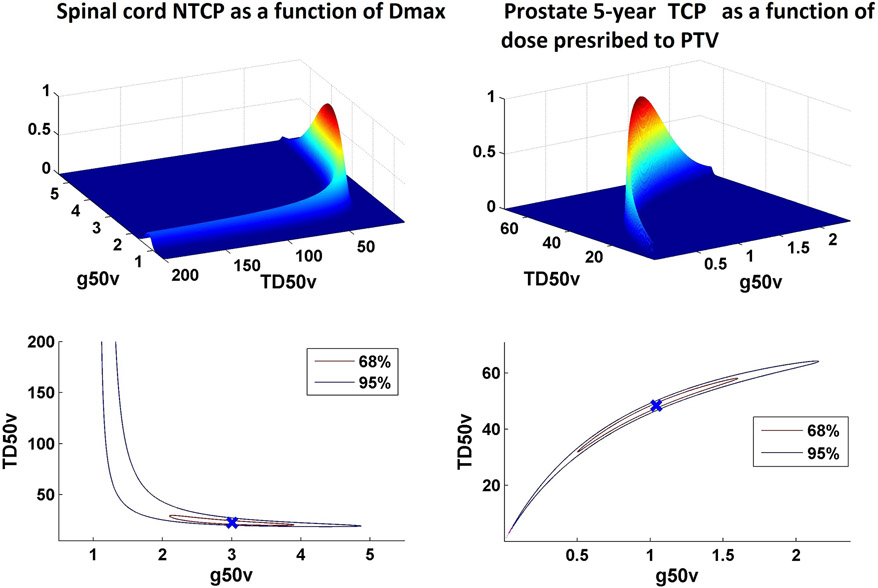
An overview of common approaches used to assess a dose response for radiation therapy-associated endpoints is presented, using lung toxicity data sets analyzed as a part of the High Dose per Fraction, Hypofractionated Treatment Effects in the Clinic effort as an example. Each component presented (eg, data-driven analysis, dose-response analysis, and calculating uncertainties on model prediction) is addressed using established approaches. Specifically, the maximum likelihood method was used to calculate best parameter values of the commonly used logistic model, the profile-likelihood to calculate confidence intervals on model parameters, and the likelihood ratio to determine whether the observed data fit is statistically significant. The bootstrap method was used to calculate confidence intervals for model predictions. Correlated behavior of model parameters and implication for interpreting dose response are discussed.


Conflict of interest statement

Conflict of interest:

VM: none

LBM: none

JG: reports grants from Accuray, grants from Novocure, outside the submitted work; In addition, Dr. Grimm has a patent DVH Evaluator issued

AJ: reports grants from NCI, during the conduct of the study

MTM: reports personal fees from Galera Therapeutics, personal fees from Wolters Kluwer, outside the submitted work

JHG: reports other from Varian Medical Systems, outside the submitted work

MPHL: none

NP: none

EY: reports grants from NCI, during the conduct of the study

IEN: reports other from Endectra, LLC, grants from NIH, outside the submitted work

Figures

Figure 1.
Figure 1.
Patient mean lung dose (MLD) and toxicity summary, where each point represents an individual patient exhibiting toxicity labelled as “1”, or without toxicity labelled as “0”. Overlapping or near-overlapping points (same or similar MLD) have been incremented by 0.025 to show the number of patients receiving particular MLD. Insert shows basic description statistics with a median MLD split. df = degrees of freedom. Median MLD is 3.05 Gy.
Figure 2.
Figure 2.
Probability of Grade 2 or higher toxicity as a function of mean lung dose. Horizontal error bars on data points are standard deviation for MLD for patients in a particular MLD bin; vertical error bars are 68% binomial CI for the observed outcome. Solid line shows the logistic curve, dashed and dotted lines are confidence intervals calculated using bootstrap (68% dashed, 95% dotted). Bin size was set to 1 Gy to obtain sufficient resolution to visualize MLD-response while keeping MLD variance within the bin reasonably small.
Figure 3.
Figure 3.
D50 (panel A) and γ50 (panel B) LL profiles to calculate the parameter value CIs. Horizontal dashed line is a cut-off which is maximum LL, −31.41 minus 1.92. Profiles maximize at best values. Panel C shows a LL surface as a function of D50 and γ50. Profiles in panels A and B are projections of the surface onto D50-LL and γ50-LL planes. For any MLD50 value in panel A, γ50 is selected so that LL takes the maximum value for the considered MLD50, and vice versa for panel B.
Figure 3.
Figure 3.
D50 (panel A) and γ50 (panel B) LL profiles to calculate the parameter value CIs. Horizontal dashed line is a cut-off which is maximum LL, −31.41 minus 1.92. Profiles maximize at best values. Panel C shows a LL surface as a function of D50 and γ50. Profiles in panels A and B are projections of the surface onto D50-LL and γ50-LL planes. For any MLD50 value in panel A, γ50 is selected so that LL takes the maximum value for the considered MLD50, and vice versa for panel B.
Figure 4.
Figure 4.
Results of bootstrap analysis. Each point is D50 and γ50 calculated for a sample of patient obtained by random sampling with replacement, 2000 histories were ran. Panel A: Zoomed-in view showing a restricted range of D50 and γ50. LL areas calculated as MLL minus 0.495 (violet), 1.353 (orange) and 1.92 (grey), which are chi-square values for 1 degree of freedom divided by 2 for p=0.68, 0.90 and 0.95. Model parameter values best fitting the data are shown as black solid line, dashed lines are 95% CIs for the model parameters. The 100 red points reflect the 5% of the data which contribute the least to the CI within the MLD range 0-12Gy. Panel B: Zoomed-out view, with wider range of D50 and γ50 (dotted lines reflect the data range in panel A), with full results of bootstrap analysis. The legend shows CI for model parameters calculated using bootstrap.
Figure 4.
Figure 4.
Results of bootstrap analysis. Each point is D50 and γ50 calculated for a sample of patient obtained by random sampling with replacement, 2000 histories were ran. Panel A: Zoomed-in view showing a restricted range of D50 and γ50. LL areas calculated as MLL minus 0.495 (violet), 1.353 (orange) and 1.92 (grey), which are chi-square values for 1 degree of freedom divided by 2 for p=0.68, 0.90 and 0.95. Model parameter values best fitting the data are shown as black solid line, dashed lines are 95% CIs for the model parameters. The 100 red points reflect the 5% of the data which contribute the least to the CI within the MLD range 0-12Gy. Panel B: Zoomed-out view, with wider range of D50 and γ50 (dotted lines reflect the data range in panel A), with full results of bootstrap analysis. The legend shows CI for model parameters calculated using bootstrap.
Figure 5.
Figure 5.
Relationship of TD50 and slope parameter g50 for models based on data derived from settings were event rates are extremely low (e.g. NTCP for spinal cord as a function of Dmax in panel A) or very high (e.g. 5-year TCP for low-intermediate risk prostate cancer as a function of dose prescribed to PTV in panel B).

Comment in

  • In Regard to Moiseenko et al.
    Schultheiss TE. Schultheiss TE. Int J Radiat Oncol Biol Phys. 2021 Jun 1;110(2):609. doi: 10.1016/j.ijrobp.2021.03.018. Int J Radiat Oncol Biol Phys. 2021. PMID: 33989579 No abstract available.
  • In Reply to Schultheiss.
    Moiseenko V, Hattangadi-Gluth JA, Huynh-Le MP, Marks LB, Grimm J, Milano MT, Jackson A, Yorke E, Pettersson N, Naqa IE. Moiseenko V, et al. Int J Radiat Oncol Biol Phys. 2021 Aug 1;110(5):1541-1543. doi: 10.1016/j.ijrobp.2021.03.019. Epub 2021 May 18. Int J Radiat Oncol Biol Phys. 2021. PMID: 34024669 No abstract available.

References

    1. Chapet O, Kong FM, Lee JS, et al. Normal tissue complication probability modeling for acute esophagitis in patients treated with conformal radiation therapy for non-small cell lung cancer. Radiother Oncol 2005; 77:176–81. doi:10.1016/j.radonc.2005.10.001. - DOI - PubMed
    1. Bentzen SM, Tucker SL. Quantifying the position and steepness of radiation dose-response curves. Int J Radiat Biol 1997; 71:531–42. doi. - PubMed
    1. Moiseenko V, Song WY, Mell LK, et al. A comparison of dose-response characteristics of four ntcp models using outcomes of radiation-induced optic neuropathy and retinopathy. Radiat Oncol 2011; 6:61. doi:10.1186/1748-717X-6-61. - DOI - PMC - PubMed
    1. Roberts SA, Hendry JH. The delay before onset of accelerated tumour cell repopulation during radiotherapy: A direct maximum-likelihood analysis of a collection of worldwide tumour-control data. Radiother Oncol 1993; 29:69–74. doi. - PubMed
    1. Tucker SL, Liu HH, Liao Z, et al. Analysis of radiation pneumonitis risk using a generalized lyman model. Int J Radiat Oncol Biol Phys 2008; 72:568–74. doi:10.1016/j.ijrobp.2008.04.053. - DOI - PMC - PubMed

Publication types