

Modified Needleman-Wunsch algorithm for clinical pathway clustering
- PMID: 33359110
- PMCID: PMC7973729
- DOI: 10.1016/j.jbi.2020.103668
Modified Needleman-Wunsch algorithm for clinical pathway clustering
Abstract
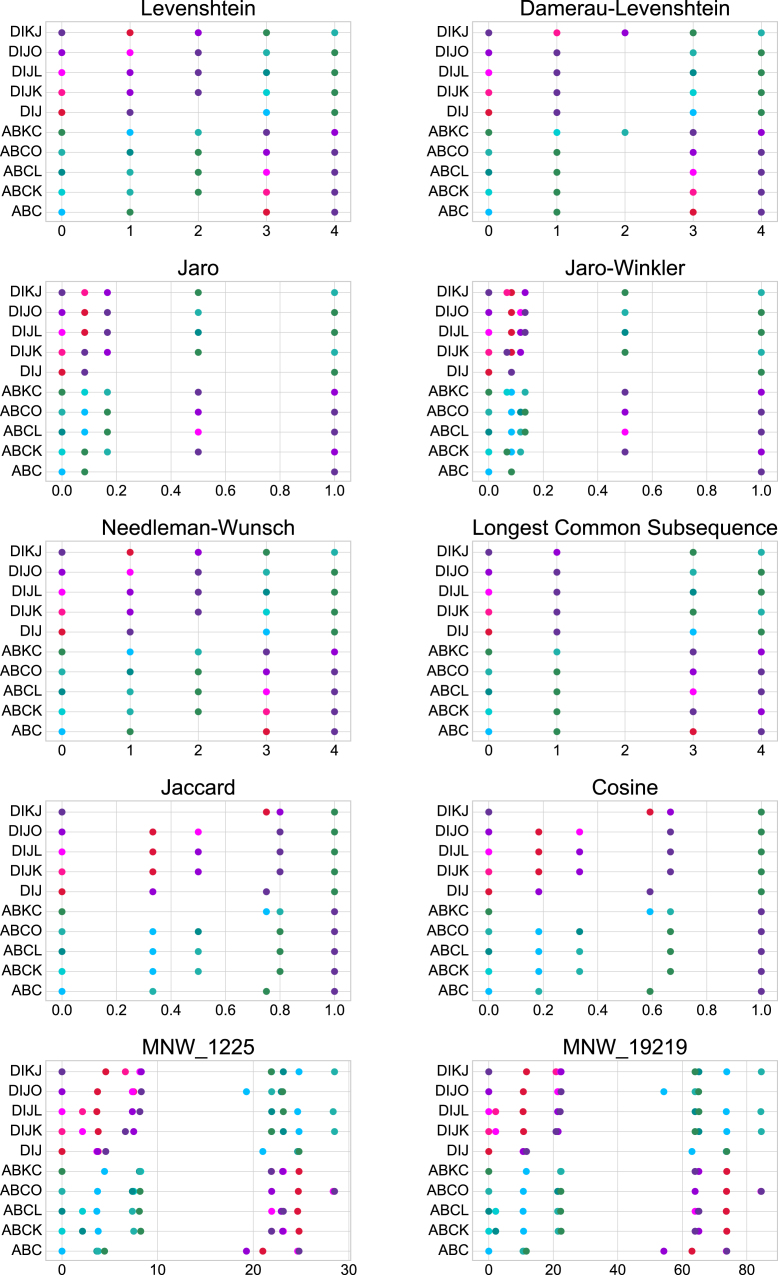
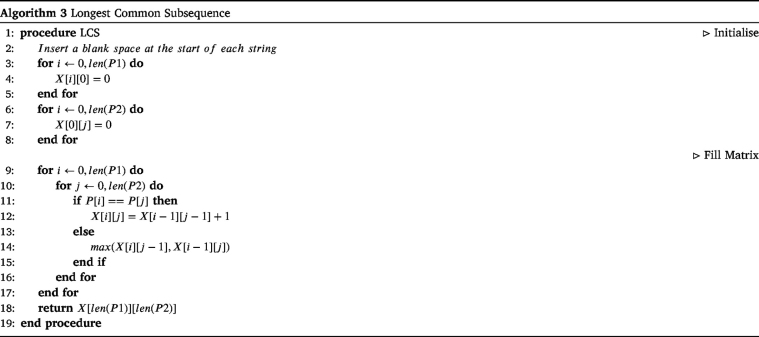
Clinical pathways are used to guide clinicians to provide a standardised delivery of care. Because of their standardisation, the aim of clinical pathways is to reduce variation in both care process and patient outcomes. When learning clinical pathways from data through data mining, it is common practice to represent each patient pathway as a string corresponding to their movements through activities. Clustering techniques are popular methods for pathway mining, and therefore this paper focuses on distance metrics applied to string data for k-medoids clustering. The two main aims are to firstly, develop a technique that seamlessly integrates expert information with data and secondly, to develop a string distance metric for the purpose of process data. The overall goal was to allow for more meaningful clustering results to be found by adding context into the string similarity calculation. Eight common distance metrics and their applicability are discussed. These distance metrics prove to give an arbitrary distance, without consideration for context, and each produce different results. As a result, this paper describes the development of a new distance metric, the modified Needleman-Wunsch algorithm, that allows for expert interaction with the calculation by assigning groupings and rankings to activities, which provide context to the strings. This algorithm has been developed in partnership with UK's National Health Service (NHS) with the focus on a lung cancer pathway, however the handling of the data and algorithm allows for application to any disease type. This method is contained within Sim.Pro.Flow, a publicly available decision support tool.
Keywords: Clinical pathways; Data mining; Lung cancer.
Copyright © 2021 The Authors. Published by Elsevier Inc. All rights reserved.
Conflict of interest statement
The authors declare that they have no known competing financial interests or personal relationships that could have appeared to influence the work reported in this paper.
Figures


References
-
- World Health Organisation . 2018. Latest global cancer data. https://www.who.int/cancer/PRGlobocanFinal.pdf.
-
- Snyder M. Big data and health. Lancet Digit. Health. 2019;1(6):e252–e254. - PubMed
-
- Zhang Y., Padman R., Patel N. Paving the cowpath: Learning and visualizing clinical pathways from electronic health record data. J. Biomed. Inform. 2015;58:186–197. cited By 10. - PubMed
-
- Fauman M. Do physicians use practice guidelines? Psychiatr. Times. 2006:13.
Publication types
MeSH terms
Grants and funding
LinkOut - more resources
Full Text Sources
Other Literature Sources
Research Materials
