. 2021 Feb 2;120(3):453-462.
doi: 10.1016/j.bpj.2020.12.015. Epub 2020 Dec 24.

Correlating the Structure and Activity of Y. pestis Ail in a Bacterial Cell Envelope

Affiliations

Correlating the Structure and Activity of Y. pestis Ail in a Bacterial Cell Envelope

James E Kent et al. Biophys J. .

Abstract

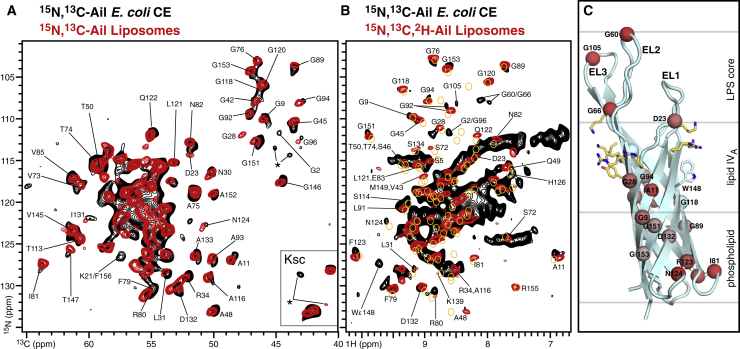
Understanding microbe-host interactions at the molecular level is a major goal of fundamental biology and therapeutic drug development. Structural biology strives to capture biomolecular structures in action, but the samples are often highly simplified versions of the complex native environment. Here, we present an Escherichia coli model system that allows us to probe the structure and function of Ail, the major surface protein of the deadly pathogen Yersinia pestis. We show that cell surface expression of Ail produces Y. pestis virulence phenotypes in E. coli, including resistance to human serum, cosedimentation of human vitronectin, and pellicle formation. Moreover, isolated bacterial cell envelopes, encompassing inner and outer membranes, yield high-resolution solid-state NMR spectra that reflect the structure of Ail and reveal Ail sites that are sensitive to the bacterial membrane environment and involved in the interactions with human serum components. The data capture the structure and function of Ail in a bacterial outer membrane and set the stage for probing its interactions with the complex milieu of immune response proteins present in human serum.


Figures

Figure 1
Figure 1
Expression of folded Ail in the E. coli outer membrane. (A) Depiction of the bacterial cell envelope (CE) isolated from whole cell (WC) for NMR studies, including outer membrane (OM) with embedded Ail (cyan), inner membrane (IM), peptidoglycan (PG), and periplasm. (BG) SDS-PAGE of CE, WC, or OM fractions isolated from E. coli C41(DE3), BL21(DE3)ΔACF, or Lemo21(DE3) cells. Ail was visualized with Coomassie stain (AD and F) or by immunoblotting with Ail-specific antibody (E and G). Cells incubated with NHS for 30 min were analyzed by SDS-PAGE and immunoblotting after heat denaturation (G). To see this figure in color, go online.
Figure 2
Figure 2
Solid-state 15N/13C/1H NMR of Ail in E. coli cell envelopes. (A) 2D 15N/13C NCA spectra of 15N,13C-Ail in E. coli CE (black) or reconstituted liposomes (red). Spectra were recorded at 750 MHz, 7°C, with an MAS rate of 11 kHz and 640 transients for CE or 128 transients for liposomes. Resolvable assigned peaks are marked. Asterisks denote new unassigned peaks. (B) 1H-detected 1H/15N CP-HSQC spectra of 15N-Ail in E. coli CE (black) or reconstituted liposomes (red). Spectra were recorded at 900 MHz, 30°C, with an MAS rate of 57 kHz and 1600 transients for CE or 160 transients for liposomes. (C) Structural model of Ail embedded in the Y. pestis OM taken from previous MD simulations (14). Spheres denote resolved and assigned amide N atoms that undergo 1H/15N chemical shift perturbations from 0 ppm (cyan) to 0.15 ppm (red) between the cellular and liposome environments. Side chains forming two clusters of LPS-recognition motifs are shown as yellow sticks. The boundaries of the OM phospholipid and LPS layers are marked (gray lines). Residue numbers, from E1 to F156, correspond to the mature sequence of Ail. To see this figure in color, go online.
Figure 3
Figure 3
Solid-state 13C/13C NMR of Ail in E. coli cell envelopes. 2D 13C/13C PDSD spectra were recorded at 750 MHz, 7°C, with an MAS rate of 11 kHz, and with 204 t1 increments and 304 transients for CEs (black) or 512 t1 increments and 64 transients for reconstituted liposomes (red). Resolvable signals from Ala, Ile, Ser, Thr, and Val residues of Ail (blue) and non-Ail bacterial CE components (gold) are marked. (A) Aliphatic region. (B) Expanded spectral regions. To see this figure in color, go online.
Figure 4
Figure 4
Y. pestis phenotypes induced by Ail in E. coli. Assays were performed with E. coli Lemo21(DE3) cells transformed with Ail-bearing plasmid, Ail(+), or empty plasmid, Ail(−). Each data set is representative of at least triplicate experiments. (A) Survival of E. coli cells in NHS relative to HIS was assayed by incubating cells with serum, then plating on agar and counting the surviving bacterial colonies. Survival is reported as percent serum resistance relative to the number of surviving colonies in HIS. (B) Pellicle formation was observed in Ail(+), but not Ail(−), cells. Cells were suspended in 2 mL of M9 minimal media (OD600 = 0.5, in 15 × 100 mm glass tubes) and incubated for 16 h at 37°C. After removing the cells by centrifugation, the interior glass walls were treated with methanol and air dried overnight, then washed three times with buffer and air dried overnight. Finally, the tubes were treated with 2.5 mL of crystal violet solution (0.1% for 10 min), then washed with buffer and air dried. Pellicle formation was detected as a violet-stained rim at the air-liquid interface (arrow). (C) Vn binding activity was assayed by co-sedimentation of Ail(+) or Ail(−) bacterial cells with NHS, HIS, purified full-length Vn, or purified Vn-HX. Immunoblots were probed with anti-Vn antibodies. (D) 1H-detected 1H/15N CP-HSQC solid-state NMR spectra of Ail in E. coli cell envelopes acquired before (black) or after (blue) incubation with NHS. Spectra were recorded at 900 MHz, 30°C, with an MAS rate of 57 kHz and 1600 (black) or 2048 (blue) transients. (E) Structural model of Ail embedded in the Y. pestis OM taken from a recent MD simulation (14). Spheres denote resolved and assigned amide N atoms that undergo 1H/15N chemical shift perturbations from 0 ppm (cyan) to 0.2 ppm (blue) in the presence of NHS. The boundaries of the OM phospholipid and LPS layers are marked. To see this figure in color, go online.

References

    1. Perry R.D., Fetherston J.D. Yersinia pestis--etiologic agent of plague. Clin. Microbiol. Rev. 1997;10:35–66. - PMC - PubMed
    1. Parkhill J., Wren B.W., Barrell B.G. Genome sequence of Yersinia pestis, the causative agent of plague. Nature. 2001;413:523–527. - PubMed
    1. Deng W., Burland V., Perry R.D. Genome sequence of Yersinia pestis KIM. J. Bacteriol. 2002;184:4601–4611. - PMC - PubMed
    1. Knirel Y.A., Anisimov A.P. Lipopolysaccharide of Yersinia pestis, the cause of plague: structure, genetics, biological properties. Acta Naturae. 2012;4:46–58. - PMC - PubMed
    1. Miller V.L., Bliska J.B., Falkow S. Nucleotide sequence of the Yersinia enterocolitica ail gene and characterization of the Ail protein product. J. Bacteriol. 1990;172:1062–1069. - PMC - PubMed

Publication types

Substances

LinkOut - more resources