

Association between composite scores of domain-specific cognitive functions and regional patterns of atrophy and functional connectivity in the Alzheimer's disease spectrum
- PMID: 33360018
- PMCID: PMC7770965
- DOI: 10.1016/j.nicl.2020.102533
Association between composite scores of domain-specific cognitive functions and regional patterns of atrophy and functional connectivity in the Alzheimer's disease spectrum
Abstract
Background: Cognitive decline has been found to be associated with gray matter atrophy and disruption of functional neural networks in Alzheimer's disease (AD) in structural and functional imaging (fMRI) studies. Most previous studies have used single test scores of cognitive performance among monocentric cohorts. However, cognitive domain composite scores could be more reliable than single test scores due to the reduction of measurement error. Adopting a multicentric resting state fMRI (rs-fMRI) and cognitive domain approach, we provide a comprehensive description of the structural and functional correlates of the key cognitive domains of AD.
Method: We analyzed MRI, rs-fMRI and cognitive domain score data of 490 participants from an interim baseline release of the multicenter DELCODE study cohort, including 54 people with AD, 86 with Mild Cognitive Impairment (MCI), 175 with Subjective Cognitive Decline (SCD), and 175 Healthy Controls (HC) in the AD-spectrum. Resulting cognitive domain composite scores (executive, visuo-spatial, memory, working memory and language) from the DELCODE neuropsychological battery (DELCODE-NP), were previously derived using confirmatory factor analysis. Statistical analyses examined the differences between diagnostic groups, and the association of composite scores with regional atrophy and network-specific functional connectivity among the patient subgroup of SCD, MCI and AD.
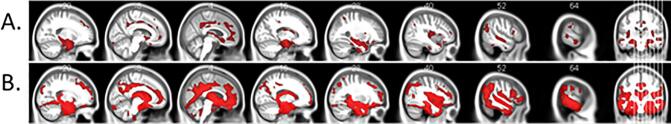
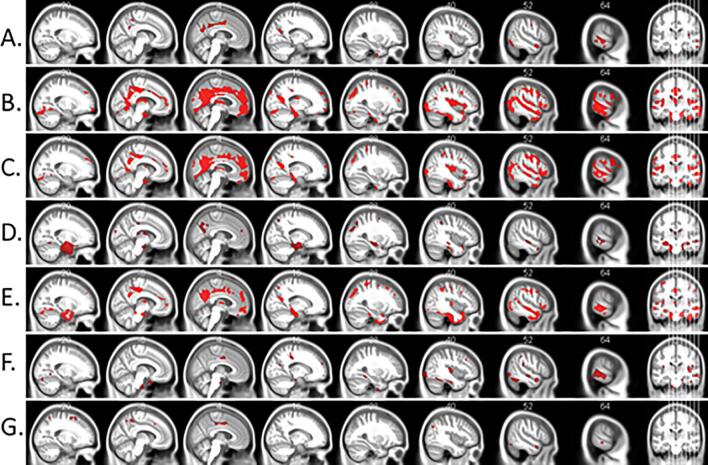
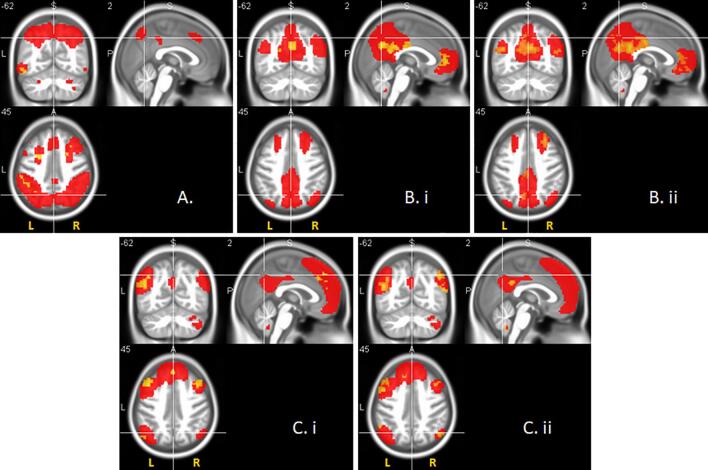
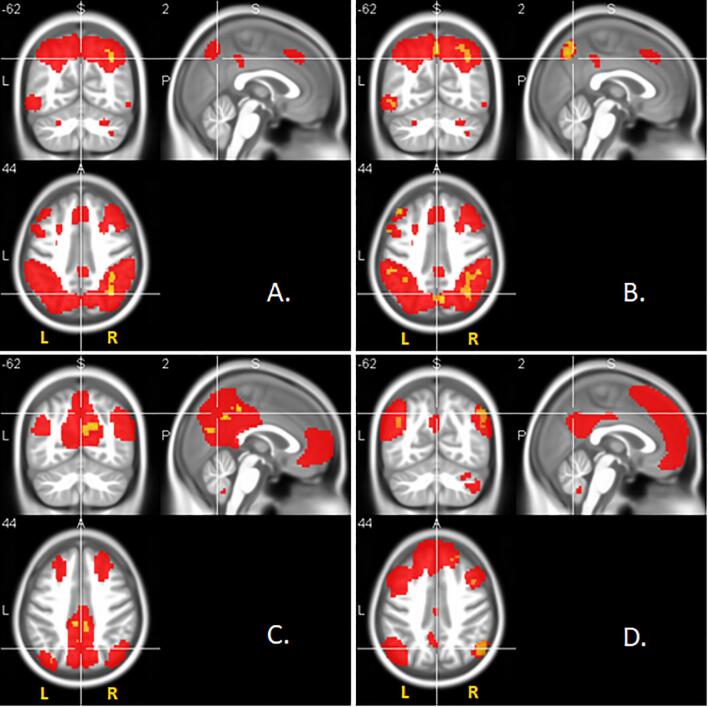
Result: Cognitive performance, atrophy patterns and functional connectivity significantly differed between diagnostic groups in the AD-spectrum. Regional gray matter atrophy was positively associated with visuospatial and other cognitive impairments among the patient subgroup in the AD-spectrum. Except for the visual network, patterns of network-specific resting-state functional connectivity were positively associated with distinct cognitive impairments among the patient subgroup in the AD-spectrum.
Conclusion: Consistent associations between cognitive domain scores and both regional atrophy and network-specific functional connectivity (except for the visual network), support the utility of a multicentric and cognitive domain approach towards explicating the relationship between imaging markers and cognition in the AD-spectrum.
Keywords: Alzheimer’s disease spectrum; Cognitive domain score; Cortical atrophy; Multicenter cohort; Resting-state functional connectivity; Visuo-spatial cognitive deficits.
Copyright © 2020 The Author(s). Published by Elsevier Inc. All rights reserved.
Conflict of interest statement
The authors declare that they have no known competing financial interests or personal relationships that could have appeared to influence the work reported in this paper.
Figures
References
-
- Agosta F., Pievani M., Geroldi C., Copetti M., Frisoni G.B., Filippi M. Resting state fMRI in Alzheimer's disease: beyond the default mode network. Neurobiol. Aging. 2012;33:1564–1578. - PubMed
-
- Albert M.S., DeKosky S.T., Dickson D., Dubois B., Feldman H.H., Fox N.C., Gamst A., Holtzman D.M., Jagust W.J., Petersen R.C., Snyder P.J., Carrillo M.C., Thies B., Phelps C.H. The diagnosis of mild cognitive impairment due to Alzheimer's disease: recommendations from the National Institute on Aging-Alzheimer's Association workgroups on diagnostic guidelines for Alzheimer's disease. Alzheimer's & Dementia. 2011;7:270–279. - PMC - PubMed
-
- Ashburner J. A fast diffeomorphic image registration algorithm. NeuroImage. 2007;38:95–113. - PubMed
-
- Balachandar R., Bharath S., John J.P., Joshi H., Sadanand S., Saini J., Kumar K.J., Varghese M. Resting-state functional connectivity changes associated with visuospatial cognitive deficits in patients with mild Alzheimer disease. Dement. Geriatr. Cogn. Disord. 2017;43:229–236. - PubMed
Publication types
MeSH terms
LinkOut - more resources
Full Text Sources
Other Literature Sources
Medical
Miscellaneous
