. 2021 Feb:39:101838.
doi: 10.1016/j.redox.2020.101838. Epub 2020 Dec 17.

Genomic GLO1 deletion modulates TXNIP expression, glucose metabolism, and redox homeostasis while accelerating human A375 malignant melanoma tumor growth

Affiliations

Genomic GLO1 deletion modulates TXNIP expression, glucose metabolism, and redox homeostasis while accelerating human A375 malignant melanoma tumor growth

Jana Jandova et al. Redox Biol. 2021 Feb.

Abstract

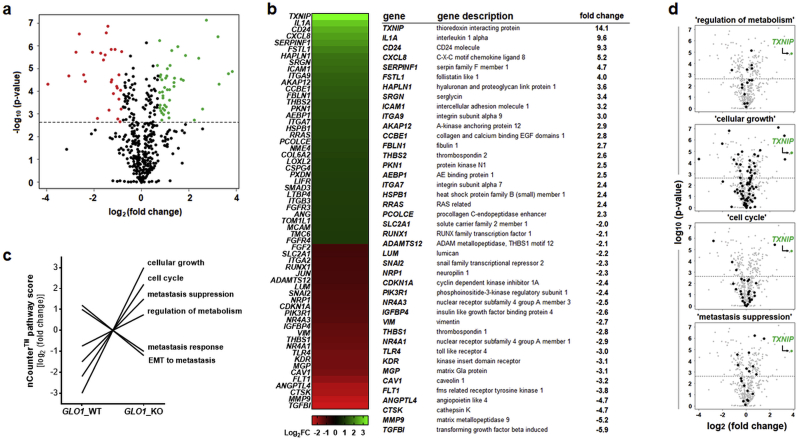
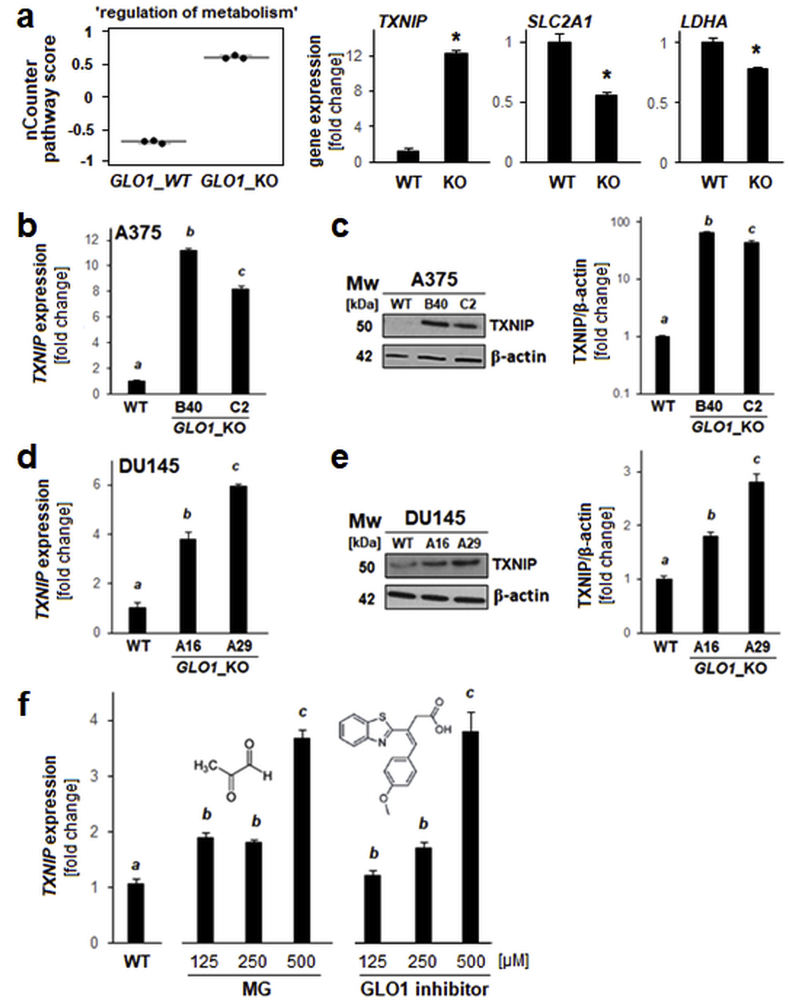
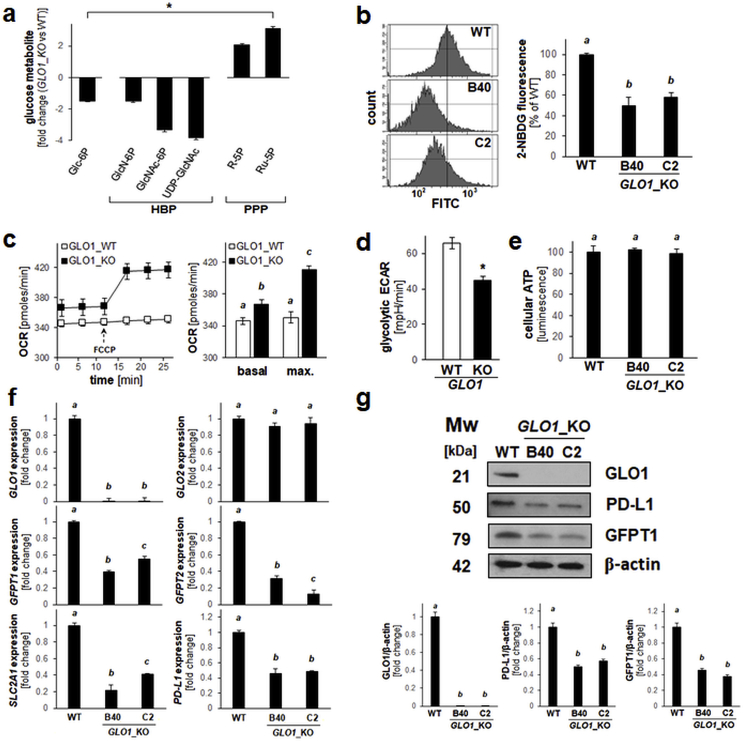
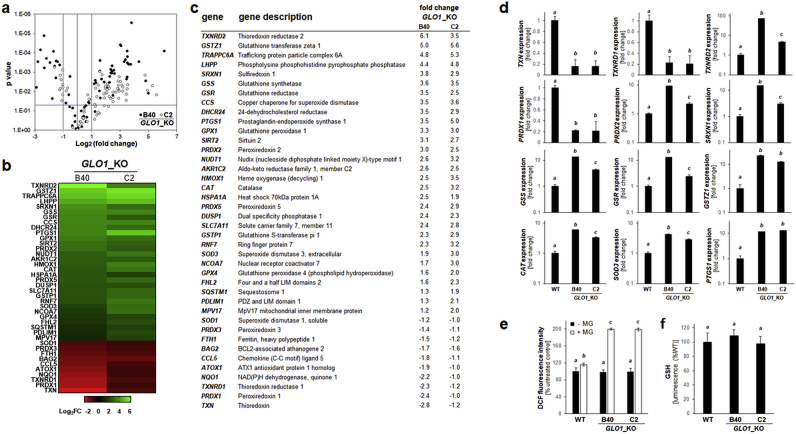
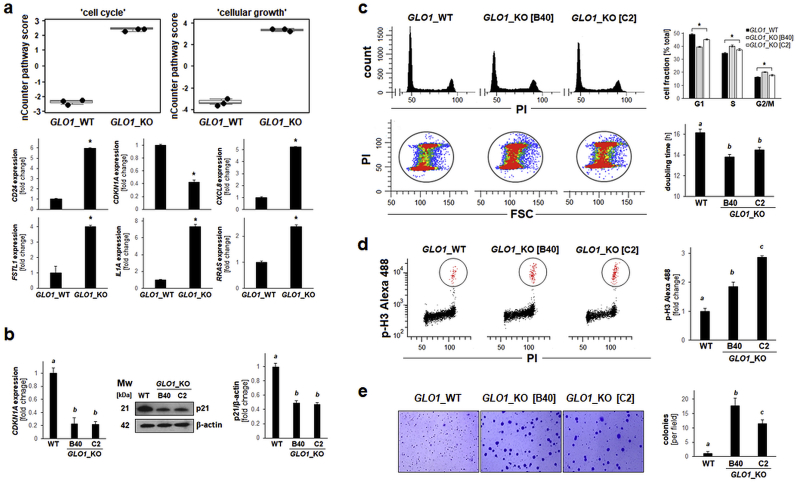
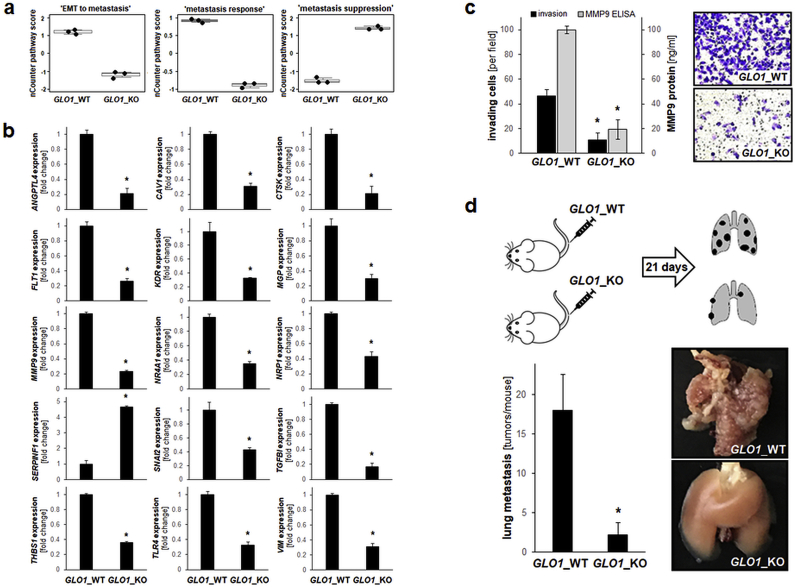
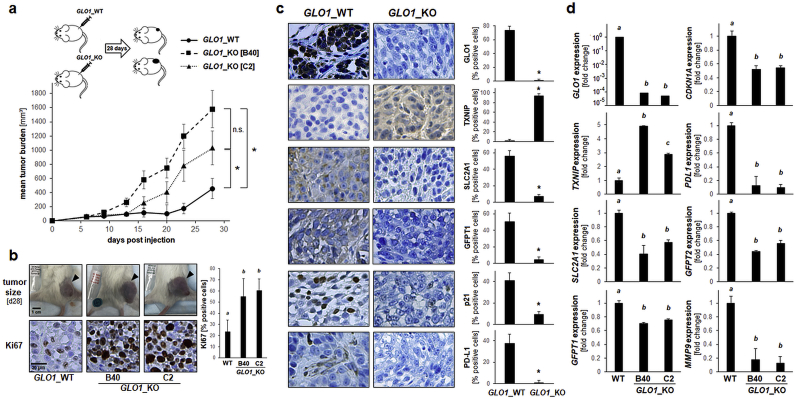
Glyoxalase 1 (encoded by GLO1) is a glutathione-dependent enzyme detoxifying the glycolytic byproduct methylglyoxal (MG), an oncometabolite involved in metabolic reprogramming. Recently, we have demonstrated that GLO1 is overexpressed in human malignant melanoma cells and patient tumors and substantiated a novel role of GLO1 as a molecular determinant of invasion and metastasis in melanoma. Here, employing NanoString™ gene expression profiling (nCounter™ 'PanCancer Progression Panel'), we report that CRISPR/Cas 9-based GLO1 deletion from human A375 malignant melanoma cells alters glucose metabolism and redox homeostasis, observable together with acceleration of tumorigenesis. Nanostring™ analysis identified TXNIP (encoding thioredoxin-interacting protein), a master regulator of cellular energy metabolism and redox homeostasis, displaying the most pronounced expression change in response to GLO1 elimination, confirmed by RT-qPCR and immunoblot analysis. TXNIP was also upregulated in CRISPR/Cas9-engineered DU145 prostate carcinoma cells lacking GLO1, and treatment with MG or a pharmacological GLO1 inhibitor (TLSC702) mimicked GLO1_KO status, suggesting that GLO1 controls TXNIP expression through regulation of MG. GLO1_KO status was characterized by (i) altered oxidative stress response gene expression, (ii) attenuation of glucose uptake and metabolism with downregulation of gene expression (GLUT1, GFAT1, GFAT2, LDHA) and depletion of related key metabolites (glucose-6-phosphate, UDP-N-acetylglucosamine), and (iii) immune checkpoint modulation (PDL1). While confirming our earlier finding that GLO1 deletion limits invasion and metastasis with modulation of EMT-related genes (e.g. TGFBI, MMP9, ANGPTL4, TLR4, SERPINF1), we observed that GLO1_KO melanoma cells displayed a shortened population doubling time, cell cycle alteration with increased M-phase population, and enhanced anchorage-independent growth, a phenotype supported by expression analysis (CXCL8, CD24, IL1A, CDKN1A). Concordantly, an accelerated growth rate of GLO1_KO tumors, accompanied by TXNIP overexpression and metabolic reprogramming, was observable in a SCID mouse melanoma xenograft model, demonstrating that A375 melanoma tumor growth and metastasis can be dysregulated in opposing ways as a consequence of GLO1 elimination.

Keywords: Glucose transporter 1; Glyoxalase 1; Malignant melanoma; NanoString nCounter™ expression profiling; Thioredoxin-interacting protein; Tumorigenesis.


Conflict of interest statement

All authors declare that there are no conflicts of interest to disclose.

Figures

Fig. 1
Fig. 1
NanoString nCounter™ profiling identifies pronounced gene expression changes (including TXNIP upregulation) as a consequence of CRISPR/Cas9-based GLO1 deletion in human A375 malignant melanoma cells. NanoString™ analysis (using the nCounter™ PanCancer Progression Panel) was performed comparing gene expression between cultured human A375 malignant melanoma cells (GLO1_WT) and an isogenic variant (GLO1_KO [B40]). (a) Volcano plot [fold change (log2) versus p-value (log10)] depicting differential gene expression of 740 genes (GLO1_KO versus GLO1_WT; cut-off criteria: fold change ≥ 2; p ≤ 0.05; upregulated: green dots; downregulated: red dots). (b) Left panel: heat map depiction of statistically significant expression changes; right panel: table summarizing numerical values of up- and downregulated genes; cut off criteria as specified in (a). (c) NanoString nCounter™ covariate plot of gene expression ‘pathway scores’ as a function of GLO1 genotype identifying GLO1-responsive expression networks. (d) Volcano plots depicting individual expression pathways identified in panel (c) characterized by TXNIP upregulation representing the most pronounced expression change: ‘regulation of metabolism’ (out of 16 genes), ‘cellular growth’ (out of 97 genes), ‘cell cycle’ (out of 46 genes), and ‘metastasis suppression’ (out of 19 genes). (For interpretation of the references to colour in this figure legend, the reader is referred to the Web version of this article.)
Fig. 2
Fig. 2
Genetic deletion of GLO1 causes upregulation of TXNIP expression in DU145 prostate carcinoma and A375 malignant melanoma cells, and TXNIP expression is sensitive to pharmacological modulation using the GLO1 inhibitor TLSC702. (a) NanoString nCounter™ pathway score analysis of ‘regulation of metabolism’ (box plot depiction); single panels indicate comparative metabolism-related gene expression [TXNIP, SLC2A1 (GLUT1), LDHA]. (b–c) TXNIP expression in A375 melanoma (GLO1_WT versus GLO1_KO clones [B40 and C2]) as confirmed by independent RT-qPCR (b) and immunoblot (c) analyses; bar graph depicts immunoblot quantification over β-actin control. (d–e) TXNIP expression in DU145 prostate carcinoma cells (GLO1_WT versus GLO1_KO clones [A16 and A29]) as confirmed by independent RT-qPCR (d) and immunoblot (e) analyses; bar graph depicts immunoblot quantification over β-actin control. (f) TXNIP expression in A375 melanoma cells (GLO1_WT) exposed to MG-modulatory treatments [left panel: MG dose response; right panel: GLO1-inhibitor (TLSC702) dose response (24 h continuous exposure)] as confirmed by RT-qPCR analysis; molecular structures included. For all bar graph depictions, quantitative data analysis employed ANOVA with Tukey's post hoc test; means without a common letter differ from each other (p < 0.05). For bar graphs comparing two groups only, statistical significance was calculated employing the Student's two-tailed t-test (*p < 0.05).
Fig. 3
Fig. 3
Genetic deletion of GLO1 is associated with altered glucose uptake and metabolism in human A375 melanoma cells. (a) Glucose-derived signature metabolite profiling of cultured human A375 malignant melanoma (GLO1_WT) versus isogenic GLO1_KO [B40] cells by quantitative UPLC-MRM/MS analysis (HBP: hexosamine biosynthesis pathway; PPP: pentose phosphate pathway). (b) Glucose uptake as assessed by flow cytometry using the fluorescent glucose analogue 2-NBDG. Histograms (left panels) display representative measurements; bar graph (right panel) summarizes numerical analysis. (c) Oxygen consumption rate (OCR) as determined by Seahorse™ metabolic analysis using the mitochondrial uncoupler FCCP. Image displays a representative OCR time course (left panel); bar graph summarizes numerical analysis of basal and maximal respiration (right panel). (d) Glycolytic extracellular acidification rate (ECAR) as determined by Seahorse™ metabolic analysis; bar graph summarizes numerical analysis. (e) Cellular ATP levels (normalized to cell number) as determined using CellTiter-Glo™ luminescence analysis. (f,g) Expression of glucose metabolism-related genes (including PDL1) as analyzed by (f) RT-qPCR and (g) immunoblot analysis of GLO1_WT versus GLO1_KO [B40 and C2] cells; bar graph summarizes immunoblot quantifications over β-actin control. For all bar graph depictions, quantitative data analysis employed ANOVA with Tukey's post hoc test; means without a common letter differ from each other (p < 0.05). For bar graphs comparing two groups only, statistical significance was calculated employing the Student's two-tailed t-test (*p < 0.05).
Fig. 4
Fig. 4
Genetic deletion of GLO1 alters redox stress response gene expression in human A375 melanoma cells. (a) RT2 Profiler™ PCR array analysis of redox stress response genes expression (GLO1_KO clones [B40 and C2] relative to GLO1_WT). Volcano plot depicts differential gene expression (cut-off criteria: expression differential ≥ 2; p value ≤ 0.05; filled circles: GLO1_KO [B40]; empty circles: GLO1_KO [C2]). (b–c) Heat map depiction of statistically significant expression changes (log2 fold change) revealing clustered modulation of redox-related genes as a function of GLO1 deletion [as summarized numerically in (c)]. (d) GLO1-modulated ‘oxidative stress response’ as revealed at the single gene expression level (GLO1_WT versus GLO1_KO clones [B40 and C2]): thioredoxin-related: TXN, TXNRD1, TXNRD2, PRDX1, PRDX2; glutathione-related: GSS, GSR, GSTZ1; other antioxidant factors: SRXN1, CAT, SOD3; inflammation: PTGS1. Bar graphs depict fold change (logarithmic or metric scale according to data range). (e) Oxidative stress (GLO1_WT versus GLO1_KO clones [B40 and C2]) as monitored by flow cytometric detection of DCF fluorescence [with or without MG treatment (500 μM, 2h)]. (f) Intracellular reduced glutathione content as assessed by luminescence intensity (GSH-Glo™) normalized to cell number (GLO1_WT versus GLO1_KO clones [B40 and C2]). For all bar graph depictions, quantitative data analysis employed ANOVA with Tukey's post hoc test; means without a common letter differ from each other (p < 0.05).
Fig. 5
Fig. 5
Genetic deletion of GLO1 shortens population doubling time while increasing M-phase cell cycle population and enhancing clonogenicityof human A375 melanoma cells. (a) NanoString nCounterTM pathway score analysis of ‘cell cycle’ and ‘cellular growth’ (top: box plot depiction); single panels (bottom) indicate comparative gene expression [CD24, CDKN1A, CXCL8, FSTL1, IL1A, RRAS]. (b) CDKN1A expression in A375 melanoma (GLO1_WT versus GLO1_KO clones [B40 and C2]) as confirmed by RT-qPCR (left) and immunoblot (right) analysis. Bar graph summarizes protein levels over β-actin control. (c) Alteration of cell cycle and population doubling time: Top panel (left): Representative cell cycle histograms per treatment group as assessed by flow cytometry of PI-stained cells. Top panel (right): Cell cycle distribution as summarized by bar graph depiction. Bottom panel (left): Population shift from G1-towards S- and G2/M-phases as visualized by flow cytometric analysis [PI versus FSC (forward scatter); representative images]. Bottom panel (right): Population doubling time (hr) as determined by proliferation analysis summarized by bar graph depiction. (d) M-phase population assessment as measured by flow cytometry of phospho-histone H3 (Ser10) versus PI-double-stained cells (left panels: representative images); right panel: summary of numerical results as a function of GLO1_KO status. (e) Colony formation was assessed by determining anchorage-independent growth in soft agar; representative images after crystal violet staining (left panels) as summarized by bar graph depiction (right panel). For all bar graph depictions, quantitative data analysis employed ANOVA with Tukey's post hoc test; means without a common letter differ from each other (p < 0.05). For bar graphs comparing two groups only, statistical significance was calculated employing the Student's two-tailed t-test (*p < 0.05). . (For interpretation of the references to colour in this figure legend, the reader is referred to the Web version of this article.)
Fig. 6
Fig. 6
Genomic GLO1 deletion antagonizes EMT-related gene expression with suppression of metastasis in a murine melanoma. (a) NanoString nCounter™ pathway score analysis of ‘EMT to metastasis’, ‘metastasis response’, and ‘metastasis suppression’ (box plot depiction). (b) NanoString nCounter™ single gene depiction of EMT- and metastasis-related gene expression. (c) Invasion through Matrigel-coated Boyden chambers (GLO1_WT; GLO1_KO [B40]); bar graph (left panel) depicts numerical analysis. Left panel also displays MMP9 protein levels in conditioned medium (determined by ELISA analysis); right panel: representative images obtained after crystal violet staining of inserts. (d) Melanoma cells (A375 GLO1_WT; GLO1_KO [B40]) were tail vein injected (five SCID mice per group) followed by analysis of lung metastasis 21 d later (top panel: experimental scheme). Representative lung specimens are depicted (right panels). Bar graph summarizes numerical analysis of metastases per lung (left panel). For bar graphs comparing two groups only, statistical significance was calculated employing the Student's two-tailed t-test (*p < 0.05). Nonparametric data analysis of murine experimentation was performed using the Mann–Whitney test (*p < 0.05). (For interpretation of the references to colour in this figure legend, the reader is referred to the Web version of this article.)
Fig. 7
Fig. 7
Genomic GLO1 deletion accelerates tumor growth in a SCID mouse xenograft model of human A375 malignant melanoma. (a) A375 melanoma cells (three groups: GLO1_WT; GLO1_KO [B40]; GLO1_KO [C2]) were injected subcutaneously (ten mice per group) followed by assessment of tumor growth over a 28 d period; top panel: injection scheme; bottom panel: tumor burden as a function of genotype and time. (b–d) At the end of the experiment, tumors were processed for gene expression analysis by RT-qPCR and immunohistochemical staining. (b) Representative tumor images (dorsal, right flank, s. c.; top panels) with Ki67 immunohistochemical analysis of tumor specimens (bottom panels; 20x magnification) as summarized by bar graph depiction (right panel). (c) Immunohistochemical analysis of tumor specimens (GLO1_WT; GLO1_KO [B40]; 20x magnification); quantitative analysis as summarized by bar graph depiction (right panels). (d) RT-qPCR assessment of gene expression as a function of tumor GLO1 genotype (GLO1_WT; GLO1_KO clones [B40 and C2]). For all bar graph depictions, quantitative data analysis employed ANOVA with Tukey's post hoc test; means without a common letter differ from each other (p < 0.05). For bar graphs comparing two groups only, statistical significance was calculated employing the Student's two-tailed t-test (*p < 0.05). Nonparametric data analysis of murine experimentation was performed using the Mann–Whitney test (*p < 0.05).

References

    1. Paluncic J., Kovacevic Z., Jansson P.J., Kalinowski D., Merlot A.M., Huang M.L., Lok H.C., Sahni S., Lane D.J., Richardson D.R. Roads to melanoma: key pathways and emerging players in melanoma progression and oncogenic signaling. Biochim. Biophys. Acta. 2016;1863:770–784. - PubMed
    1. Luke J.J., Flaherty K.T., Ribas A., Long G.V. Targeted agents and immunotherapies: optimizing outcomes in melanoma. Nat. Rev. Clin. Oncol. 2017;14:463–482. - PubMed
    1. Helgadottir H., Rocha Trocoli Drakensjo I., Girnita A. Personalized medicine in malignant melanoma: towards patient tailored treatment. Front Oncol. 2018;8:202. - PMC - PubMed
    1. Cesi G., Walbrecq G., Zimmer A., Kreis S., Haan C. ROS production induced by BRAF inhibitor treatment rewires metabolic processes affecting cell growth of melanoma cells. Mol. Canc. 2017;16:102. - PMC - PubMed
    1. Ratnikov B.I., Scott D.A., Osterman A.L., Smith J.W., Ronai Z.A. Metabolic rewiring in melanoma. Oncogene. 2017;36:147–157. - PMC - PubMed

Publication types

LinkOut - more resources