. 2021 Mar:34:100430.
doi: 10.1016/j.epidem.2020.100430. Epub 2020 Dec 21.

Chopping the tail: How preventing superspreading can help to maintain COVID-19 control

Affiliations

Chopping the tail: How preventing superspreading can help to maintain COVID-19 control

Morgan P Kain et al. Epidemics. 2021 Mar.

Abstract

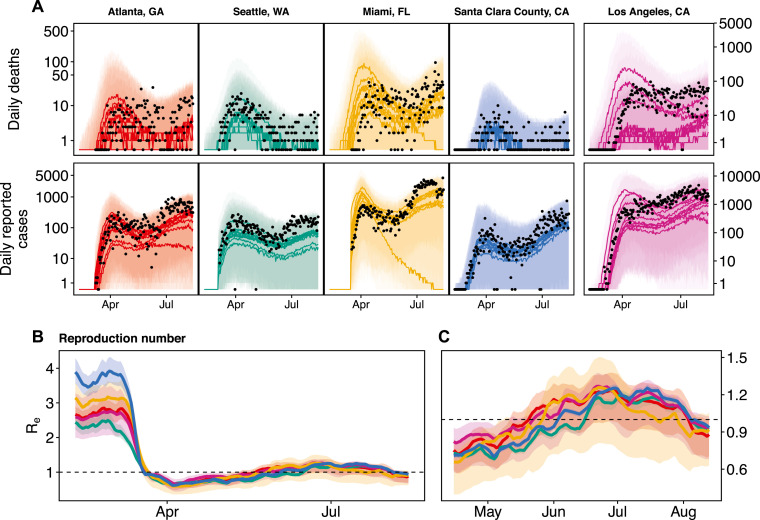
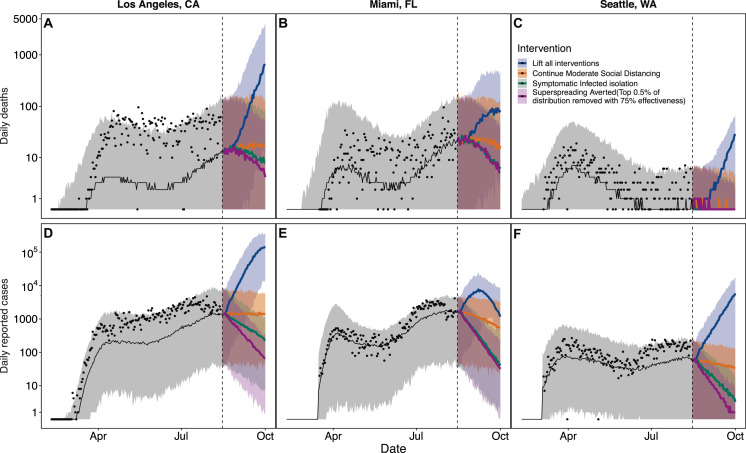
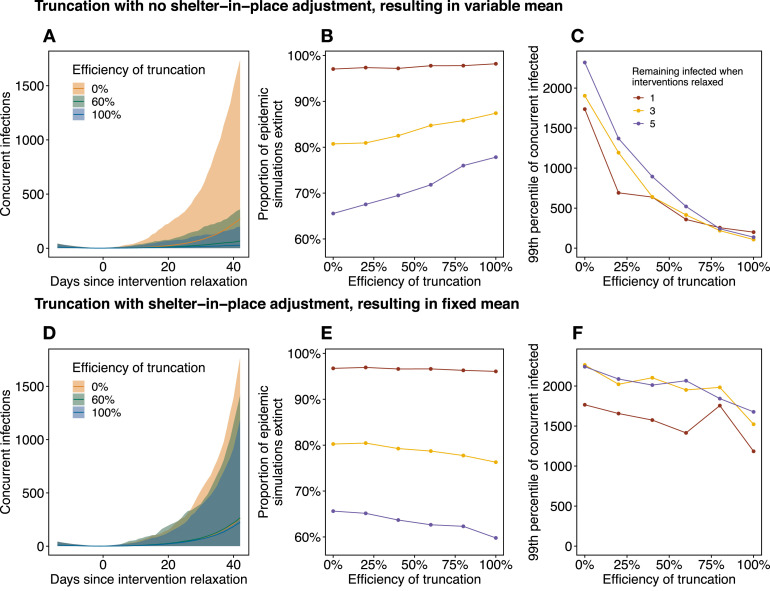
Disease transmission is notoriously heterogeneous, and SARS-CoV-2 is no exception. A skewed distribution where few individuals or events are responsible for the majority of transmission can result in explosive, superspreading events, which produce rapid and volatile epidemic dynamics, especially early or late in epidemics. Anticipating and preventing superspreading events can produce large reductions in overall transmission rates. Here, we present a stochastic compartmental (SEIR) epidemiological model framework for estimating transmission parameters from multiple imperfectly observed data streams, including reported cases, deaths, and mobile phone-based mobility that incorporates individual-level heterogeneity in transmission using previous estimates for SARS-CoV-1 and SARS-CoV-2. We parameterize the model for COVID-19 epidemic dynamics by estimating a time-varying transmission rate that incorporates the impact of non-pharmaceutical intervention strategies that change over time, in five epidemiologically distinct settings-Los Angeles and Santa Clara Counties, California; Seattle (King County), Washington; Atlanta (Dekalb and Fulton Counties), Georgia; and Miami (Miami-Dade County), Florida. We find that the effective reproduction number (RE) dropped below 1 rapidly in all five locations following social distancing orders in mid-March, 2020, but that gradually increasing mobility starting around mid-April led to an RE once again above 1 in late May (Los Angeles, Miami, and Atlanta) or early June (Santa Clara County and Seattle). However, we find that increased social distancing starting in mid-July in response to epidemic resurgence once again dropped RE below 1 in all locations by August 14. We next used the fitted model to ask: how does truncating the individual-level transmission rate distribution (which removes periods of time with especially high individual transmission rates and thus models superspreading events) affect epidemic dynamics and control? We find that interventions that truncate the transmission rate distribution while partially relaxing social distancing are broadly effective, with impacts on epidemic growth on par with the strongest population-wide social distancing observed in April, 2020. Given that social distancing interventions will be needed to maintain epidemic control until a vaccine becomes widely available, "chopping off the tail" to reduce the probability of superspreading events presents a promising option to alleviate the need for extreme general social distancing.


Conflict of interest statement

The authors declare that they have no known competing financial interests or personal relationships that could have appeared to influence the work reported in this paper.

Figures

Fig. 1
Fig. 1
Model estimated daily deaths and reported cases (A), and reproduction number (B, C) for five locations: Atlanta (red), Seattle (green), Miami (gold), Santa Clara County (blue), and Los Angeles (purple). Los Angeles is displayed on a different y-axis due to differences in magnitude of reported deaths and cases. For each county, we show the 10 model fits with the best log likelihoods. Panel C show the same results pictured in B, but are zoomed in to April 15–Aug 14 to better show the dynamics around RE=1. Black points are observed daily deaths (A, top row) and reported cases (A, bottom row) in each county. Solid lines display median of model simulated trajectories (A) and mean of 7-day smoothed RE (B, C). Ribbons overlay the central 95% of all stochastic simulations for each of the 10 best-fit parameter sets for epidemic dynamics (A) and full range of estimated RE (B, C) over the 10 best-fit parameter sets. We highlight the large differences in stochastic epidemic trajectories for the single best parameter set in Figure S8. Vertical axes in panel A are pseudo-log transformed for visibility. Goodness of fit (R2 values) and log likelihoods for each of these fits are given in Figure S9 and Table S1 respectively . (For interpretation of the references to color in this figure legend, the reader is referred to the web version of this article.)
Fig. 2
Fig. 2
Maintaining strong social distancing (orange), test-and-isolate with intermediate social distancing (green), or superspreading aversion with intermediate social distancing (purple) are necessary over long periods to prevent a major epidemic resurgence (blue) in each location where we fit our model. Daily deaths are shown in (A - C) and daily reported cases are shown in (D - F). Continuing social distancing at the levels seen as of August 14 (orange) will lead to nearly steady daily reported cases and deaths in Los Angeles, CA (A, D), and slow declines in cases and deaths in Miami, FL (B, E) and Seattle, WA (C, F) due to estimated Re very near one. For both test-and-isolate and truncation interventions we assume an intermediate level of mobility (an average of baseline mobility prior to the first shelter-in-place orders and final mobility levels observed in the last week of data). Bands show the central 95% of stochastic simulations of daily cases and deaths for the single maximum likelihood parameter set and solid lines show the median among simulations. Dates range from February through October of 2020. Vertical axes are pseudo-log transformed for visibility. (For interpretation of the references to color in this figure legend, the reader is referred to the web version of this article.)
Fig. 3
Fig. 3
Example of how truncating the individual-level transmission rate distribution, π, (A) affects the population-average transmission rate (B), and combinations of pSIP and truncation strategies that reduce RE to one in a fully susceptible population (C). The three panels in C show the combinations of truncation and pSIP that produce an RE of one for three levels of truncation efficiency. (A) Truncation at the upper 0.1% of π (sampled over a 4-hour time step), in which truncation occurs with 100% efficiency for values above the dashed line. (B) Resulting effect on the population-level average infection rate when there are 1000 infected people currently in the population, where the original distribution is in red and the truncated distribution is in blue. The distribution is shown over 10,000 simulations for a population characterized by an individual reproduction number distribution with mean of 2.5 and overdispersion parameter, k=0.16. Horizontal and vertical axes in A and B are square root transformed for visibility. In C, the triangles show baseline pSIP in each location and circles show max pSIP reached during social distancing. Solid lines indicate the mean over the ten best fits, and the ribbon is the full range of estimates from these fits. (For interpretation of the references to color in this figure legend, the reader is referred to the web version of this article.)
Fig. 4
Fig. 4
Effects of transmission rate truncation on epidemic die-out and explosive resurgence. With skewed individual variation in transmission rate, relaxing social distancing interventions when infections become rare (allowing RE to increase above one) may lead to explosive stochastic epidemic resurgence. Top panels (A–C) show the overall effect of truncation interventions, including effects on both the mean and shape of the transmission rate distribution, and resulting RE. Bottom panels (D–F) show the effect of truncation when RE is held constant by rescaling pSIP at the time of intervention relaxation. Specifically, for a 0% truncation efficiency we simulate epidemic resurgence assuming R0=2, which results in an RE=2SN at the time of resurgence, which will vary by simulation (where S is the number of susceptible individuals and N is the total population size). In panels (A–C) as truncation efficiency increases RE decreases; in panels (D–E) we scale pSIP to retain an average RE=2SN across truncations. Simulations are performed with varying efficiencies of truncation of the top 0.1% of the π distribution. Envelopes in (A) and (D) show the central 98% of resurgent simulations (across 10,000 total simulations) for three efficiencies of truncation (0% in orange, 60% in green, 100% in blue). The proportion of epidemic simulations that go extinct within 42 days of intervention relaxation for thresholds of 1 (red), 3 (gold), and 5 (blue) infected individuals is shown in (B) and (E). The upper 99th percentile of concurrent infections 42 days after intervention relaxation in resurgent simulations for the same thresholds is shown in (C) and (F).

Update of

Similar articles

Cited by

References

    1. Adam D., Wu P., Wong J., Lau E., Tsang T., Cauchemez S., Leung G., Cowling B. Clustering and superspreading potential of severe acute respiratory syndrome coronavirus 2 (SARS-CoV-2) infections in Hong Kong. Res. Square. 2020 doi: 10.21203/rs.3.rs-29548/v1. Available from: https://doi.org/10.21203/rs.3.rs-29548/v1. - DOI - PubMed
    1. Althouse B.M., Wenger E.A., Miller J.C., Scarpino S.V., Allard A., Hé-Dufresne L., Hu H. 2020. Stochasticity and heterogeneity in the transmission dynamics of SARS-CoV-2. Available from: https://covid.idmod.org/data/Stochasticity_heterogeneity_transmission_dy.... - PMC - PubMed
    1. Anderson D., Watson R. On the spread of a disease with gamma distributed latent and infectious periods. Biometrika. 1980;67(1):191–198.
    1. Arons M.M., Hatfield K.M., Reddy S.C., Kimball A., James A., Jacobs J.R., Taylor J., Spicer K., Bardossy A.C., Oakley L.P., et al. Presymptomatic SARS-CoV-2 infections and transmission in a skilled nursing facility. New England J. Med. 2020;382:2081–2090. - PMC - PubMed
    1. Benzell S.G., Collis A., Nicolaides C. Rationing social contact during the COVID-19 pandemic: Transmission risk and social benefits of US locations. Proc. Natl. Acad. Sci. 2020 Available from: https://www.pnas.org/content/early/2020/06/09/2008025117. - PMC - PubMed

Publication types