Contrast-Free Detection of Focused Ultrasound-Induced Blood-Brain Barrier Opening Using Diffusion Tensor Imaging
- PMID: 33360980
- PMCID: PMC8225708
- DOI: 10.1109/TBME.2020.3047575
Contrast-Free Detection of Focused Ultrasound-Induced Blood-Brain Barrier Opening Using Diffusion Tensor Imaging
Abstract
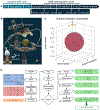
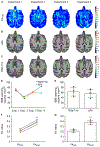
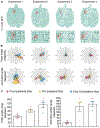
Focused ultrasound (FUS) has emerged as a non-invasive technique to locally and reversibly disrupt the blood-brain barrier (BBB). Here, we investigate the use of diffusion tensor imaging (DTI) as a means of detecting FUS-induced BBB opening at the absence of an MRI contrast agent. A non-human primate (NHP) was repeatedly treated with FUS and preformed circulating microbubbles to transiently disrupt the BBB (n = 4). T1- and diffusion-weighted MRI scans were acquired after the ultrasound treatment, with and without gadolinium-based contrast agent, respectively. Both scans were registered with a high-resolution T1-weighted scan of the NHP to investigate signal correlations. DTI detected an increase in fractional anisotropy from 0.21 ± 0.02 to 0.38 ± 0.03 (82.6 ± 5.2% change) within the targeted area one hour after BBB opening. Enhanced DTI contrast overlapped by 77.22 ± 9.2% with hyper-intense areas of gadolinium-enhanced T1-weighted scans, indicating diffusion anisotropy enhancement only within the BBB opening volume. Diffusion was highly anisotropic and unidirectional within the treated brain region, as indicated by the direction of the principal diffusion eigenvectors. Polar and azimuthal angle ranges decreased by 35.6% and 82.4%, respectively, following BBB opening. Evaluation of the detection methodology on a second NHP (n = 1) confirmed the across-animal feasibility of the technique. In conclusion, DTI may be used as a contrast-free MR imaging modality in lieu of contrast-enhanced T1 mapping for detecting BBB opening during focused-ultrasound treatment or evaluating BBB integrity in brain-related pathologies.
Figures


Similar articles
-
Contrast-enhanced ultrasound imaging for the detection of focused ultrasound-induced blood-brain barrier opening.Theranostics. 2014 Aug 1;4(10):1014-25. doi: 10.7150/thno.9575. eCollection 2014. Theranostics. 2014. PMID: 25161701 Free PMC article.
-
Focused Ultrasound-Induced Blood-Brain Barrier Opening: Association with Mechanical Index and Cavitation Index Analyzed by Dynamic Contrast-Enhanced Magnetic-Resonance Imaging.Sci Rep. 2016 Sep 15;6:33264. doi: 10.1038/srep33264. Sci Rep. 2016. PMID: 27630037 Free PMC article.
-
Paramagnetic perfluorocarbon-filled albumin-(Gd-DTPA) microbubbles for the induction of focused-ultrasound-induced blood-brain barrier opening and concurrent MR and ultrasound imaging.Phys Med Biol. 2012 May 7;57(9):2787-802. doi: 10.1088/0031-9155/57/9/2787. Epub 2012 Apr 18. Phys Med Biol. 2012. PMID: 22510713
-
Applications of focused ultrasound-mediated blood-brain barrier opening.Adv Drug Deliv Rev. 2022 Dec;191:114583. doi: 10.1016/j.addr.2022.114583. Epub 2022 Oct 19. Adv Drug Deliv Rev. 2022. PMID: 36272635 Free PMC article. Review.
-
Focused ultrasound-mediated drug delivery through the blood-brain barrier.Expert Rev Neurother. 2015 May;15(5):477-91. doi: 10.1586/14737175.2015.1028369. Expert Rev Neurother. 2015. PMID: 25936845 Free PMC article. Review.
Cited by
-
Low-Intensity Focused Ultrasound Technique in Glioblastoma Multiforme Treatment.Front Oncol. 2022 May 19;12:903059. doi: 10.3389/fonc.2022.903059. eCollection 2022. Front Oncol. 2022. PMID: 35677164 Free PMC article. Review.
-
Overcoming Barriers in Glioblastoma-Advances in Drug Delivery Strategies.Cells. 2024 Jun 7;13(12):998. doi: 10.3390/cells13120998. Cells. 2024. PMID: 38920629 Free PMC article. Review.
-
Alteration of Water Exchange Rates Following Focused Ultrasound-Mediated BBB Opening in the Dorsal Striatum of Non-Human Primates: A Diffusion-Prepared pCASL Study.bioRxiv [Preprint]. 2025 Aug 1:2025.07.29.667530. doi: 10.1101/2025.07.29.667530. bioRxiv. 2025. PMID: 40766706 Free PMC article. Preprint.
-
Deep Learning Enables Reduced Gadolinium Dose for Contrast-Enhanced Blood-Brain Barrier Opening.ArXiv [Preprint]. 2023 Jan 18:arXiv:2301.07248v1. ArXiv. 2023. PMID: 36713234 Free PMC article. Preprint.
-
Localized Modification of Water Molecule Transport After Focused Ultrasound-Induced Blood-Brain Barrier Disruption in Rat Brain.Front Neurosci. 2021 Jul 29;15:685977. doi: 10.3389/fnins.2021.685977. eCollection 2021. Front Neurosci. 2021. PMID: 34393708 Free PMC article.
References
-
- Abbott NJ, Patabendige AAK, Dolman DEM, Yusof SR, and Begley DJ, “Structure and function of the blood-brain barrier.,” Neurobiol. Dis, vol. 37, no. 1, pp. 13–25, Jan. 2010. - PubMed
-
- Zlokovic BV, “The blood-brain barrier in health and chronic neurodegenerative disorders.,” Neuron, vol. 57, no. 2, pp. 178–201, Jan. 2008. - PubMed
-
- Doolittle ND et al., “Safety and efficacy of a multicenter study using intraarterial chemotherapy in conjunction with osmotic opening of the blood-brain barrier for the treatment of patients with malignant brain tumors.,” Cancer, vol. 88, no. 3, pp. 637–47, Feb. 2000. - PubMed
-
- Kroll RA and Neuwelt EA, “Outwitting the blood-brain barrier for therapeutic purposes: Osmotic opening and other means,” Neurosurgery, vol. 42, no. 5. pp. 1083–1100, May-1998. - PubMed

