. 2020 Dec 24;4(2):e202000955.
doi: 10.26508/lsa.202000955. Print 2021 Feb.

Profiling of immune dysfunction in COVID-19 patients allows early prediction of disease progression

Affiliations

Profiling of immune dysfunction in COVID-19 patients allows early prediction of disease progression

André F Rendeiro et al. Life Sci Alliance. .

Abstract

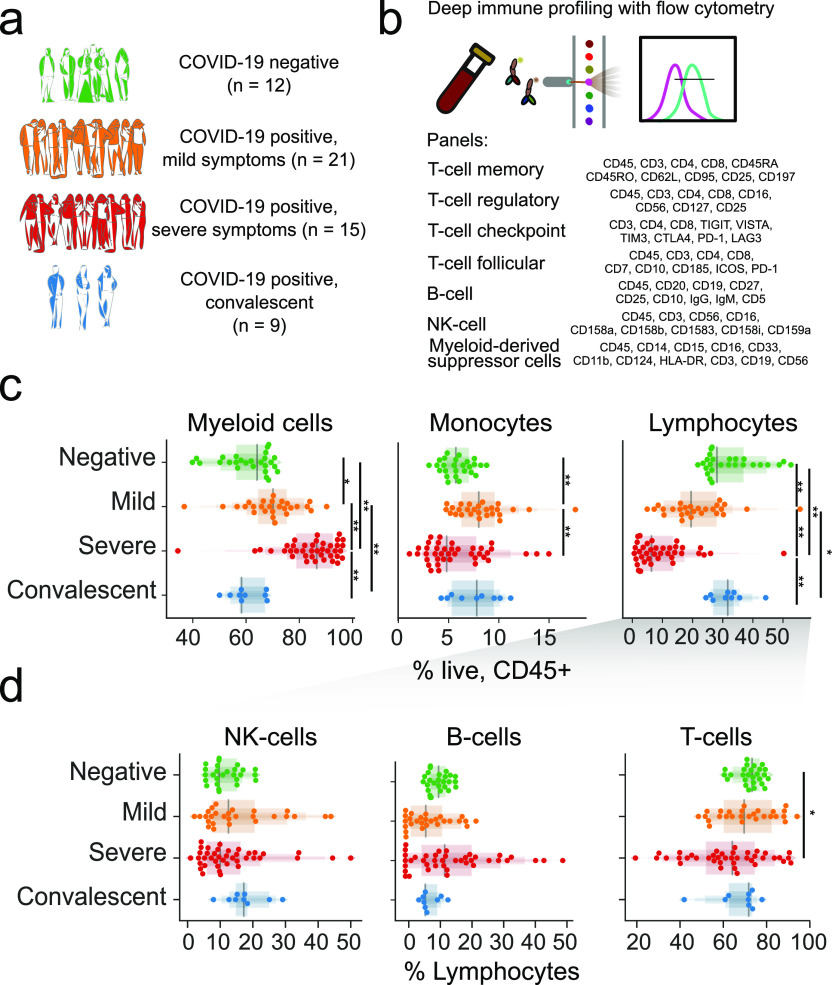
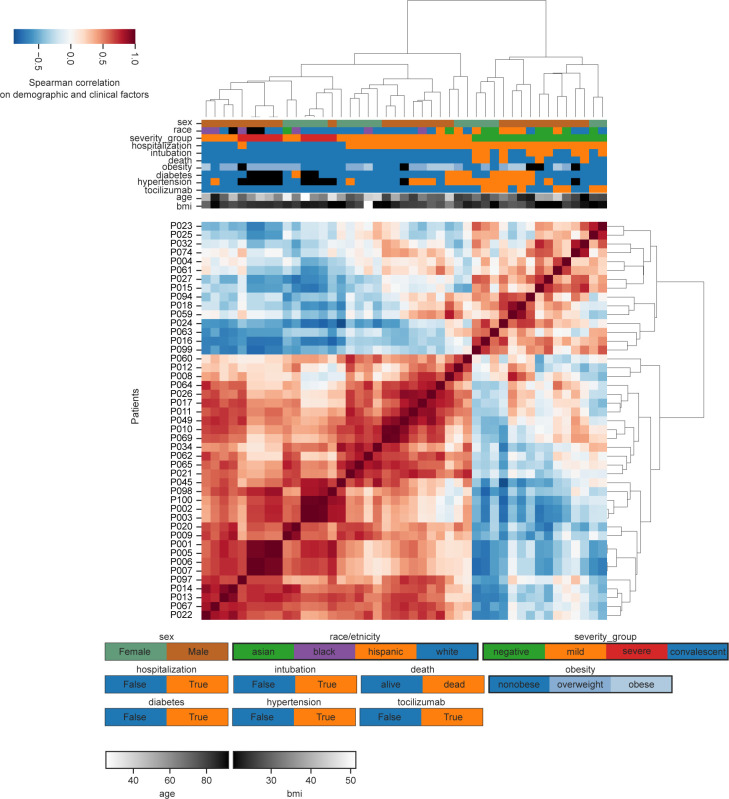
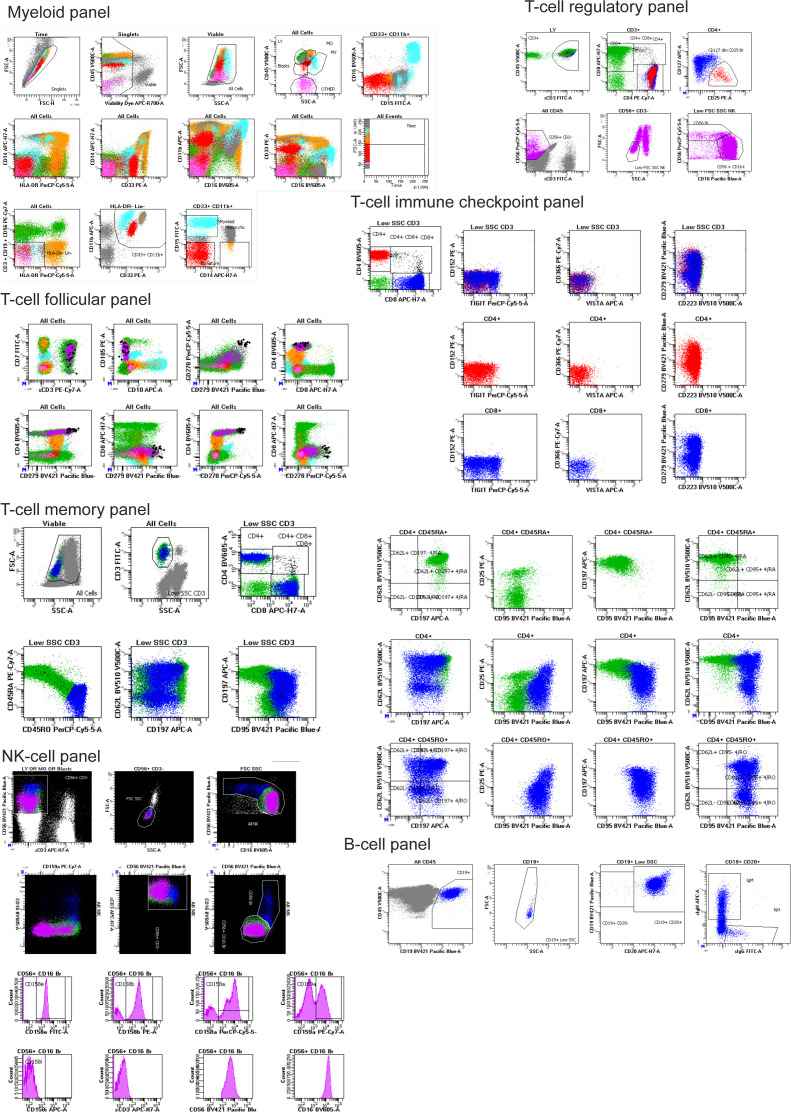
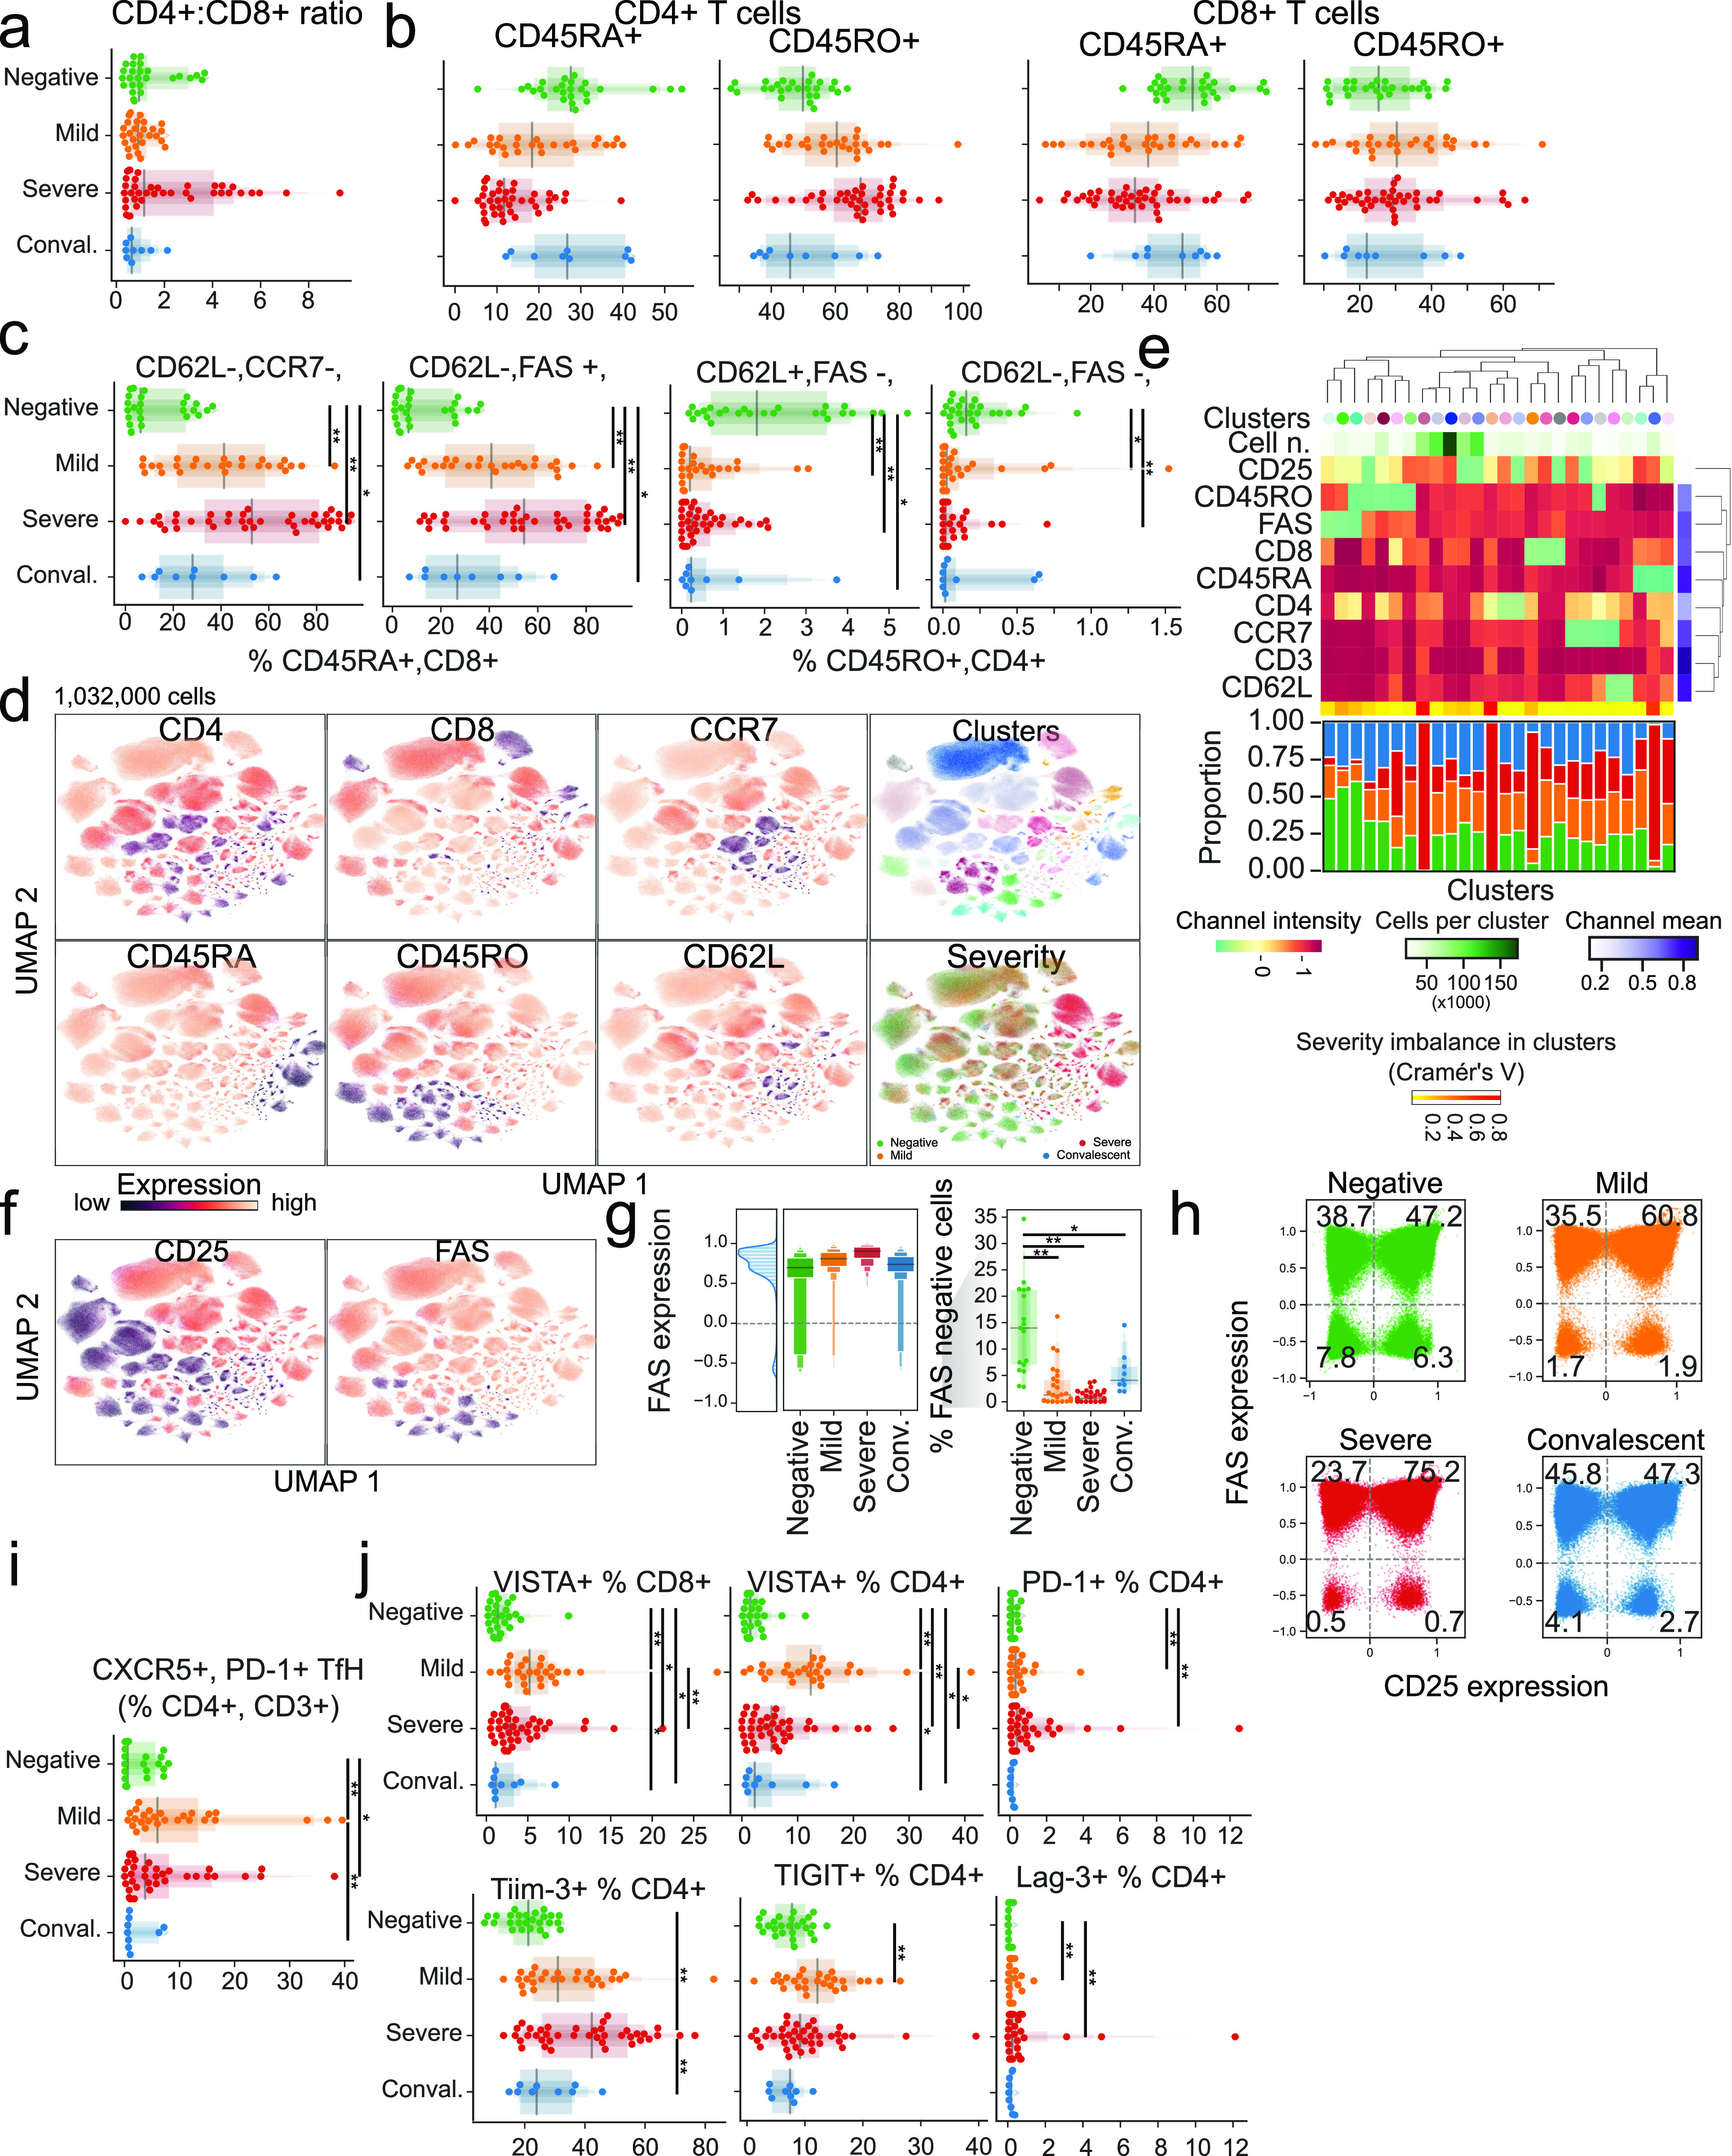
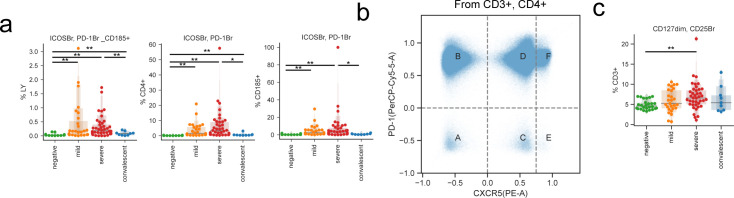
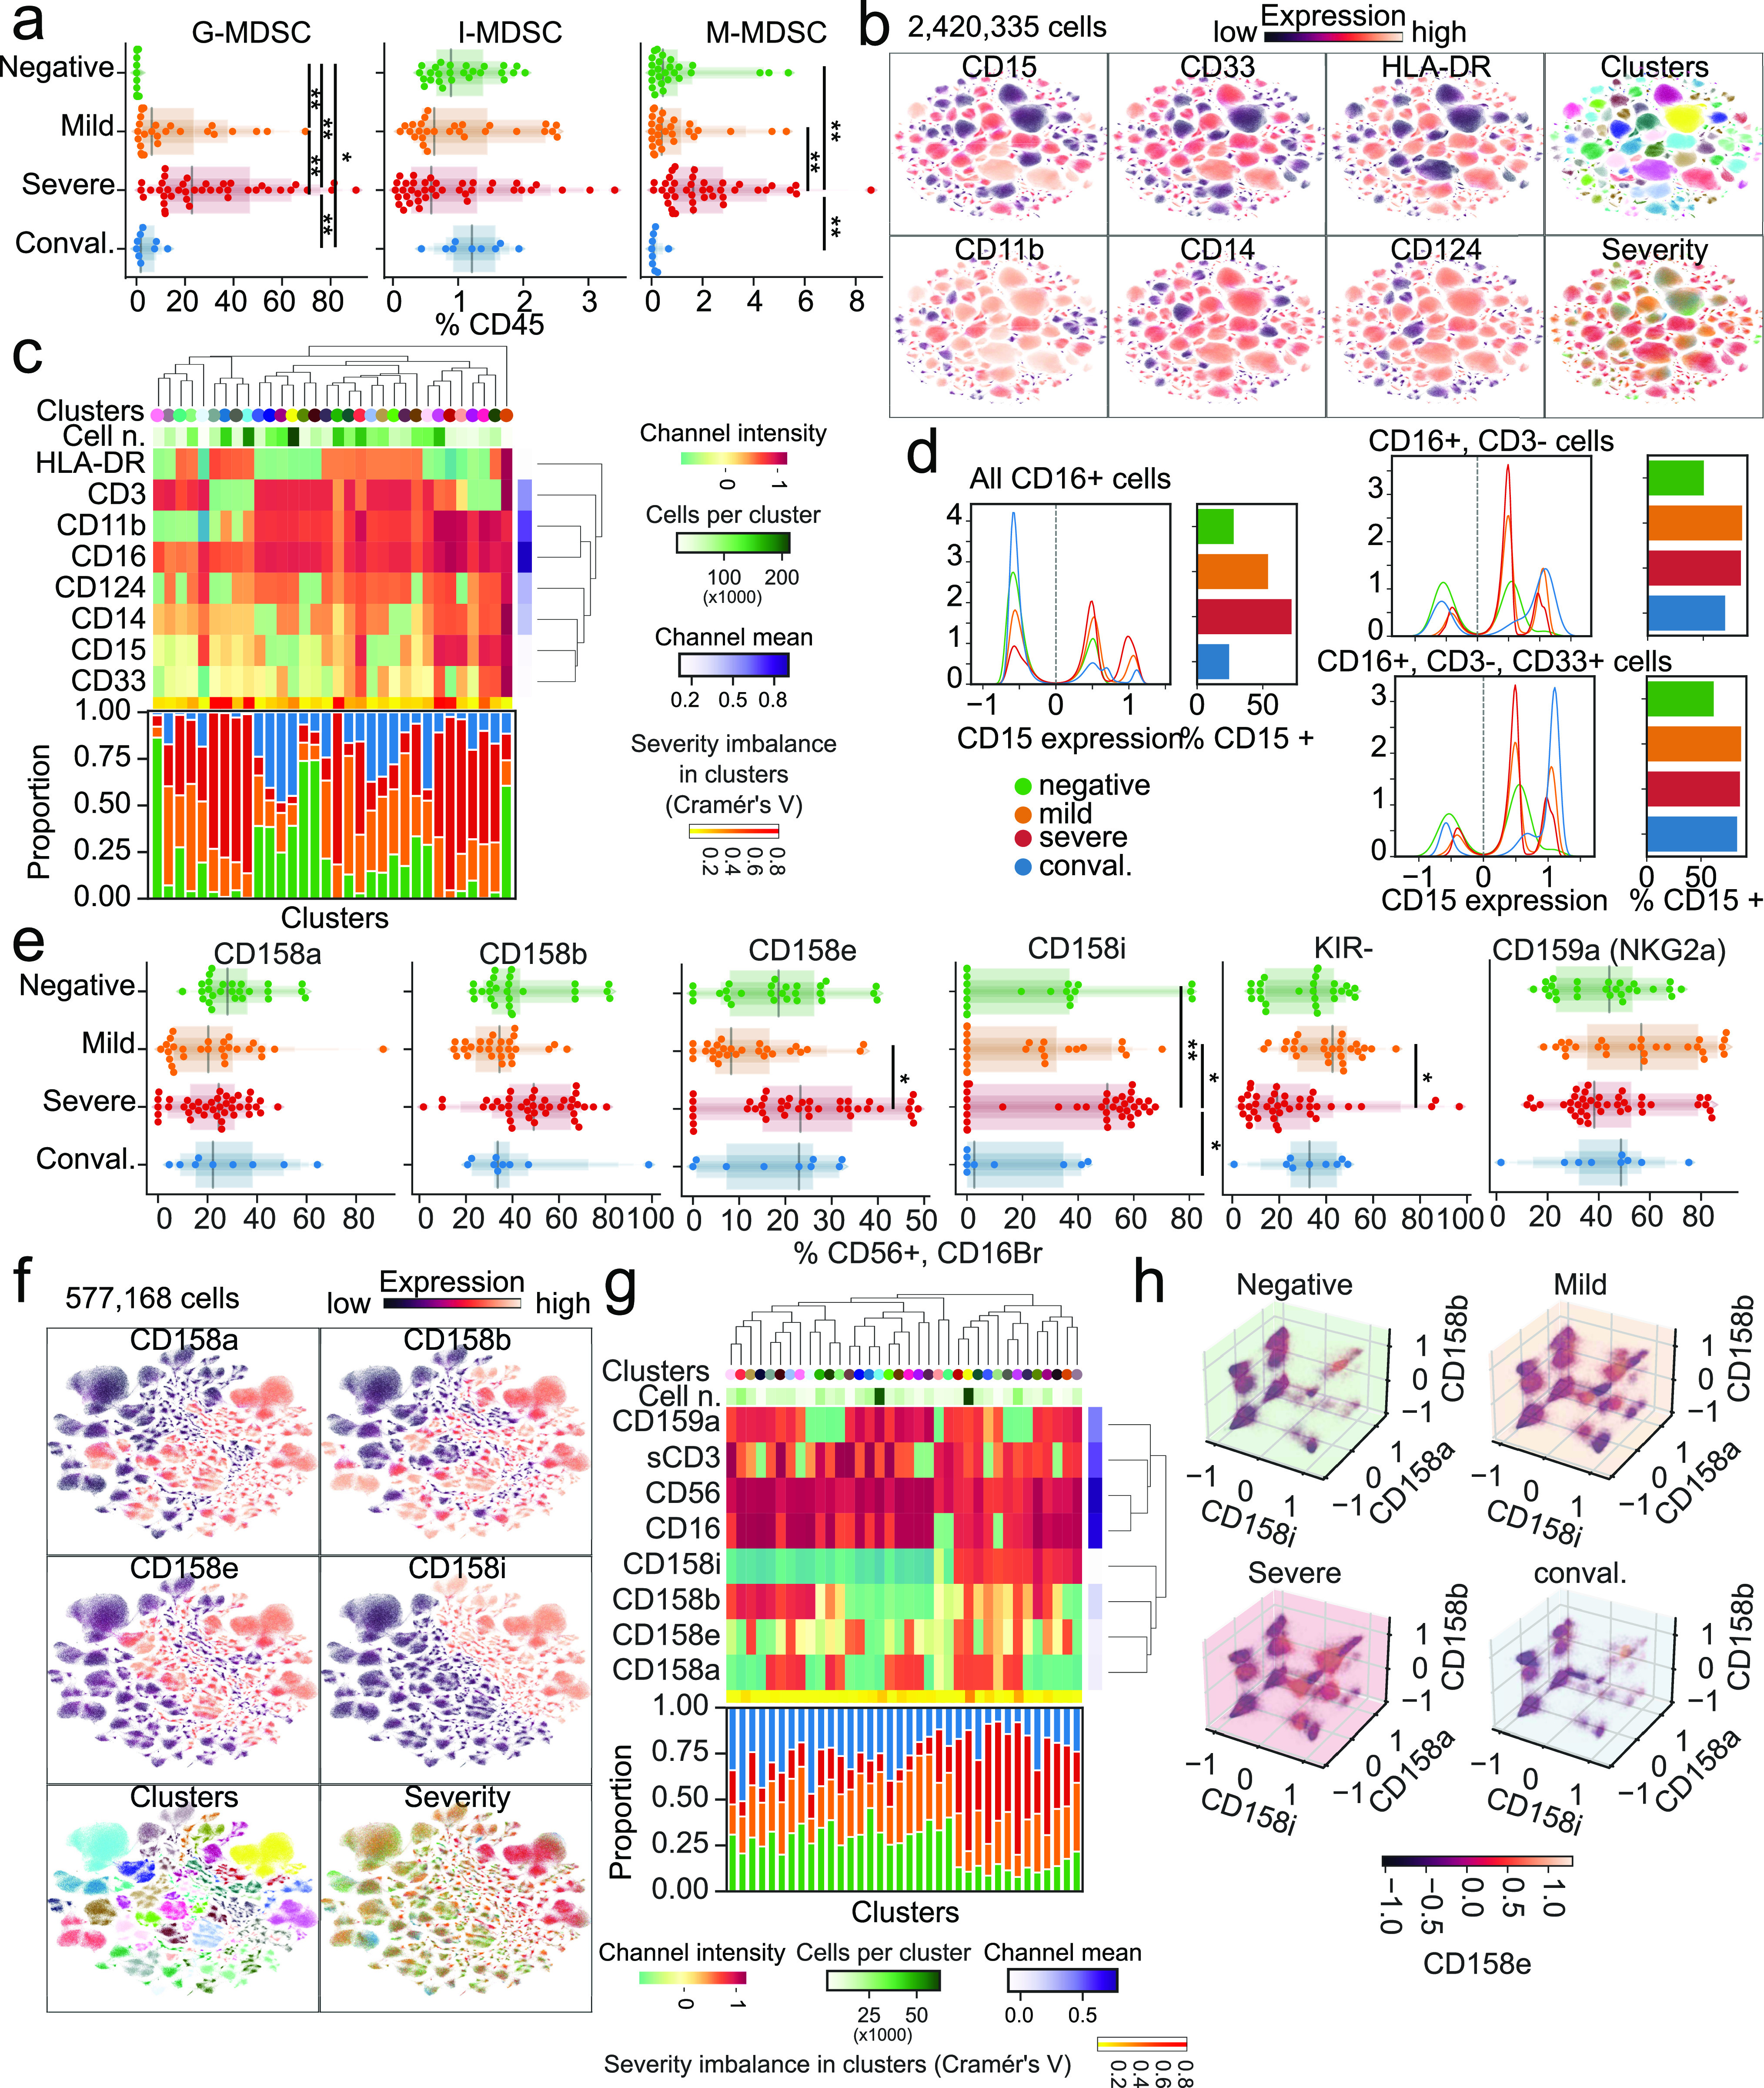
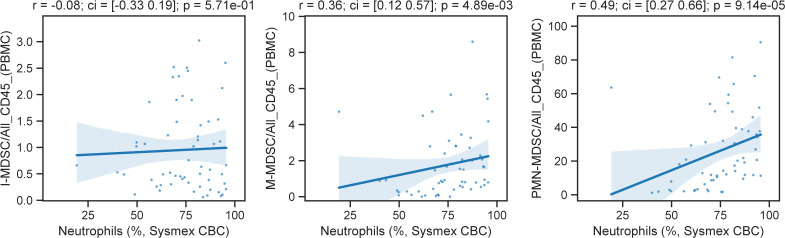
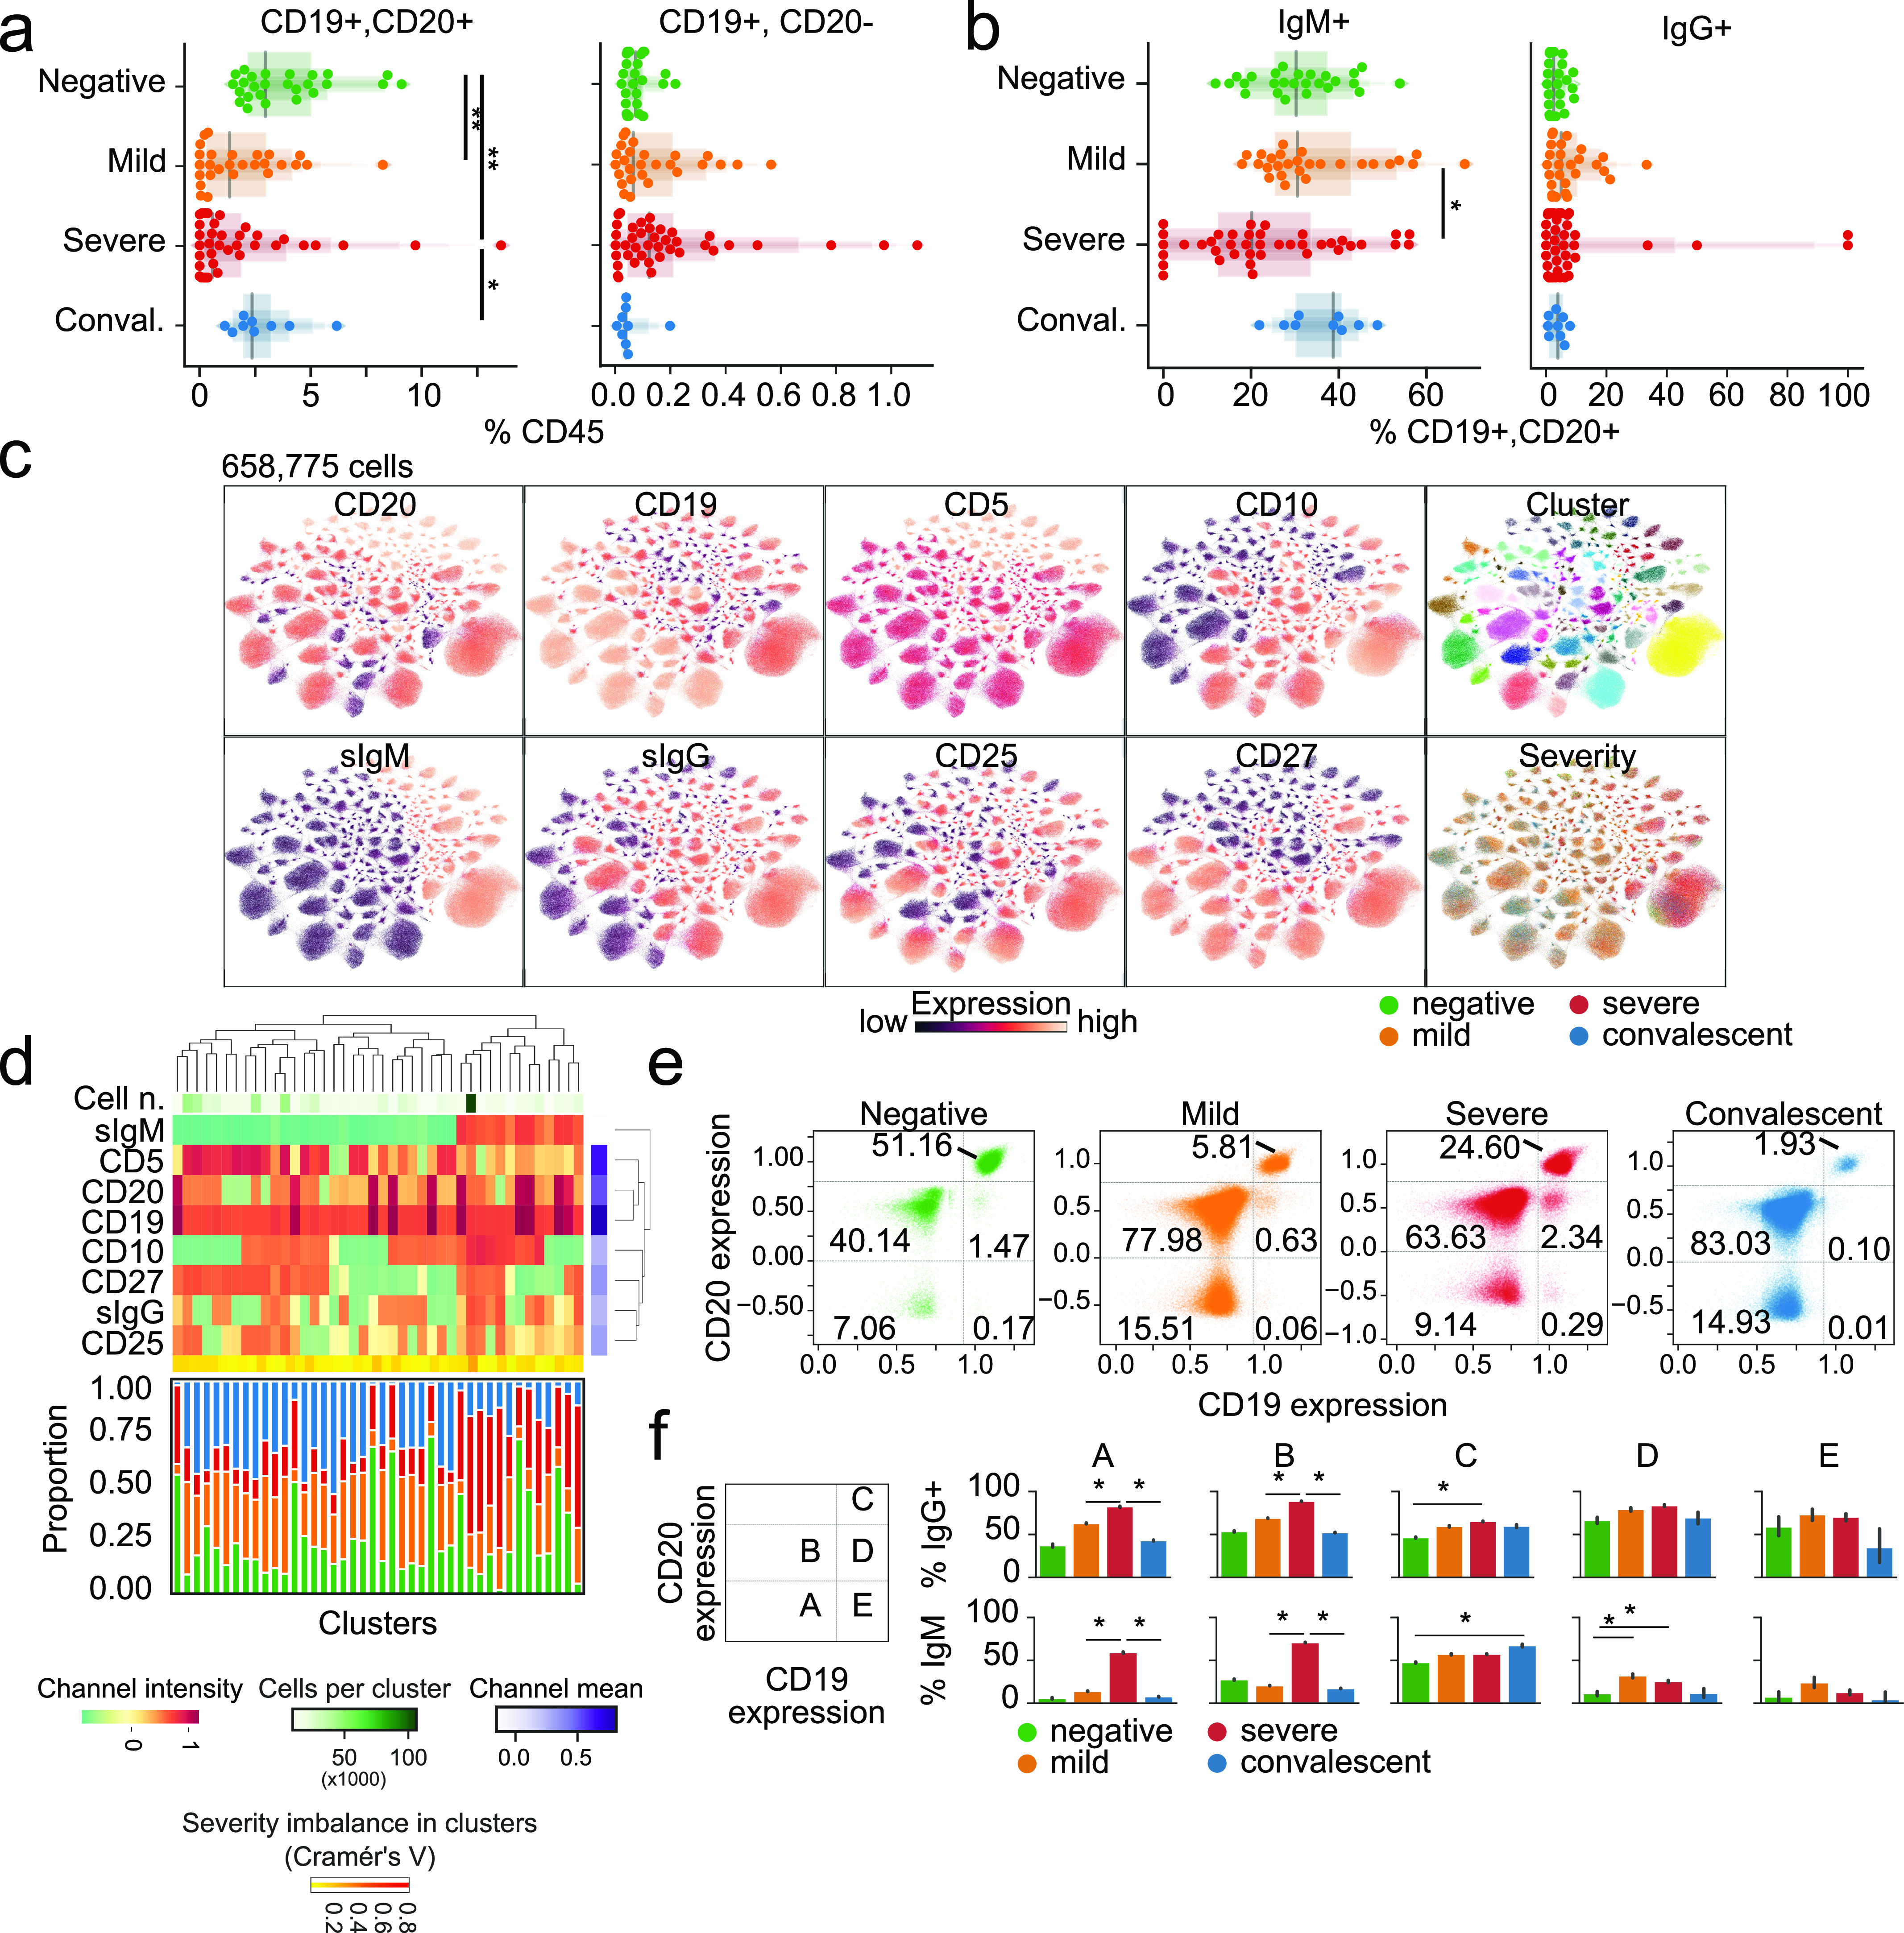
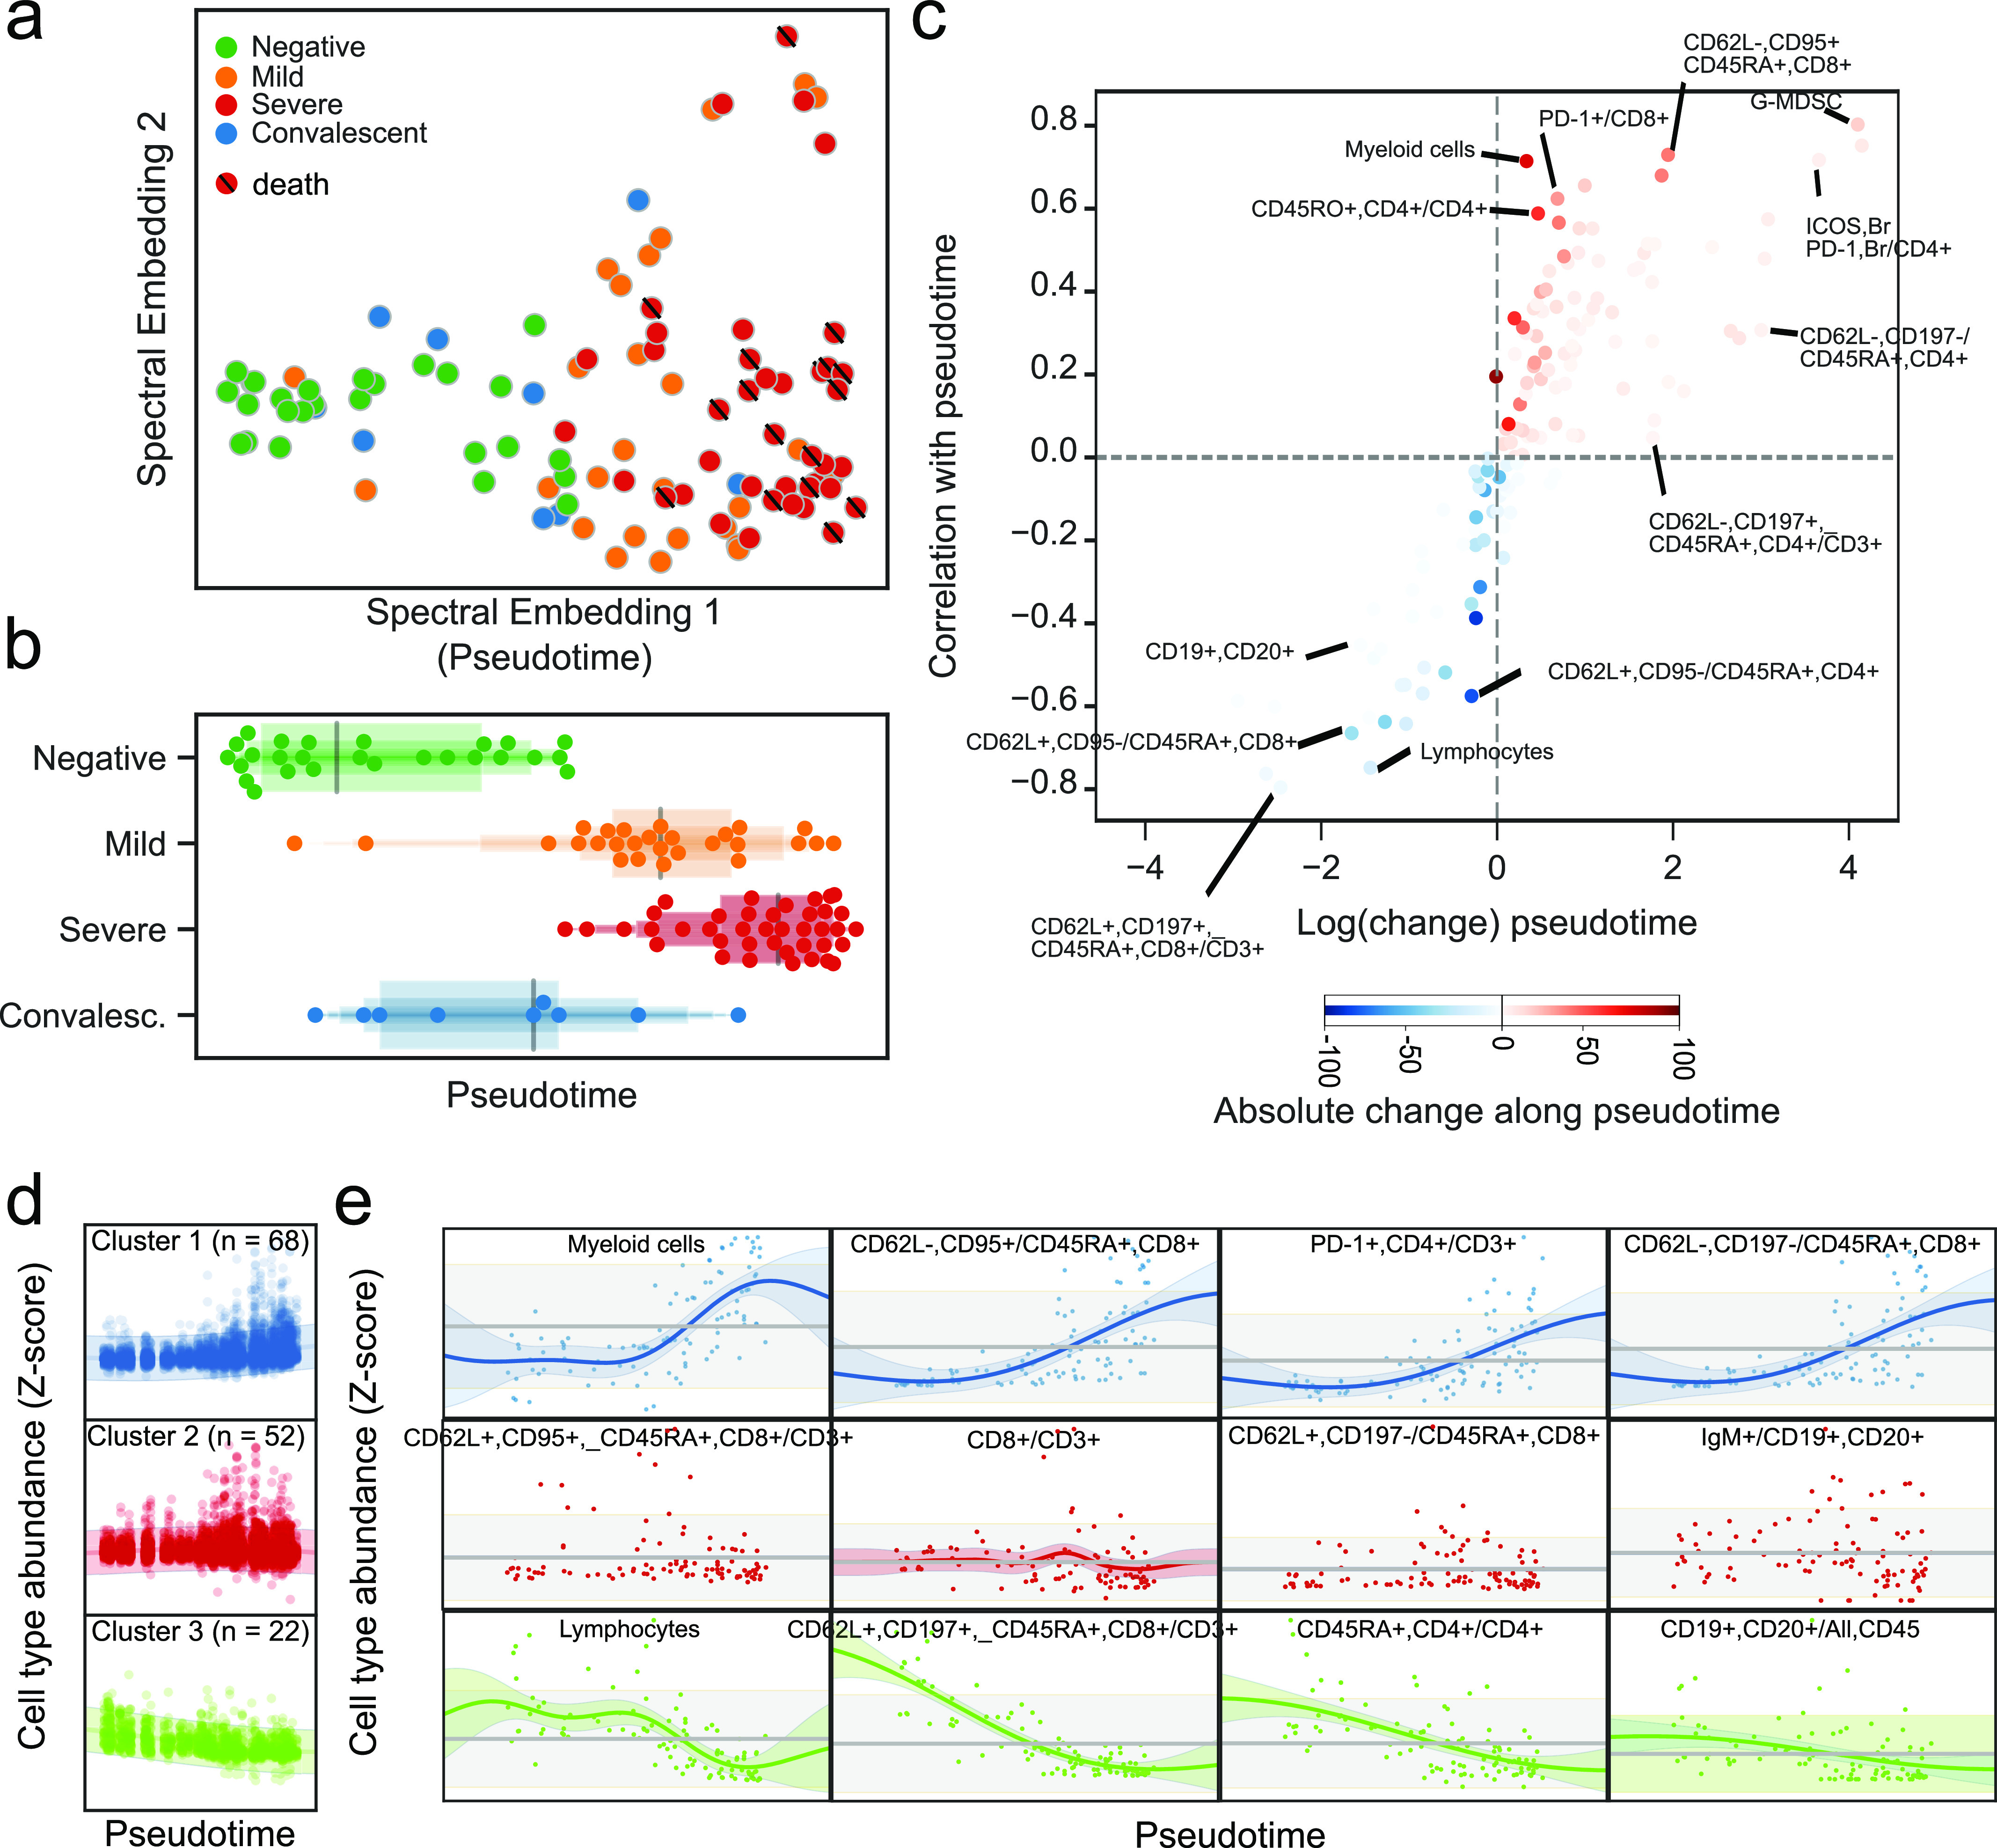
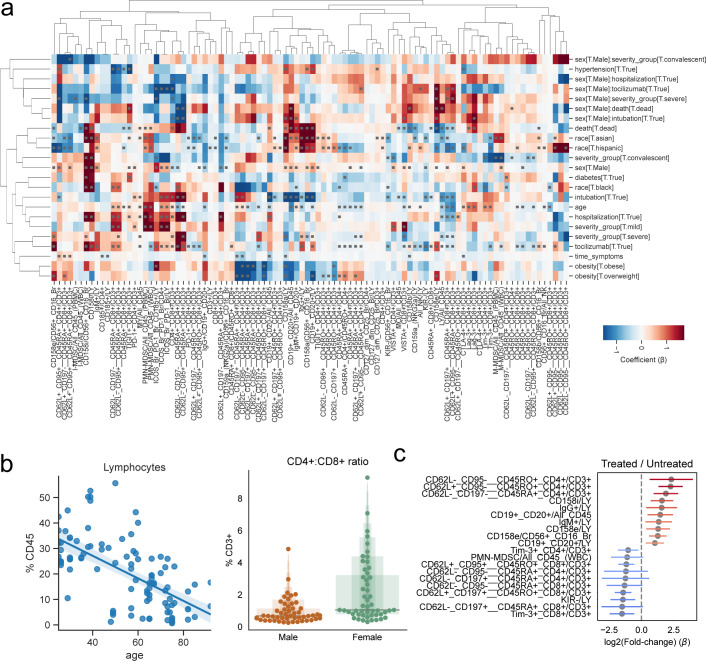
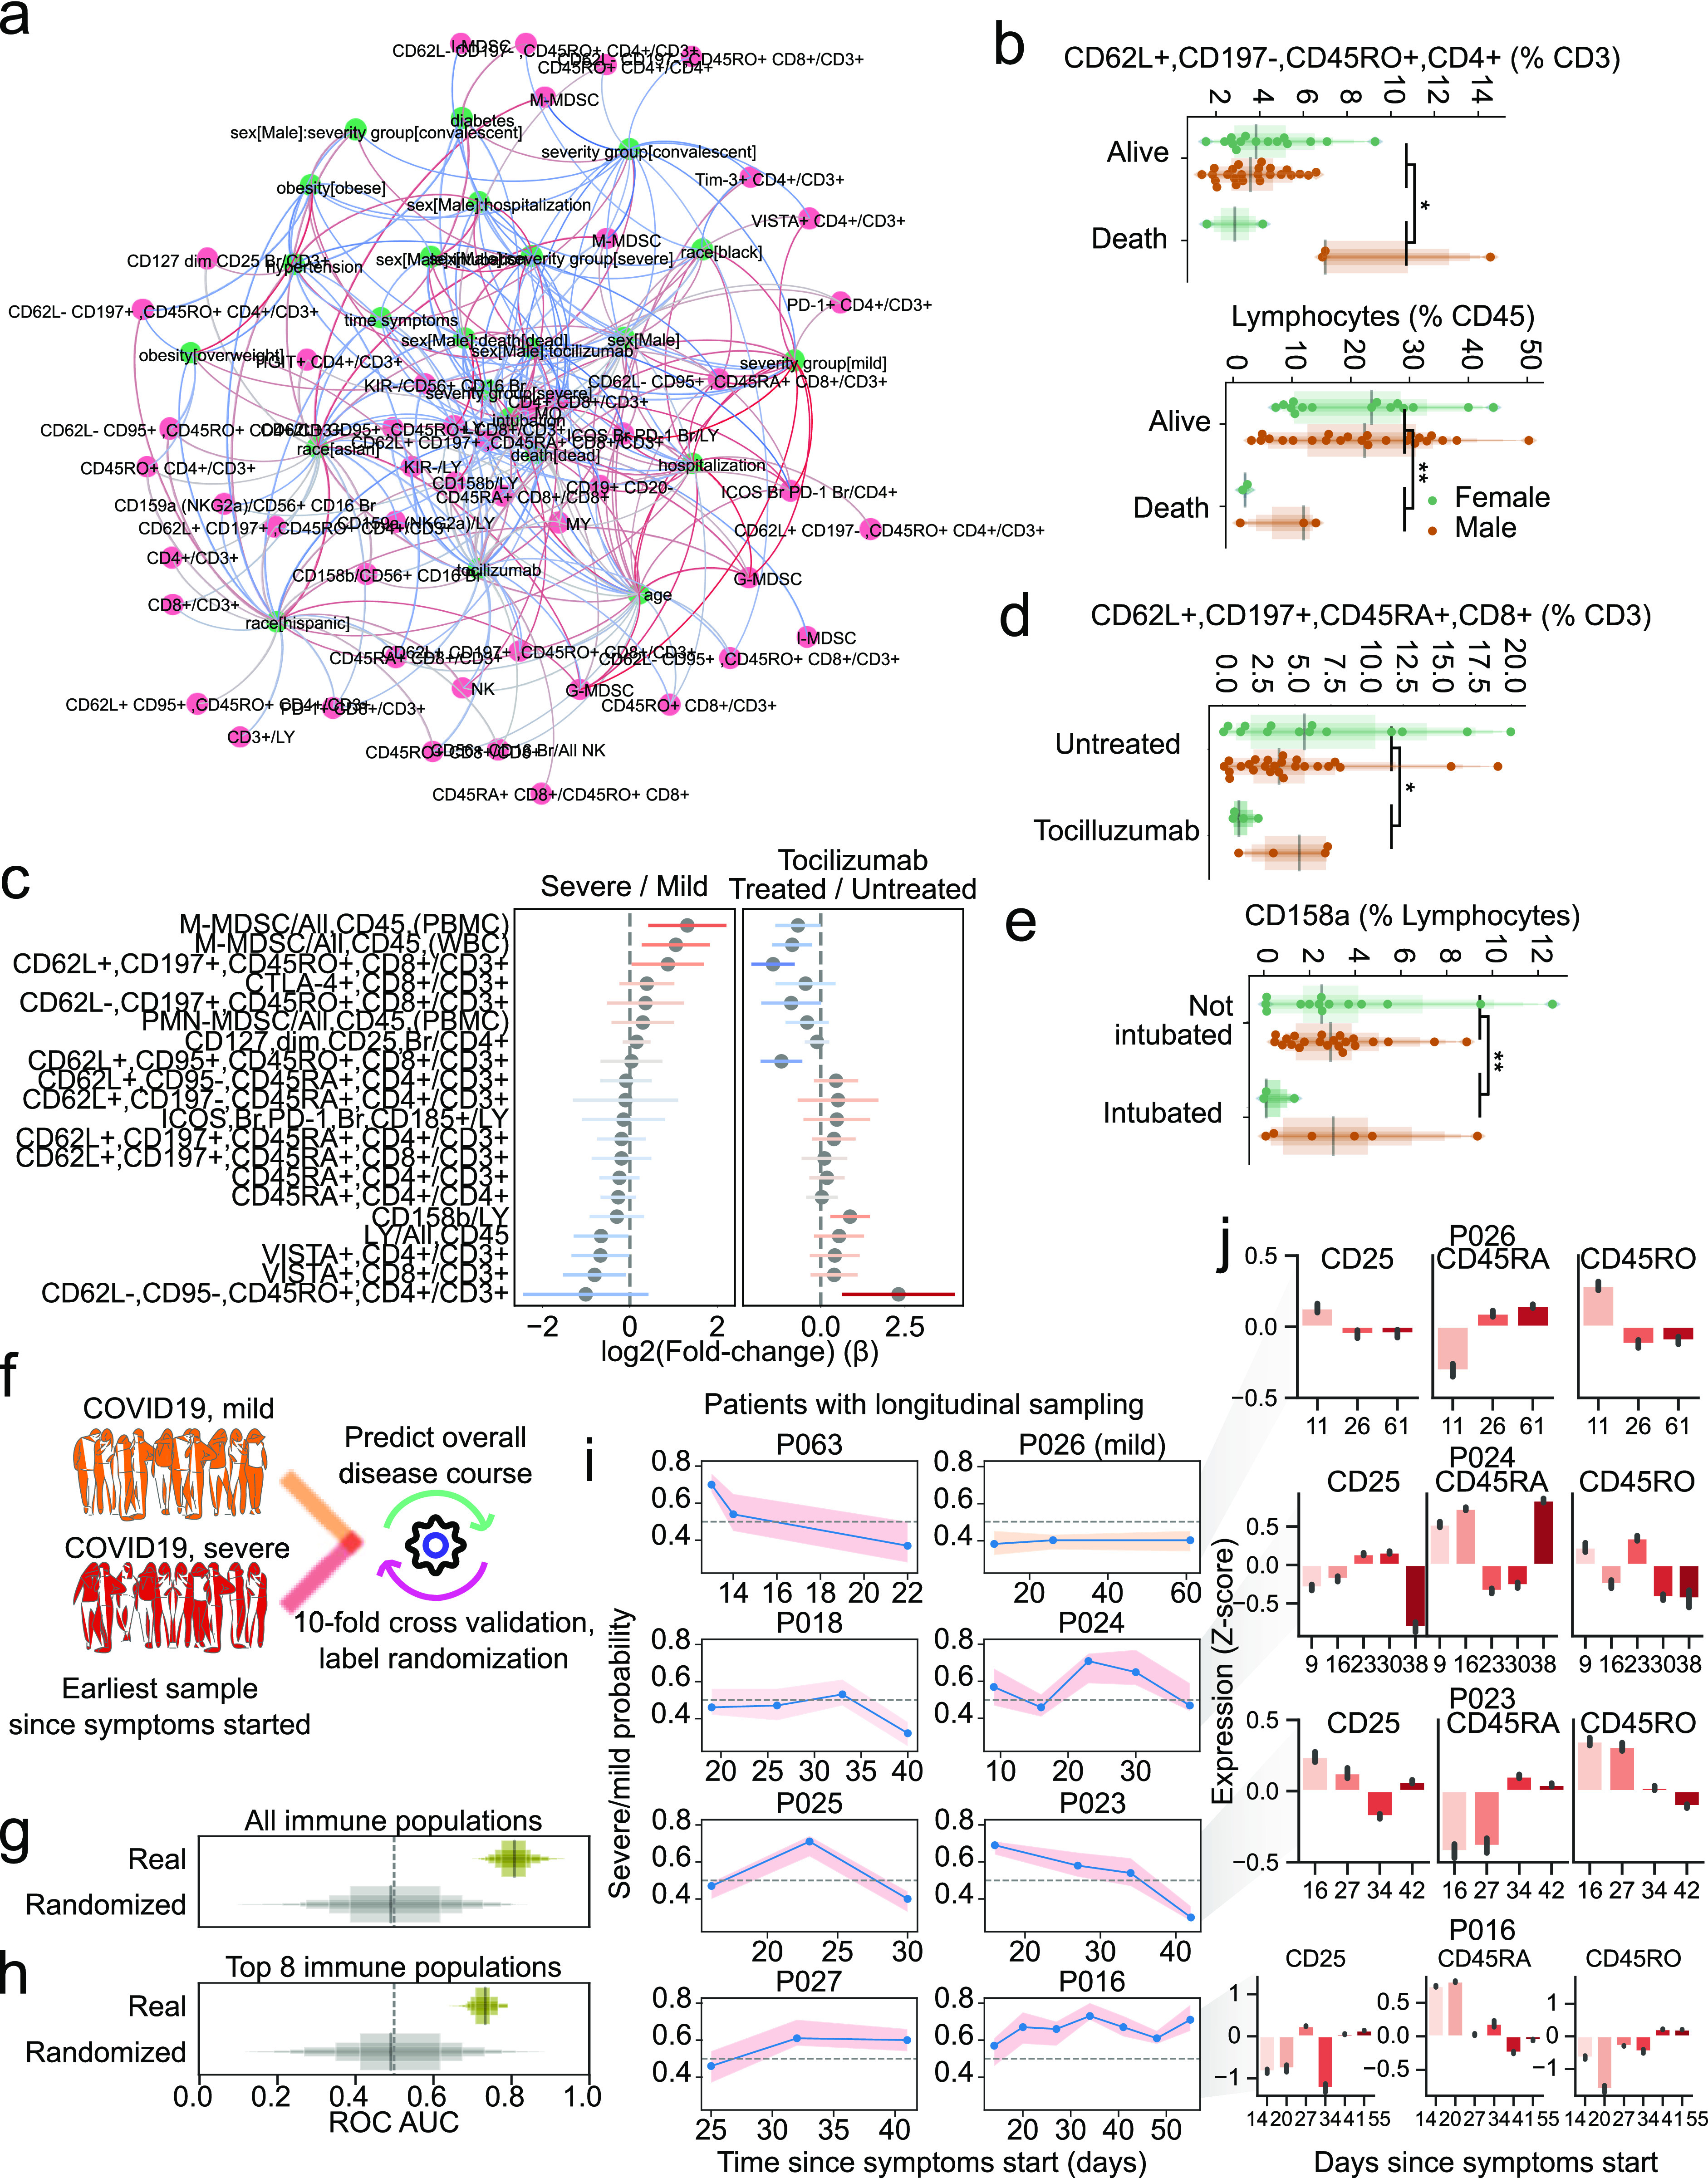
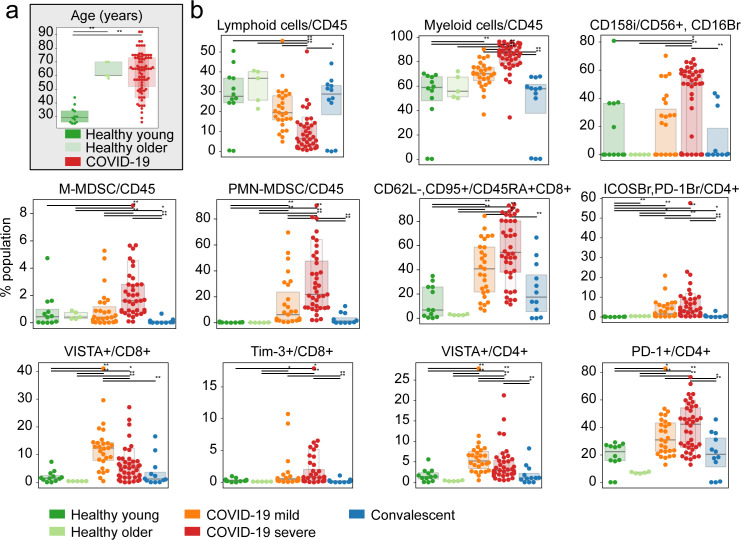
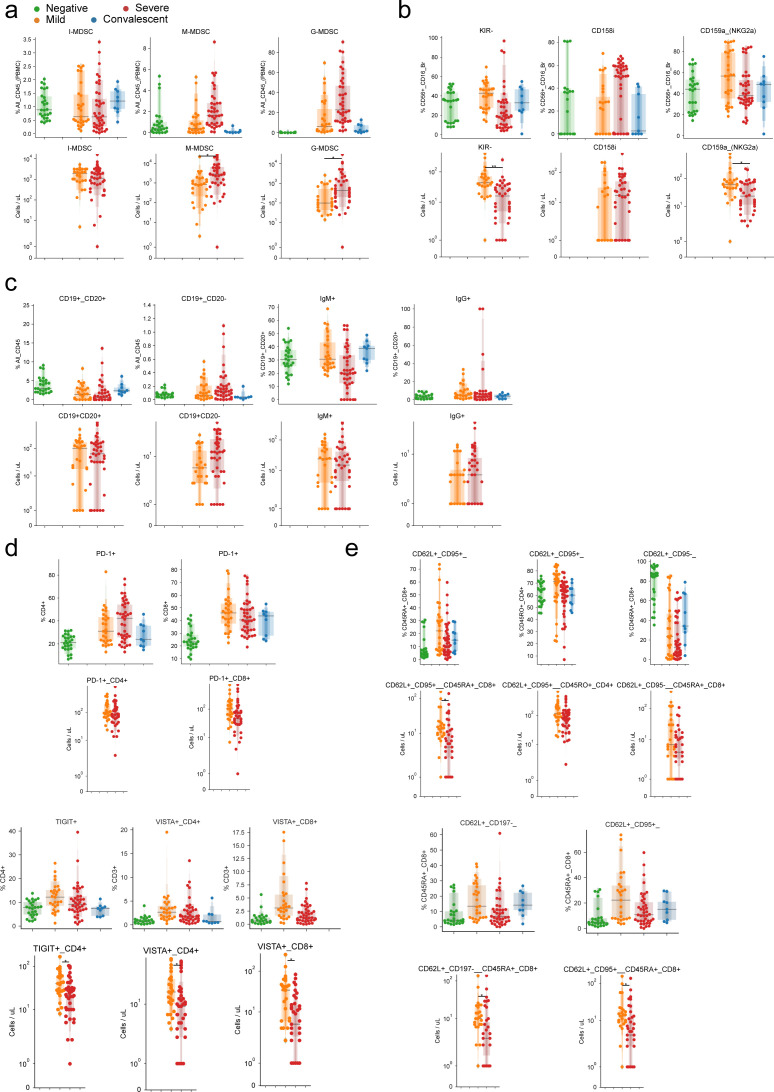
With a rising incidence of COVID-19-associated morbidity and mortality worldwide, it is critical to elucidate the innate and adaptive immune responses that drive disease severity. We performed longitudinal immune profiling of peripheral blood mononuclear cells from 45 patients and healthy donors. We observed a dynamic immune landscape of innate and adaptive immune cells in disease progression and absolute changes of lymphocyte and myeloid cells in severe versus mild cases or healthy controls. Intubation and death were coupled with selected natural killer cell KIR receptor usage and IgM+ B cells and associated with profound CD4 and CD8 T-cell exhaustion. Pseudo-temporal reconstruction of the hierarchy of disease progression revealed dynamic time changes in the global population recapitulating individual patients and the development of an eight-marker classifier of disease severity. Estimating the effect of clinical progression on the immune response and early assessment of disease progression risks may allow implementation of tailored therapies.


Conflict of interest statement

The authors declare that they have no conflict of interest.

Figures

Figure 1.
Figure 1.. Immunoprofiling of COVID-19 patients reveals a disarrayed immune system.
(A) Composition of the study cohort. (B) Description of immune panels and their target epitopes. (C) Composition of major immune compartments as a percentage of all live CD45+ cells. (D) Abundance of major lymphoid compartments as a percentage of all lymphocytes. For (C) and (D), the upper panels divide patients by general disease status and three lower panels further divide the study subjects by clinical intervention or outcome. Significance was assessed using Mann–Whitney U tests and corrected for multiple testing with the Benjamini–Hochberg false discovery rate (FDR). **FDR-adjusted P-value < 0.01; *FDR-adjusted P-value of 0.01–0.05.
Figure S1.
Figure S1.. Relationship between patient demographics and clinical factors.
Hierarchical clustering of patients based exclusively on demographic or clinical factors.
Figure S2.
Figure S2.. Gating strategies employed for all seven flow cytometry panels.
Gated cell populations are labeled with text positioned on top or next to the respective population. Forward/side scatter and gating of major immune populations is demonstrated only in the myeloid panel.
Figure 2.
Figure 2.. T cells from COVID-19 patients have high levels of CD25, FAS, and exhaustion markers.
(A) The ratio of CD4 to CD8 cells is dependent on disease state and clinical intervention. (B) The abundance of CD45RA/RO cells in either CD4+ or CD8+ compartments is dependent on disease state or clinical intervention. (C) Abundance of immune populations changes significantly between disease states. (D) Uniform Manifold Approximation and Projection (UMAP) projection of all cells colored by either surface receptor expression, cluster assignment, or disease severity. (E) Immune phenotype of each cluster (top) and its composition in disease severity (bottom). (F) Expression levels of CD25 and FAS receptors in the UMAP projection. (G) FAS expression across all clusters depending on disease severity (left) and the proportion of cells not expressing FAS for each sample (right). (H) Scatter plot of CD25 and FAS expression for each cell according to disease severity. (I) Abundance of CD4+ CXCR5+ PD-1+ TFH by disease severity. (J) Immune populations with significantly different amounts of cells expressing immune checkpoint receptors by disease severity. Significance was assessed by Mann–Whitney U tests and corrected for multiple testing with the Benjamini–Hochberg false discovery rate (FDR). **FDR-adjusted P-value < 0.01; *FDR-adjusted P-value 0.01–0.05.
Figure S3.
Figure S3.. Changes in TREG and TFH with COVID-19.
(A) Abundance of follicular populations according to disease severity. (B) Gating strategy used for alternative quantification of TFHs. (C) Abundance of TREG populations according to disease severity. Significance was assessed using Mann–Whitney U tests and corrected for multiple testing with Benjamini–Hochberg false discovery rate (FDR). **FDR-adjusted P-value < 0.01; *FDR-adjusted P-value 0.01–0.05.
Figure 3.
Figure 3.. Emergence of granulocytic myeloid-derived suppressor cells and preferential expression of specific NK cell receptors in the innate immune system of COVID-19 patients.
(A) Abundance of myeloid-derived suppressor cells as a percentage of all immune cells according to disease severity. (B) Uniform Manifold Approximation and Projection (UMAP) projection of all cells from all patients colored by the expression levels of surface receptors, derived clusters, or disease severity among all patients. (B, C) Immune profile of each cluster from (B) based on the expression of surface markers (top) and composition in disease severity (bottom). (D) Expression levels of CD15 dependent on disease severity (left) and quantification of cells expressing it (right) according to CD16, CD3, and CD33 expression. (E) Abundance of cells expressing various KIR receptors as a percentage of NK cells according to disease severity. (F) UMAP projection of all cells from all patients colored by the expression of surface receptors, derived clusters, or disease severity. (F, G) Immune profile of each cluster from (F) based on the expression of surface markers (top) and composition in disease severity (bottom). (H) Expression levels of all four measured KIR receptors in each disease state. Significance was assessed using Mann–Whitney U tests and corrected for multiple testing with the Benjamini–Hochberg false discovery rate (FDR). **FDR-adjusted P-value < 0.01; *FDR-adjusted P-value 0.01–0.05.
Figure S4.
Figure S4.. Comparison of the abundance of myeloid-derived suppressor cells and neutrophils.
Scatterplot of myeloid-derived suppressor cell populations compared with neutrophil abundance, as measured in complete blood counts.
Figure 4.
Figure 4.. B cells of COVID-19 patients are marked by a shift toward a plasmocytic IgM phenotype.
(A, B) The abundance of total B cells, plasma, and IgG+ and IgG+ cells between disease states. (C) Uniform Manifold Approximation and Projection (UMAP) projection of all cells colored by surface receptor expression, cluster assignment, or disease severity. (D) Immunophenotype of each cluster (top) and its composition by disease severity (bottom). (E) Identification and quantification of five populations of B cells dependent on CD20 and CD19 expression. (E, F) Comparison of the abundance of the populations identified in (E) between disease states. Significance was assessed using Mann–Whitney U tests and corrected for multiple testing with Benjamini–Hochberg false discovery rate (FDR). **FDR-adjusted P-value < 0.01; *FDR-adjusted P-value 0.01–0.05.
Figure 5.
Figure 5.. Pseudo-temporal reconstitution of disease progression reveals a hierarchy of immune changes in COVID-19 disease.
(A) Projection of immune profiles into a two-dimensional latent space that reconstructs the hierarchy of disease progression. The x-axis represents disease progression in the pseudo-temporal space. Sample from patients which died from COVID-19 are marked with a diagonal black line. (B) Distribution of samples grouped by disease state along the pseudo-temporal axis derived in (B). (C) Immune populations associated with the pseudo-temporal axis represented by either the absolute change in percentage in their extremes (x-axis) or strength of linear association (y-axis). (D) Clusters of immune populations based on their abundance along the pseudo-temporal axis. (D, E) Examples of immune populations from each cluster in (D).
Figure S5.
Figure S5.. Effect of demographic and clinical factors on immune cell populations in COVID-19 patients.
(A) Hierarchically clustered heat map of estimated coefficients across all models. Cells with gray squares represent coefficients with Benjamini–Hochberg adjusted P-values < 0.05. (B) Scatter plot of patient age and lymphocyte abundance for each patient. (C) Coefficients of change estimated when comparing severe COVID-19 patients treated with the IL-6 inhibitor tocilizumab versus untreated severe patients. The top 10 immune populations in each direction of change are displayed.
Figure 6.
Figure 6.. Factors conditioning the immune response during COVID-19 and predicting disease severity.
(A) Directed graph of clinical factors (green) and immune populations (pink). Edges represent the association between factors and immune populations and are colored by the direction and strength of association (blue, negative; red, positive). (B) Abundance of select immune populations with significantly different responses between sexes dependent on outcome. (C) Estimated coefficients of change for severe versus mild disease (left) or tocilizumab treatment (right) for immune populations that change discordantly. (D, E) Abundance of select immune populations with significantly different responses between sexes dependent on tocilizumab treatment (D) or intubation (E). (F) Graphical depiction of the machine-learning framework for predicting disease severity using the earliest available samples per patient and cross validation. (G, H) Performance of classifiers trained with real or randomly shuffled labels and either all immune populations (G) or with selection for the top most predictive eight populations (H). (I) Predicted severity scores over time since symptoms started for immune profiles from patients with at least three longitudinal sampling points. (G, J) Relative expression of CD25, CD45RA, and CD45RO over time in four patients from (G). **False discovery rate-adjusted P-value < 0.01; *false discovery rate-adjusted P-value 0.01–0.05.
Figure S6.
Figure S6.. Agreement between young and older cohorts of healthy donors in abundance of immune populations.
(A) Age distribution between cohorts of healthy young donors (n = 12), healthy older individuals (n = 5), and COVID-19 patients. (B) Relative abundances of most prominent immune populations of relevance for cohorts of healthy donors and COVID-19 patients. Significance was assessed using Mann–Whitney U tests and corrected for multiple testing with Benjamini–Hochberg false discovery rate (FDR). **FDR-adjusted P-value < 0.01; *FDR-adjusted P-value 0.01–0.05.
Figure S7.
Figure S7.. Agreement between absolute and relative abundance of immune populations.
(A, B, C, D, E) Comparison of relative (top) and absolute (bottom) abundances of (A) myeloid-derived suppressor cells, (B) NK cells, (C) B cells, (D) co-inhibitory receptors of T cells, and (E) T cell populations. Significance was assessed using Mann–Whitney U tests and corrected for multiple testing with Benjamini–Hochberg false discovery rate (FDR). **FDR-adjusted P-value < 0.01; *FDR-adjusted P-value 0.01–0.05.

Update of

References

    1. Agrati C, Sacchi A, Bordoni V, Cimini E, Notari S, Grassi G, Casetti R, Tartaglia E, Lalle E, D’Abramo A, et al. (2020) Expansion of myeloid-derived suppressor cells in patients with severe coronavirus disease (COVID-19). Cell Death Differ 27: 3196–3207. 10.1038/s41418-020-0572-6 - DOI - PMC - PubMed
    1. Alkhouli M, Nanjundappa A, Annie F, Bates MC, Bhatt DL (2020) Sex differences in case fatality rate of COVID-19: Insights from a multinational registry. Mayo Clin Proc 95: 1613–1620. 10.1016/j.mayocp.2020.05.014 - DOI - PMC - PubMed
    1. ASARDS Definition Task Force, Ranieri VM, Rubenfeld GD, Thompson BT, Ferguson ND, Caldwell E, Fan E, Camporota L, Slutsky (2012) Acute respiratory distress syndrome: The Berlin definition. JAMA 307: 2526–2533. 10.1001/jama.2012.5669 - DOI - PubMed
    1. Aschenbrenner AC, Mouktaroudi M, Kraemer B, Antonakos N, Oestreich M, Gkizeli K, Nuesch-Germano M, Saridaki M, Bonaguro L, Reusch N, et al. (2020) Disease severity-specific neutrophil signatures in blood transcriptomes stratify COVID-19 patients. BioRxiv–Infectious Diseases (except HIV/AIDS) 10.1101/2020.07.07.20148395 - DOI - PMC - PubMed
    1. Becht E, McInnes L, Healy J, Dutertre C-A, Kwok IWH, Ng LG, Ginhoux F, Newell EW (2018) Dimensionality reduction for visualizing single-cell data using UMAP. Nat Biotechnol 37: 38–44. 10.1038/nbt.4314 - DOI - PubMed

Publication types

MeSH terms