. 2020 Dec 23;5(54):eabf3698.
doi: 10.1126/sciimmunol.abf3698.

Discordant neutralizing antibody and T cell responses in asymptomatic and mild SARS-CoV-2 infection

Affiliations

Discordant neutralizing antibody and T cell responses in asymptomatic and mild SARS-CoV-2 infection

Catherine J Reynolds et al. Sci Immunol. .

Abstract

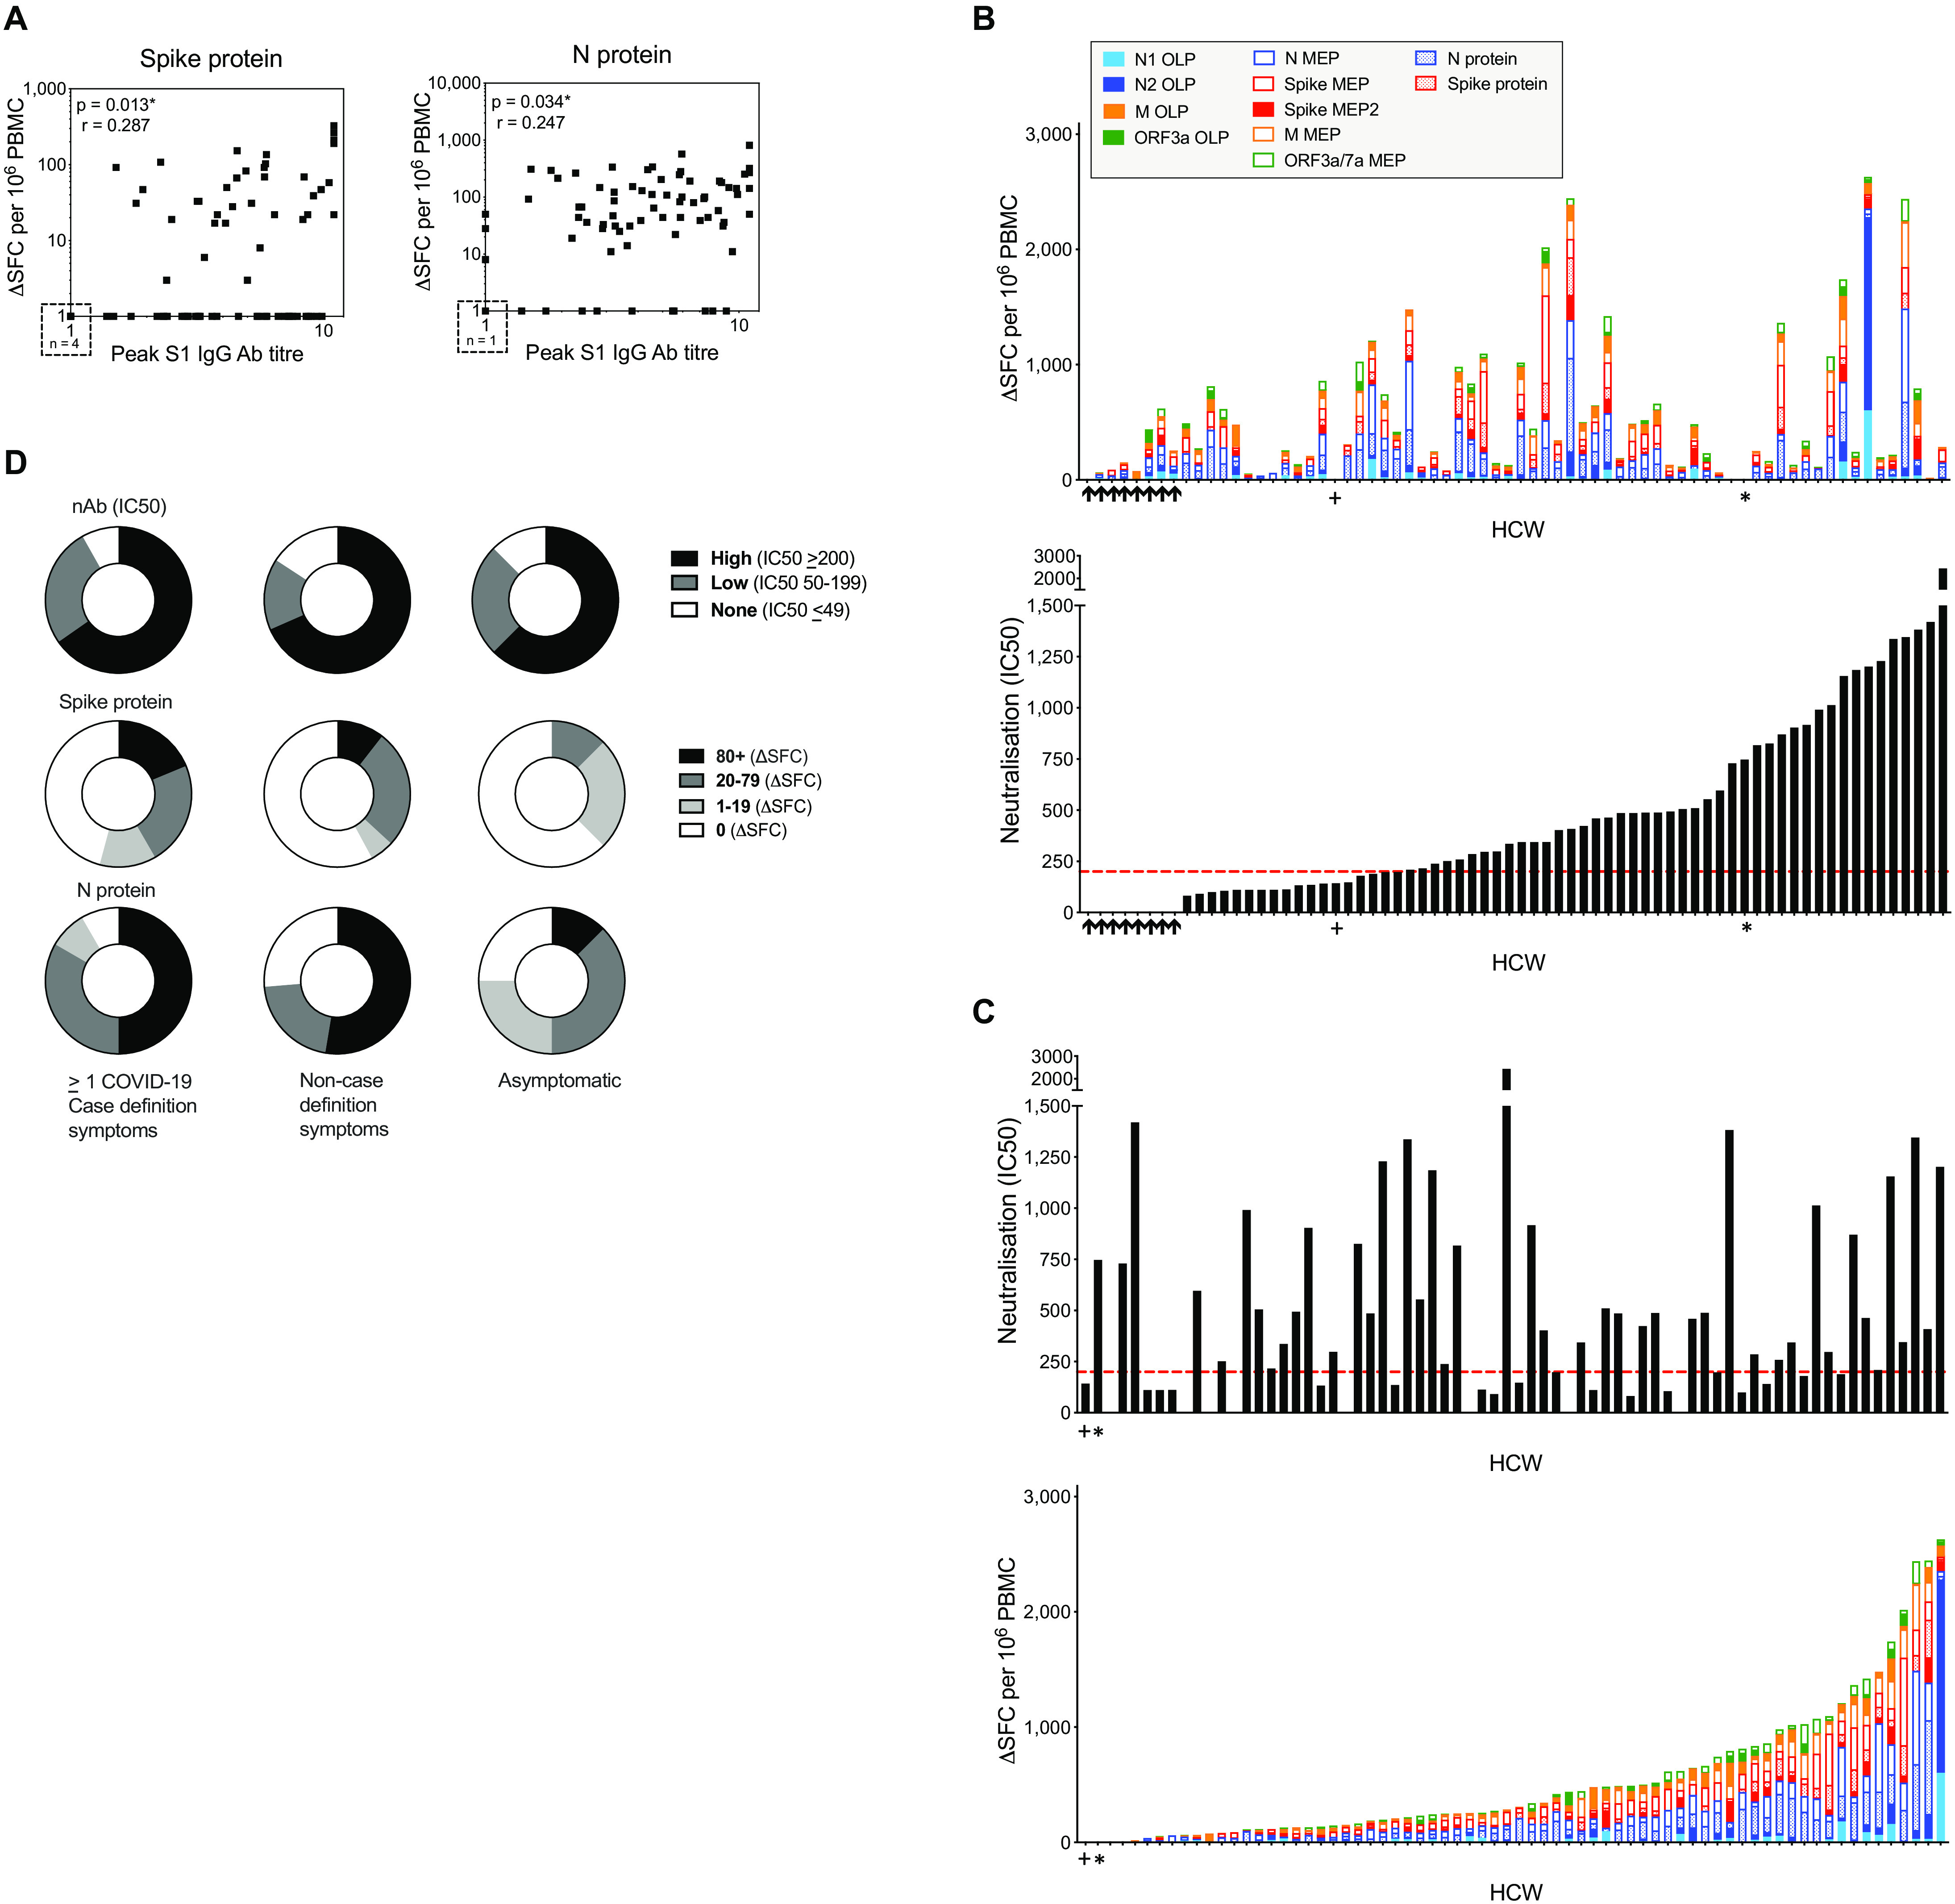
Understanding the nature of immunity following mild/asymptomatic infection with SARS-CoV-2 is crucial to controlling the pandemic. We analyzed T cell and neutralizing antibody responses in 136 healthcare workers (HCW) 16-18 weeks after United Kingdom lockdown, 76 of whom had mild/asymptomatic SARS-CoV-2 infection captured by serial sampling. Neutralizing antibodies (nAb) were present in 89% of previously infected HCW. T cell responses tended to be lower following asymptomatic infection than in those reporting case-definition symptoms of COVID-19, while nAb titers were maintained irrespective of symptoms. T cell and antibody responses were sometimes discordant. Eleven percent lacked nAb and had undetectable T cell responses to spike protein but had T cells reactive with other SARS-CoV-2 antigens. Our findings suggest that the majority of individuals with mild or asymptomatic SARS-CoV-2 infection carry nAb complemented by multispecific T cell responses at 16-18 weeks after mild or asymptomatic SARS-CoV-2 infection.


Figures

Fig. 1
Fig. 1
T cell responses to SARS-CoV-2 antigens in HCW (laboratory-confirmed COVID-19) at 16-18 weeks after UK lockdown. (A-C) Magnitude of T cell response and proportion of HCW with a summed T cell response within the given ranges (0, 1-19, 20-79, ≥80 ΔSFC/106 PBMC). (A) Spike and N protein (n =75), (B) mapped epitope peptide (MEP; n = 75) and (C) overlapping peptide (OLP) pools (n =71, ordered by cumulative magnitude) in HCW with laboratory-confirmed SARS-CoV-2 infection (n = 75). (D) Proportion of HCW with a T cell response to SARS-CoV-2 individual proteins or peptide pools within given ranges (0, 1-19, 20-79, ≥80 ΔSFC/106 PBMC) in the following groups: HCW cohort with laboratory-confirmed infection (n = 75); HCW cohort with no laboratory-confirmed infection but with one or more case-definition symptoms (n = 26), non-case-definition symptoms (n = 24) or asymptomatic (n = 9); pre-COVID-19 pandemic control cohort A (n = 20). (A-B) Bars at geomean. (A) Wilcoxon matched-pairs signed rank test. (B) Friedman multiple comparisons ANOVA with Dunn’s correction. Ab, antibody; HCW, health care workers; M, Membrane; ORF, open reading frame; N, nucleocapsid; S1, spike subunit 1; SFC, spot forming cells per 106 PBMC.
Fig. 2
Fig. 2. nAb responses to SARS-CoV-2 antigens in HCW (laboratory-confirmed COVID-19) at 16-18 weeks after UK lockdown.
(A) Peak S1 IgG antibody titer and peak N IgG/IgM Ab titer across the study period in HCW with laboratory-confirmed SARS-CoV-2 infection (n = 76). (B) The distribution of nAb (IC50) titers across the cohort of HCW with laboratory-confirmed infection and (C) The proportion of HCW with an undetectable (0-49), low (50-199) or high (200+) nAb titer (IC50). (D) Correlation between peak S1 IgG Ab titer (left) or the peak N IgG/IgM Ab titer (right) and nAb titer (IC50) in HCW with laboratory-confirmed SARS-CoV-2 infection. (E-F) Peak S1 IgG Ab titer (E) and nAb titer (IC50) (F) in HCW with laboratory-confirmed infection, stratified by symptom group: ≥1 COVID-19 case-definition symptoms (Red), non-case definition symptoms (Blue) or asymptomatic (Grey) throughout trial and within 3-months of trial initiation. (G) The proportion of HCW with an undetectable (0-49), low (50-199) or high (200+) nAb titer (IC50) within specified age ranges; 20-29 years (n = 13), 30-39 years (n = 26), 40-49 years (n = 16) and ≥50 years (n = 21). (H) Correlations of age vs. peak S1 IgG Ab titer (left) and neutralizing antibody titer (IC50; right) in HCW with laboratory-confirmed SARS-CoV-2 infection separated by gender (female, black symbols; male, open symbols). (D, H) Spearman’s rank correlation, least squares log-log lines shown. (A-B, E-F) bars at geomean. (E, F) Kruskal Wallis multiple comparison ANOVA with Dunn’s correction, not significant. Ab, antibody; N, nucleocapsid; nAb, neutralizing antibody; S1, spike subunit 1; SFC, spot forming cells per 106 PBMC; Y, years.
Fig. 3
Fig. 3. Concordant and discordant T cell and nAb responses in HCW (laboratory-confirmed COVID-19) at 16-18 weeks after UK lockdown.
(A) Correlations between the peak S1 IgG Ab titer and T cell responses to spike protein (left) or N protein (right) in HCW with laboratory-confirmed SARS-CoV-2 infection (n = 75). (B) Top panel; Cumulative magnitude of the T cell response to spike and N proteins, mapped epitope peptide (MEP and MEP2) panels and overlapping peptide (OLP) panels (top panel) ordered by increasing magnitude of nAb response (bottom panel) or (C) Magnitude of nAb response (top panel) ordered by increasing cumulative magnitude of T cell response to spike and N proteins, MEP/MEP2 panels and OLP panels (bottom panel) in HCW with laboratory-confirmed SARS-CoV-2 infection (n = 70). HCW with no nAb (IC50 titer less than 50) are indicated by black arrows. + and * denote individuals with no T cell response to any protein or peptide pool. (D) Proportion of HCW with a nAb titer (IC50) or T cell response to spike and N proteins within given ranges stratified by symptom group; ≥1 COVID-19 case definition symptoms (n = 49 or 48), non-case definition symptoms (n = 19) or asymptomatic (n = 8) (A) Spearman’s rank correlation. HCW, health care workers; M, Membrane; ORF, open reading frame; N, nucleocapsid; nAb, neutralizing antibody; S1, spike subunit 1; SFC, spot forming cells per 106 PBMC.
Fig. 4
Fig. 4. Discordant T cell and nAb responses broken down by T cell antigen.
(A-D) Top panels; Magnitude of the T cell response to spike protein (n = 75) (A) Cumulative magnitude of T cell responses to spike protein and spike mapped epitope peptide (MEP and MEP2) pools (n = 70) (B) N protein and N, M and ORF3a/7a MEP pools (n = 75) (C) or N1, N2, M and ORF3a overlapping peptide (OLP) pools (n = 70) (D) ordered by increasing cumulative magnitude of T cell responses in HCW with laboratory-confirmed SARS-CoV-2 infection. Bottom panels; nAb titers (IC50) in HCW with laboratory-confirmed SARS-CoV-2 infection, ordered by corresponding top panel. (E) The number of reactive SARS-CoV-2 proteins or peptide pools (top panel) and nAb titer (IC50; bottom panel) in HCW with laboratory-confirmed SARS-CoV-2 infection (n = 70). Top panel ordered by cumulative magnitude; bottom panel ordered by top panel. HCW with no nAb (IC50 titer less than 50) are indicated by black arrows. + and * denote two individuals with no T cell response to any protein or peptide pool. HCW, healthcare workers; M, Membrane; N, nucleocapsid; nAb, neutralizing antibody; ORF, open reading frame; SFC, spot forming cells per 106 PBMC.
Fig. 5
Fig. 5. CONSORT flow diagram for the COVIDsortium London healthcare worker cohort and sub-cohort.
CONSORT flow diagram showing participant recruitment into COVIDsortium London healthcare worker parent study and sub-study. Participants were stratified by SARS-CoV-2 PCR and antibody laboratory tests and by symptoms experienced during 16 weeks follow-up and in the 3 months prior to study initiation. SARS-CoV-2 laboratory test positive and negative participant sub-cohort groups were matched for gender, age and ethnicity.

References

    1. Ni L., Ye F., Cheng M. L., Feng Y., Deng Y. Q., Zhao H., Wei P., Ge J., Gou M., Li X., Sun L., Cao T., Wang P., Zhou C., Zhang R., Liang P., Guo H., Wang X., Qin C. F., Chen F., Dong C., Detection of SARS-CoV-2-Specific Humoral and Cellular Immunity in COVID-19 Convalescent Individuals. Immunity 52, 971–977.e3 (2020). 10.1016/j.immuni.2020.04.023 - DOI - PMC - PubMed
    1. Grifoni A., Weiskopf D., Ramirez S. I., Mateus J., Dan J. M., Moderbacher C. R., Rawlings S. A., Sutherland A., Premkumar L., Jadi R. S., Marrama D., de Silva A. M., Frazier A., Carlin A. F., Greenbaum J. A., Peters B., Krammer F., Smith D. M., Crotty S., Sette A., Targets of T Cell Responses to SARS-CoV-2 Coronavirus in Humans with COVID-19 Disease and Unexposed Individuals. Cell 181, 1489–1501.e15 (2020). 10.1016/j.cell.2020.05.015 - DOI - PMC - PubMed
    1. Le Bert N., Tan A. T., Kunasegaran K., Tham C. Y. L., Hafezi M., Chia A., Chng M. H. Y., Lin M., Tan N., Linster M., Chia W. N., Chen M. I., Wang L. F., Ooi E. E., Kalimuddin S., Tambyah P. A., Low J. G., Tan Y. J., Bertoletti A., SARS-CoV-2-specific T cell immunity in cases of COVID-19 and SARS, and uninfected controls. Nature 584, 457–462 (2020). 10.1038/s41586-020-2550-z - DOI - PubMed
    1. Peng Y., Mentzer A. J., Liu G., Yao X., Yin Z., Dong D., Dejnirattisai W., Rostron T., Supasa P., Liu C., López-Camacho C., Slon-Campos J., Zhao Y., Stuart D. I., Paesen G. C., Grimes J. M., Antson A. A., Bayfield O. W., Hawkins D. E. D. P., Ker D. S., Wang B., Turtle L., Subramaniam K., Thomson P., Zhang P., Dold C., Ratcliff J., Simmonds P., de Silva T., Sopp P., Wellington D., Rajapaksa U., Chen Y. L., Salio M., Napolitani G., Paes W., Borrow P., Kessler B. M., Fry J. W., Schwabe N. F., Semple M. G., Baillie J. K., Moore S. C., Openshaw P. J. M., Ansari M. A., Dunachie S., Barnes E., Frater J., Kerr G., Goulder P., Lockett T., Levin R., Zhang Y., Jing R., Ho L. P., Cornall R. J., Conlon C. P., Klenerman P., Screaton G. R., Mongkolsapaya J., McMichael A., Knight J. C., Ogg G., Dong T.; Oxford Immunology Network Covid-19 Response T cell Consortium; ISARIC4C Investigators , Broad and strong memory CD4+ and CD8+ T cells induced by SARS-CoV-2 in UK convalescent individuals following COVID-19. Nat. Immunol. 21, 1336–1345 (2020). 10.1038/s41590-020-0782-6 - DOI - PMC - PubMed
    1. Thieme C. J., Anft M., Paniskaki K., Blazquez-Navarro A., Doevelaar A., Seibert F. S., Hoelzer B., Konik M. J., Berger M. M., Brenner T., Tempfer C., Watzl C., Meister T. L., Pfaender S., Steinmann E., Dolff S., Dittmer U., Westhoff T. H., Witzke O., Stervbo U., Roch T., Babel N., Robust T Cell Response Toward Spike, Membrane, and Nucleocapsid SARS-CoV-2 Proteins Is Not Associated with Recovery in Critical COVID-19 Patients. Cell Rep Med 1, 100092 (2020). 10.1016/j.xcrm.2020.100092 - DOI - PMC - PubMed

Publication types