. 2021 Feb 1;206(3):471-480.
doi: 10.4049/jimmunol.2000671. Epub 2020 Dec 23.

A Critical Role for Na+/H+ Exchanger Regulatory Factor 1 in Modulating FcεRI-Mediated Mast Cell Activation

Affiliations

A Critical Role for Na+/H+ Exchanger Regulatory Factor 1 in Modulating FcεRI-Mediated Mast Cell Activation

Ananth K Kammala et al. J Immunol. .

Abstract

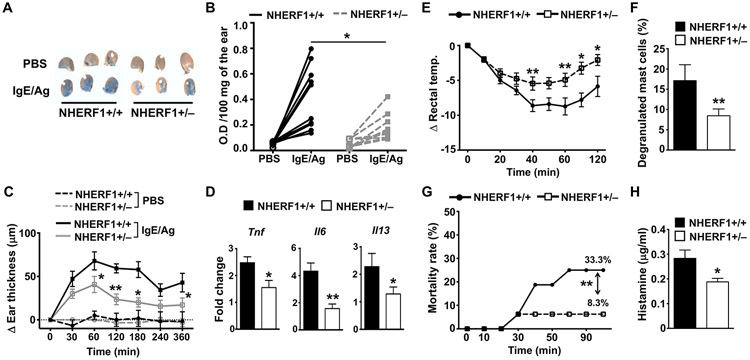
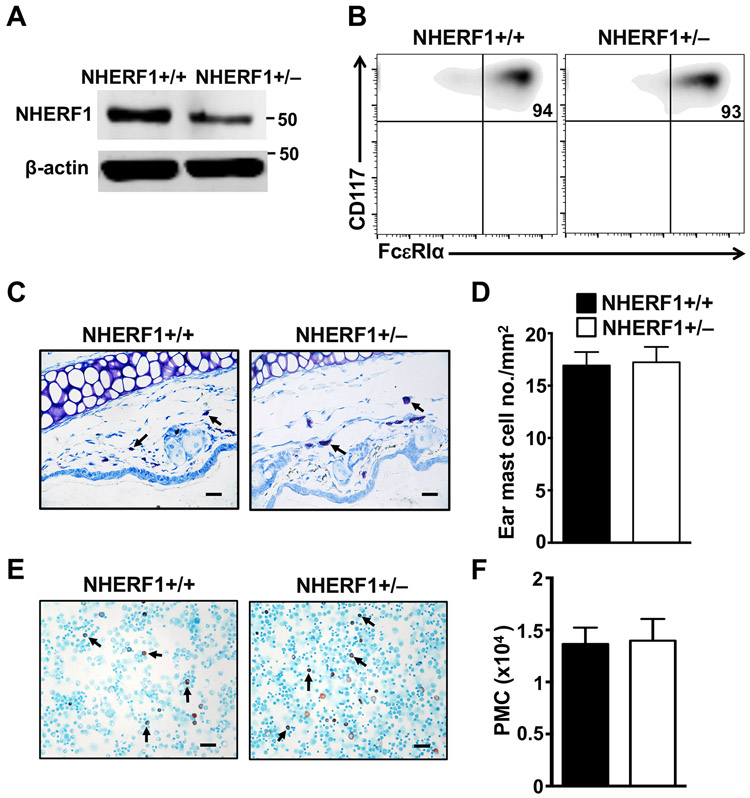
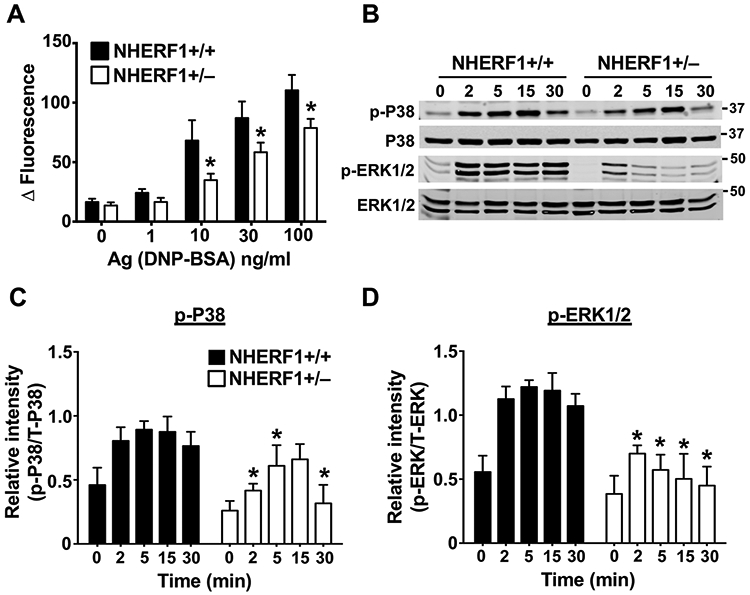
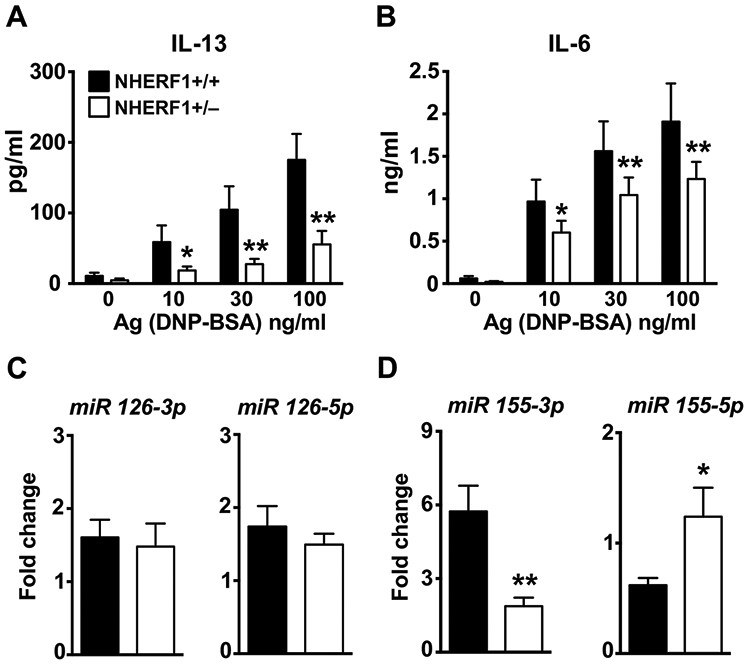
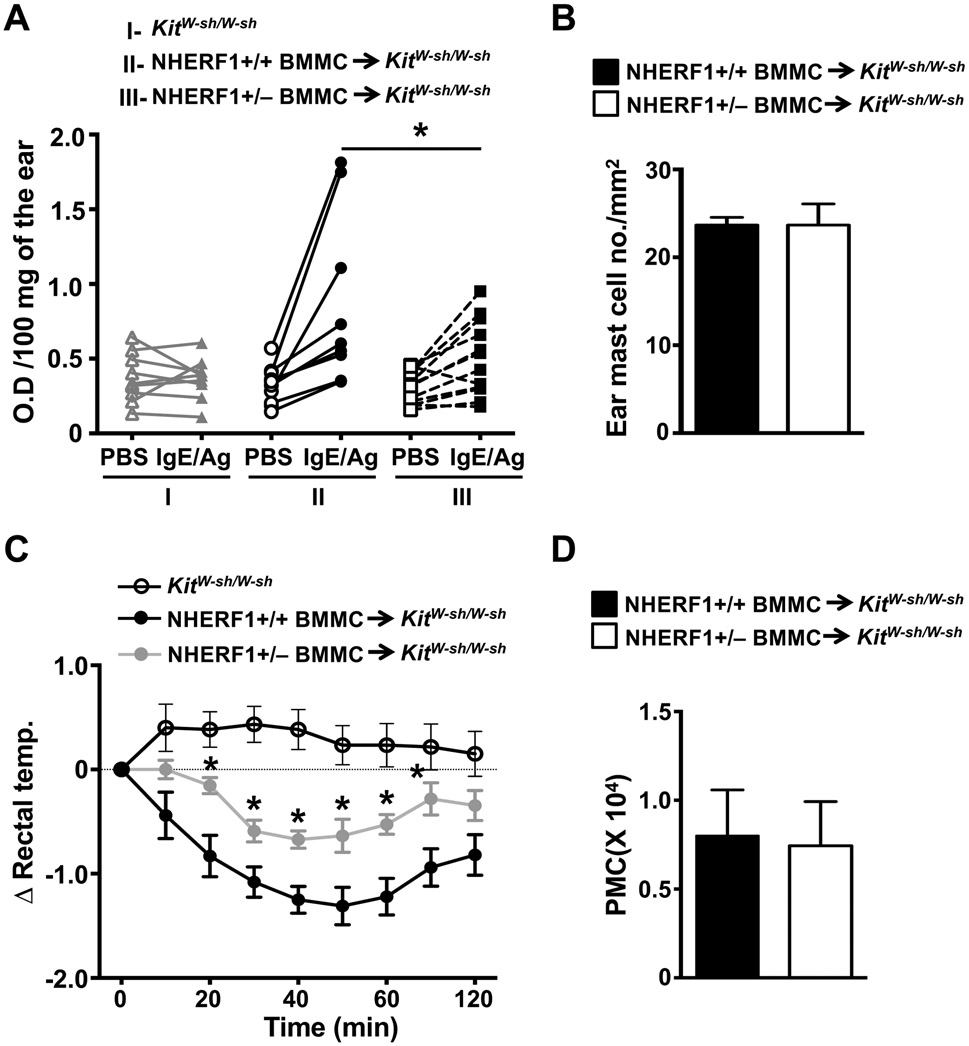
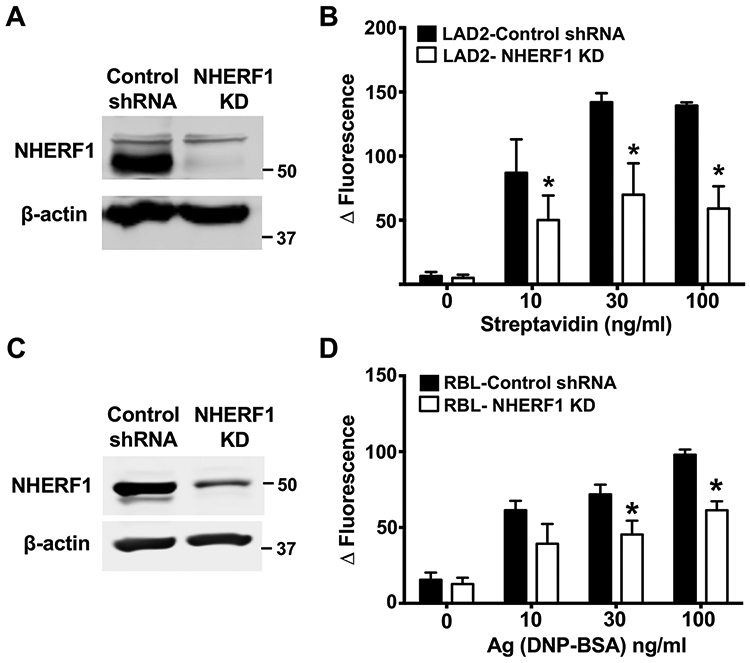
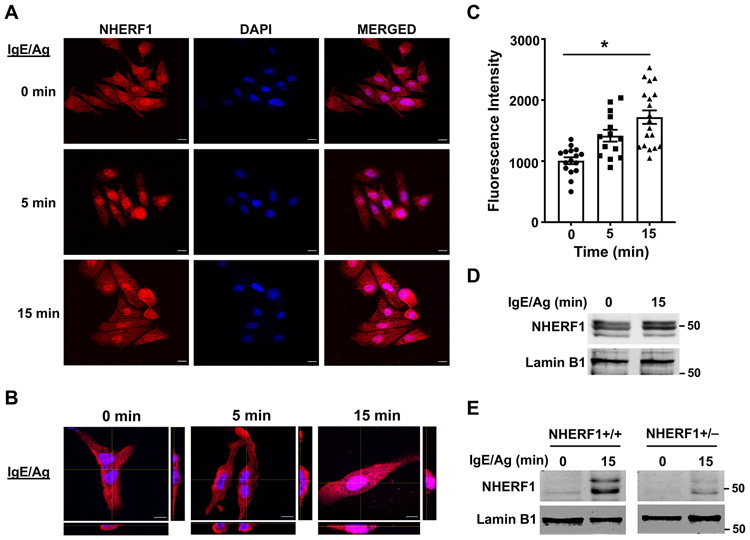
Mast cells are tissue-resident immune cells that play pivotal roles in initiating and amplifying allergic/anaphylactic reactions in humans. Their activation occurs via multiple mechanisms, which include cross-linking of the IgE-bound, high-affinity IgE receptors (FcεRI) by allergens or Ags and the binding of anaphylatoxins such as C3a to its receptor, C3aR. We have previously demonstrated that the Na+/H+ exchanger regulatory factor 1 (NHERF1) promotes C3aR functions in human mast cells. In the current study, we show that NHERF1 regulates mast cell response following FcεRI stimulation. Specifically, intracellular Ca2+ mobilization, activation of the MAPKs (ERK1/2 and P38), and production of cytokines (IL-13 and IL-6) following exposure to IgE/Ag were significantly reduced in mast cells from NHERF1+/‒ mice. In agreement with our in vitro data, mast cell-mediated passive cutaneous anaphylaxis and passive systemic anaphylaxis were reduced in NHERF1+/‒ mice and mast cell-deficient KitW-sh/W-sh mice engrafted with NHERF1+/‒ mast cells. Mechanistically, the levels of microRNAs (miRNAs) that regulate mast cell responses, miRNA 155-3p and miRNA 155-5p, were altered in mast cells from NHERF1+/‒ mice. Moreover, NHERF1 rapidly localized to the nucleus of mast cells following FcεRI stimulation. In summary, our results suggest that the NHERF1 acts as an adapter molecule and promotes IgE/Ag-induced mast cell activation. Further elucidating the mechanisms through which NHERF1 modulates mast cell responses will lend insights into the development of new therapeutic strategies to target mast cells during anaphylaxis or other allergic diseases.


Conflict of interest statement

CONFLICT OF INTEREST

The authors have no conflict of interest to declare.

Figures

Figure 1:
Figure 1:. NHERF1+/− mice show decreased PCA and PSA to IgE/Ag.
(A-D) NHERF1+/+ and NHERF1+/− mice were injected with anti-DNP IgE (20 ng, left ear) and PBS (right ear). DNP-HSA (Ag, 100 μg) in 1% Evan’s Blue in PBS was administered i.v in these mice after 18 h. Mice were culled after 30 min, the ears were weighed, the dye was extracted, and the absorbance was measured at 650 nm. (A). Representative pictures of the ears from 3 different mice for each cohort are shown. (B) The line graph shows O.D. of the extracted dye per 100 mg of the ear tissue after the PBS or the Ag injections. (C, D) Mice were exposed to IgE/Ag, and (C) ear thickness was measured at different time points after Ag injection, and the change in ear thickness is shown. (D) Mice were sacrificed and the ear samples were collected. Bar graph shows the fold change (2−ΔΔCt) in the mRNAs of TNF, IL-6, and IL-13 relative to GAPDH levels. (E-H) NHERF1+/+ and NHERF1+/− mice were sensitized with anti-DNP IgE (20 μg, i.p.) for 16 h. and were injected with DNP-HSA (Ag, 1 mg) i.p. (E) The rectal temperature was measured before and after Ag treatment at the indicated time points (0-120 min) and the change in temperature is shown. (F) Bar graph shows numbers of degranulated mast cells in the peritoneal lavage fluid. (F) Some mice died following the DNP-HSA injection, the mortality rate was estimated and is shown in the graph. (H) Histamine levels in the serum of mice is shown. Data shown are mean ± S.E. from 2-3 experiments (n=5-10 mice/group). Statistical significance was determined by unpaired Student’s t-test. * p<0.05 and ** p<0.01.
Figure 2:
Figure 2:. Characterization of mast cells from NHERF1+/− mice.
(A) Blots show expression levels of NHERF1 protein in BMMCs from NHERF1+/+ and NHERF1+/− mice. The blots were stripped and re-probed with β-actin for loading control. (B) Flow cytometric plots show the expression of FcεRI and CD117 on NHERF1+/+ and NHERF1+/− BMMCs. (C) Representative pictures showing mast cells (bold arrows) in the toluidine blue stained sections of the ear tissue are shown. (D) The mast cells were counted and total numbers of mast cells per mm2 in the ears of mice are plotted. (E-F) The peritoneal lavage from mice were stained with Alcian blue and Safranin stains. (E) Representative images showing peritoneal mast cells (PMC, bold arrows) and (F) total numbers of PMC in lavage fluid are shown. Scale bar = 20 μM. Data shown are representative of n=3-4 mice in each group.
Figure 3:
Figure 3:. Ca2+ influx and MAP kinase (P-38 and ERK1/2) activation is reduced in NHERF1+/− BMMCs.
(A) IgE-sensitized NHERF1+/+ and NHERF1+/− BMMCs were loaded with Calcium 6 dye reagent and stimulated with indicated concentrations of DNP-BSA (Ag). Bar graphs show change in fluorescence intensities following Ag exposure. (B-D) NHERF1+/+ and NHERF1+/− BMMCs were pretreated with IgE and stimulated with DNP-BSA (30 ng/mL) for the indicated time intervals. Western blotting was performed on cell lysates with the appropriate primary and secondary antibodies. (B) Representative blots from three similar experiments are shown. (C, D) Bar graphs represent relative intensities of analyzed phospho-protein bands normalized to the respective total proteins. Data are mean ± SEM from three independent experiments. Statistical significance was determined by unpaired Student’s t-test. * p <0.05.
Figure 4.
Figure 4.. NHERF1+/− BMMCs showed decreased IL-6 and IL-13 production and altered miRNA 155 levels following exposure to IgE/Ag.
NHERF1+/+ and NHERF1+/− BMMCs were pretreated with IgE and were stimulated with DNP-BSA for 6h. (A) IL-13 and (B) IL-6 production was determined by ELISA. (C-D) BMMCs were stimulated with IgE and DNP-BSA for 1 h and miRNA expression of (C) 126-3p and 126-5p and (D) 155-3p and 155-5p was analyzed by real-time PCR. Values are plotted as fold change (2−ΔΔCt) normalized to GAPDH levels. Data are mean ± S.E. from 3 experiments (n=5 mice/group). Statistical significance was determined by unpaired Student’s t-test. * indicates p<0.05, and ** indicates p<0.01.
Figure 5:
Figure 5:. PCA and PSA responses are reduced in mast cell deficient Kit W-sh/W-sh mice engrafted with NHERF1+/− BMMCs.
Kit W-sh/W-sh mice (I), Kit W-sh/W-sh mice engrafted with NHERF1+/+ BMMCs (II) or Kit W-sh/W-sh mice reconstituted with NHERF1+/− BMMCs (III) were subjected to (A, B) PCA and (C, D) PSA assays 8 weeks post engraftment. (A) The line graph shows O.D. of the extracted Evan’s Blue dye per 100 mg of the ear tissue from each mouse after PBS or IgE/Ag injections. (B) The ear sections from different cohorts of mice were stained with toluidine blue and the number of mast cells in the ears was counted. (C) Graph shows change in rectal temperature at different time points following the exposure to IgE/Ag in different groups of mice. (D) The peritoneal lavages of mice were stained with toluidine blue and numbers of mast cells were counted and plotted. Data shown are mean ± S.E. from 3 experiments (a total of n=5-11 mice/group). Statistical significance was determined by unpaired Student’s t-test. * p <0.05.
Figure 6:
Figure 6:. Knockdown of NHERF1 in LAD2 and RBL-2H3 cells results in reduced intracellular Ca2+ mobilization.
LAD2 human mast cells and RBL-2H3 cells were transduced with scrambled shRNA lentivirus (control) or a shRNA lentivirus that targets NHERF1 (NHERF1 KD). (A and C) Western blotting was performed to determine NHERF1 levels in control and NHERF1 silenced LAD2 and RBL cells. Representative images of the blots are shown. The blots were probed with β-actin as loading control. (B) Control or NHERF1 knock down LAD2 cells (LAD2-NHERF1 KD) were pretreated with biotin-IgE (10 ng/mL, 24 h) and stimulated with different concentrations streptavidin and intracellular Ca2+ mobilization assay was performed. (D) Control or NHERF1 shRNA transduced RBL-2H3 cells (RBL-NHERF1 KD) were exposed to DNP-specific IgE and DNP-BSA (Ag) and intracellular Ca2+ mobilization assay was performed. Data are mean ± SEM of three independent experiments. Statistical significance was determined by unpaired Student’s t-test. * p <0.05.
Figure 7:
Figure 7:. NHERF1 localizes to the nucleus following IgE/Ag stimulation.
RBL-2H3 cells were plated on poly-L-lysine coated slides, pre-treated with IgE and stimulated with Ag at different time points. Cells were fixed with 4% paraformaldehyde and stained with fluorescent antibodies to detect NHERF1. (A) Representative images of NHERF1 expression (red) and DAPI staining (nucleus, blue) are shown. (B) Z-stack confocal microscopy images with cross-sectional views taken at 100 x magnification show localization of NHERF1 (red) after Ag stimulation. Scale bar = 10 μm. (C) Bar graph shows mean fluorescence intensities in the red channel that co-localized with the blue color intensities corresponding to NHERF1 expression in the nucleus. Data represent mean ± S.E. from 3 experiments with 14-19 cells analyzed in each group. Statistical analysis was done using unpaired t-test. * p<0.05. (D, E) RBL-2H3 cells (D) and NHERF1+/+ and NHERF1+/− BMMCs (E) were stimulated with IgE/Ag for 15 min and NHERF1 protein levels in the nucleus was determined by western blotting. A representative image of the blot is shown. The blots were stripped and re-probed with lamin B1 as loading control.

Similar articles

Cited by

References

    1. Turner PJ, Jerschow E, Umasunthar T, Lin R, Campbell DE, and Boyle RJ. 2017. Fatal Anaphylaxis: Mortality Rate and Risk Factors. J Allergy Clin Immunol Pract 5: 1169–1178. - PMC - PubMed
    1. DeConde AS, and Soler ZM. 2016. Chronic rhinosinusitis: Epidemiology and burden of disease. Am J Rhinol Allergy 30: 134–139. - PubMed
    1. Papi A, Brightling C, Pedersen SE, and Reddel HK. 2018. Asthma. Lancet 391: 783–800. - PubMed
    1. Galli SJ, and Tsai M. 2012. IgE and mast cells in allergic disease. Nat Med 18: 693–704. - PMC - PubMed
    1. Saito H, Ishizaka T, and Ishizaka K. 2013. Mast cells and IgE: from history to today. Allergol Int 62: 3–12. - PubMed

Publication types