

Forward-looking serial intervals correctly link epidemic growth to reproduction numbers
- PMID: 33361331
- PMCID: PMC7812760
- DOI: 10.1073/pnas.2011548118
Forward-looking serial intervals correctly link epidemic growth to reproduction numbers
Abstract
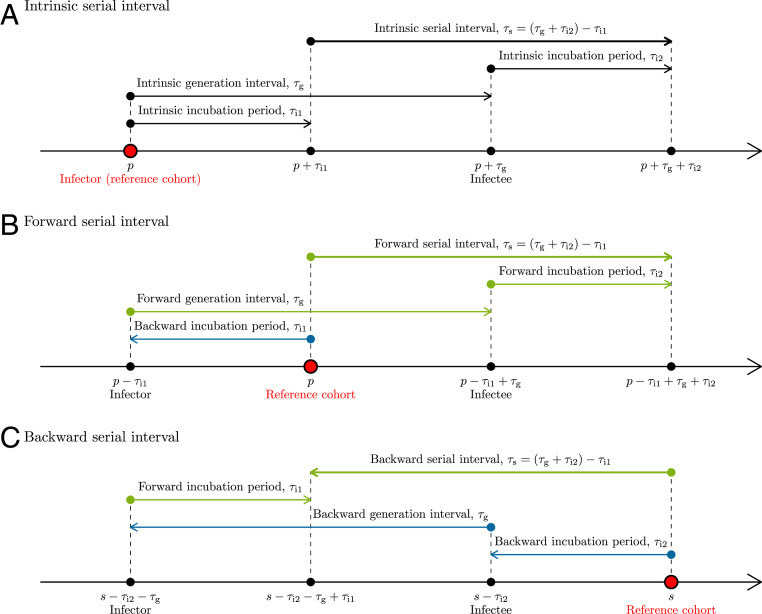
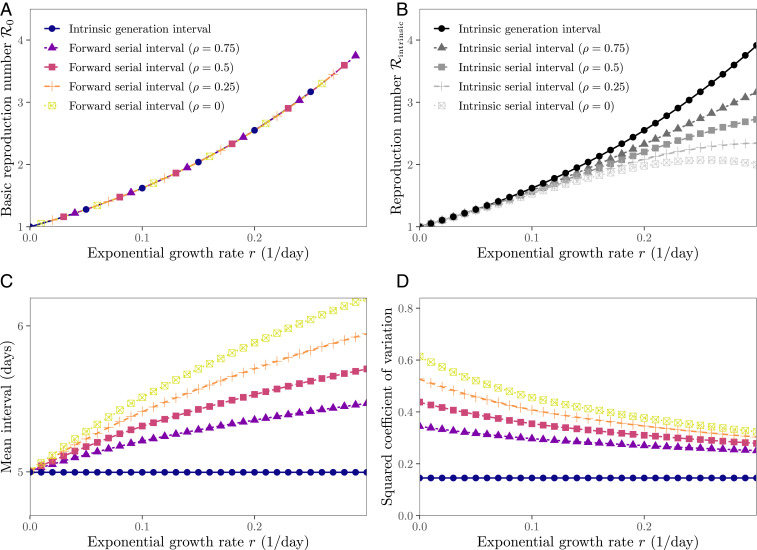
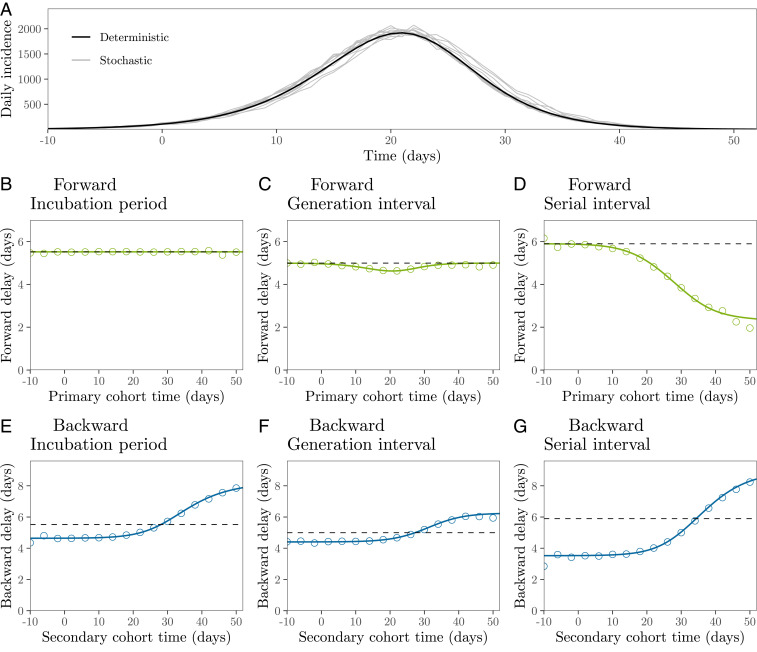
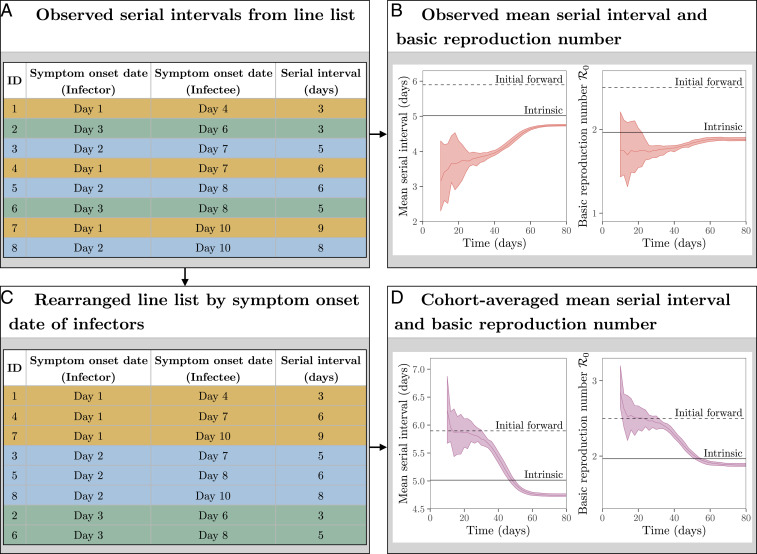
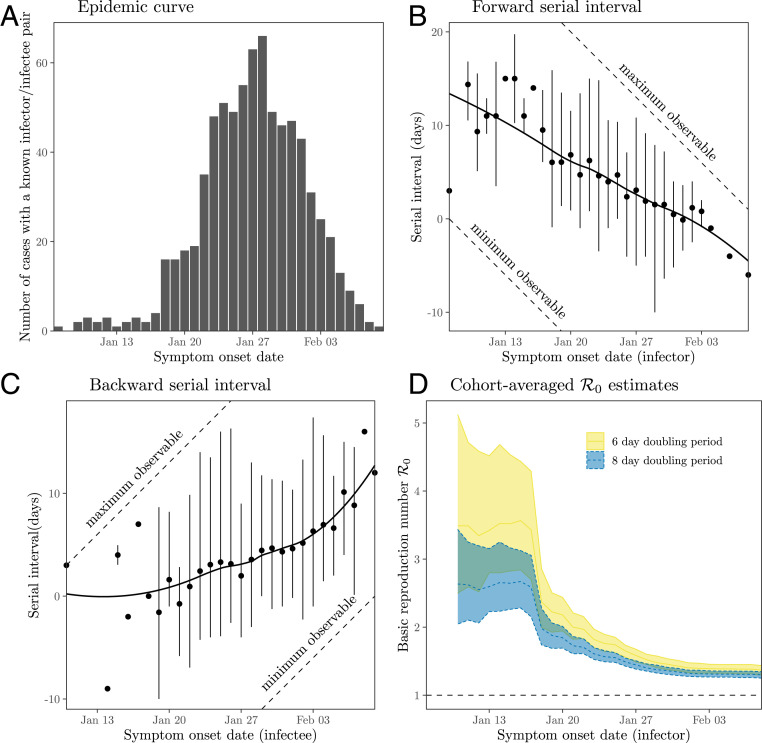
The reproduction number R and the growth rate r are critical epidemiological quantities. They are linked by generation intervals, the time between infection and onward transmission. Because generation intervals are difficult to observe, epidemiologists often substitute serial intervals, the time between symptom onset in successive links in a transmission chain. Recent studies suggest that such substitution biases estimates of R based on r. Here we explore how these intervals vary over the course of an epidemic, and the implications for R estimation. Forward-looking serial intervals, measuring time forward from symptom onset of an infector, correctly describe the renewal process of symptomatic cases and therefore reliably link R with r. In contrast, backward-looking intervals, which measure time backward, and intrinsic intervals, which neglect population-level dynamics, give incorrect R estimates. Forward-looking intervals are affected both by epidemic dynamics and by censoring, changing in complex ways over the course of an epidemic. We present a heuristic method for addressing biases that arise from neglecting changes in serial intervals. We apply the method to early (21 January to February 8, 2020) serial interval-based estimates of R for the COVID-19 outbreak in China outside Hubei province; using improperly defined serial intervals in this context biases estimates of initial R by up to a factor of 2.6. This study demonstrates the importance of early contact tracing efforts and provides a framework for reassessing generation intervals, serial intervals, and R estimates for COVID-19.
Keywords: generation interval; infectious disease modeling; reproduction number; serial interval.
Copyright © 2021 the Author(s). Published by PNAS.
Conflict of interest statement
The authors declare no competing interest.
Figures
Similar articles
-
On realized serial and generation intervals given control measures: The COVID-19 pandemic case.PLoS Comput Biol. 2021 Mar 29;17(3):e1008892. doi: 10.1371/journal.pcbi.1008892. eCollection 2021 Mar. PLoS Comput Biol. 2021. PMID: 33780436 Free PMC article.
-
A Novel Tool for Real-time Estimation of Epidemiological Parameters of Communicable Diseases Using Contact-Tracing Data: Development and Deployment.JMIR Public Health Surveill. 2022 May 31;8(5):e34438. doi: 10.2196/34438. JMIR Public Health Surveill. 2022. PMID: 35486812 Free PMC article.
-
Re-estimation of basic reproduction number of COVID-19 based on the epidemic curve by symptom onset date.Epidemiol Infect. 2021 Feb 22;149:e53. doi: 10.1017/S0950268821000431. Epidemiol Infect. 2021. PMID: 33612125 Free PMC article.
-
Early reports of epidemiological parameters of the COVID-19 pandemic.Western Pac Surveill Response J. 2021 May 11;12(2):65-81. doi: 10.5365/wpsar.2020.11.3.011. eCollection 2021 Apr-Jun. Western Pac Surveill Response J. 2021. PMID: 34540315 Free PMC article. Review.
-
Rapid review of available evidence on the serial interval and generation time of COVID-19.BMJ Open. 2020 Nov 23;10(11):e040263. doi: 10.1136/bmjopen-2020-040263. BMJ Open. 2020. PMID: 33234640 Free PMC article. Review.
Cited by
-
Inferring time-varying generation time, serial interval, and incubation period distributions for COVID-19.Nat Commun. 2022 Dec 13;13(1):7727. doi: 10.1038/s41467-022-35496-8. Nat Commun. 2022. PMID: 36513688 Free PMC article.
-
Decoding mpox: a systematic review and meta-analysis of the transmission and severity parameters of the 2022-2023 global outbreak.BMJ Glob Health. 2025 Jan 31;10(1):e016906. doi: 10.1136/bmjgh-2024-016906. BMJ Glob Health. 2025. PMID: 39890207 Free PMC article.
-
Investigating setting-specific superspreading potential and generation intervals of COVID-19 in Hong Kong.Nat Commun. 2025 Jul 1;16(1):5816. doi: 10.1038/s41467-025-60591-x. Nat Commun. 2025. PMID: 40593551 Free PMC article.
-
Transmission dynamics of SARS-CoV-2 Omicron variant infections in Hangzhou, Zhejiang, China, January-February 2022.Int J Infect Dis. 2023 Jan;126:132-135. doi: 10.1016/j.ijid.2022.10.033. Epub 2022 Oct 28. Int J Infect Dis. 2023. PMID: 36511336 Free PMC article.
-
Computing the daily reproduction number of COVID-19 by inverting the renewal equation using a variational technique.Proc Natl Acad Sci U S A. 2021 Dec 14;118(50):e2105112118. doi: 10.1073/pnas.2105112118. Proc Natl Acad Sci U S A. 2021. PMID: 34876517 Free PMC article.
References
-
- Anderson R. M., May R. M., Infectious Diseases of Humans: Dynamics and Control (Oxford University Press, 1991).
-
- Diekmann O., Heesterbeek J. A., Metz J. A., On the definition and the computation of the basic reproduction ratio in models for infectious diseases in heterogeneous populations. J. Math. Biol. 28, 365–382 (1990). - PubMed
-
- Ma J., Dushoff J., Bolker B. M., Earn D. J. D., Estimating initial epidemic growth rates. Bull. Math. Biol. 76, 245–260 (2014). - PubMed
Publication types
MeSH terms
LinkOut - more resources
Full Text Sources
Medical
