Comparative Study
. 2021 Jan 12;118(2):e2017525118.
doi: 10.1073/pnas.2017525118.

DeepTracer for fast de novo cryo-EM protein structure modeling and special studies on CoV-related complexes

Affiliations
Comparative Study

DeepTracer for fast de novo cryo-EM protein structure modeling and special studies on CoV-related complexes

Jonas Pfab et al. Proc Natl Acad Sci U S A. .

Abstract

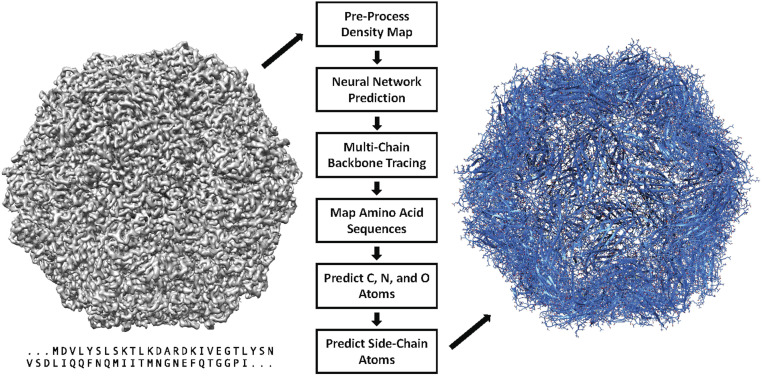
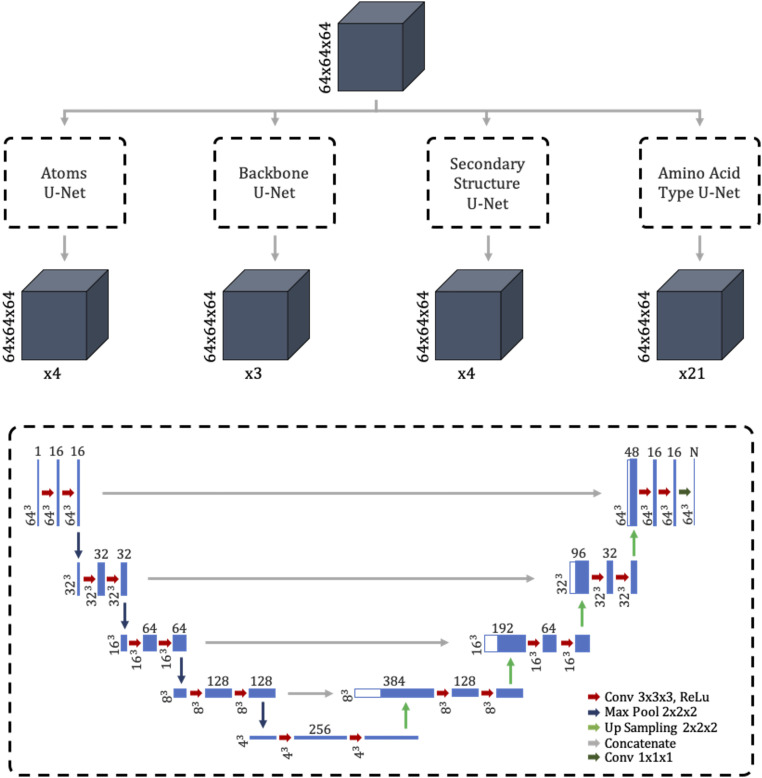
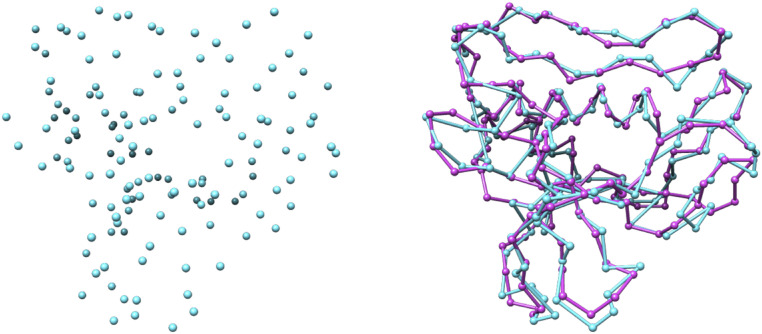
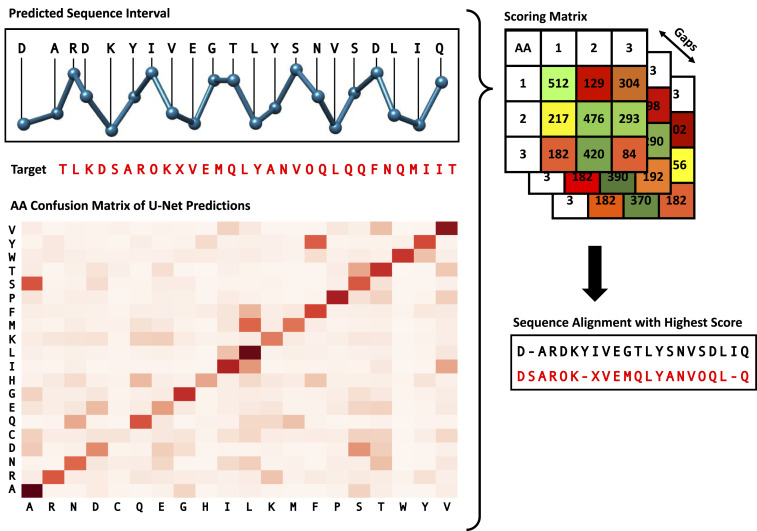
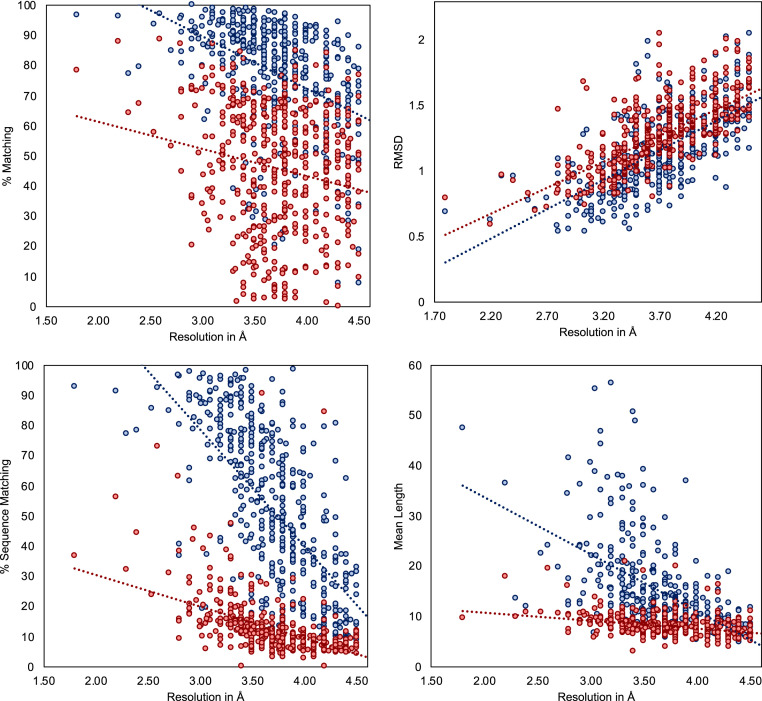
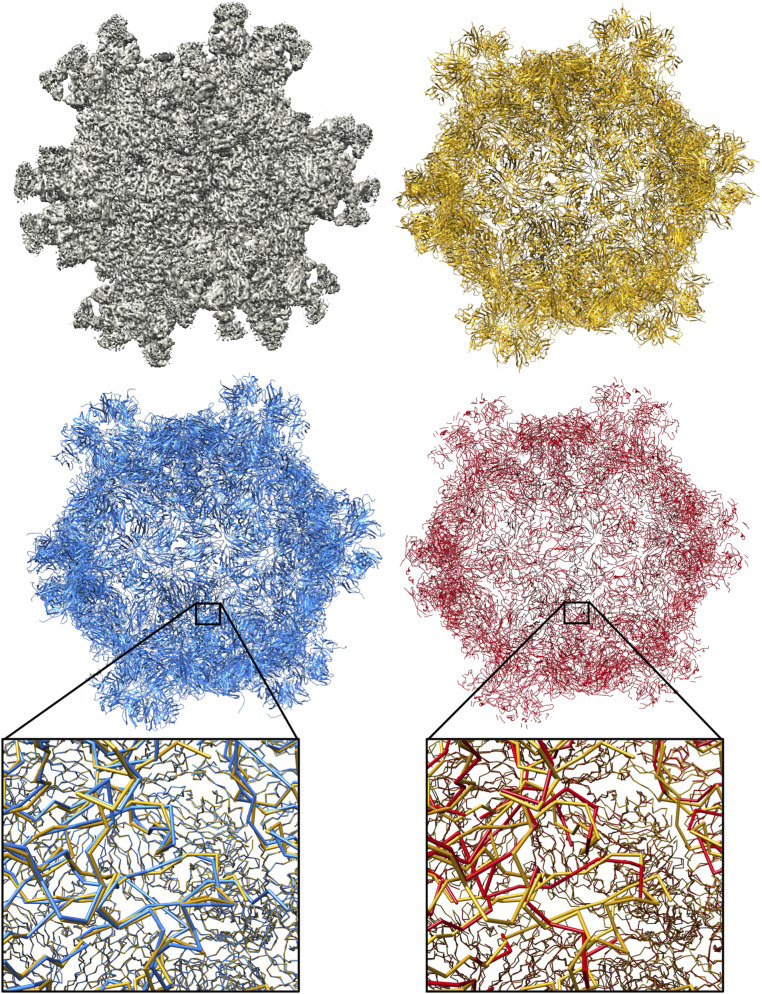
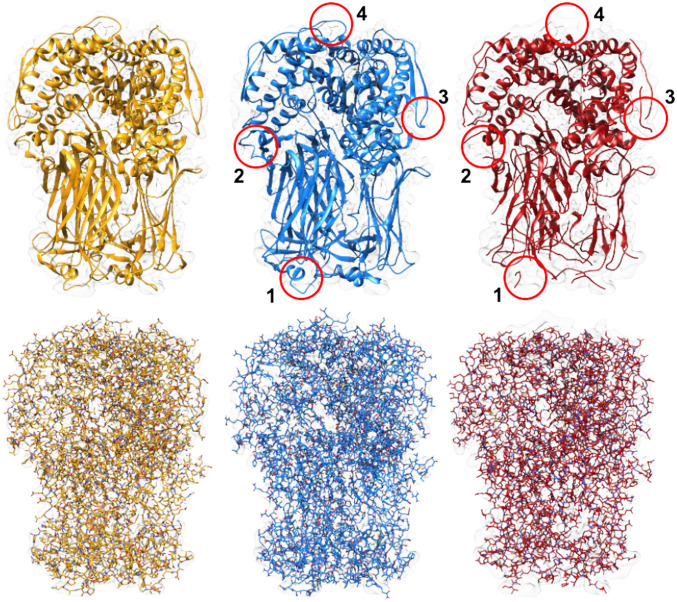
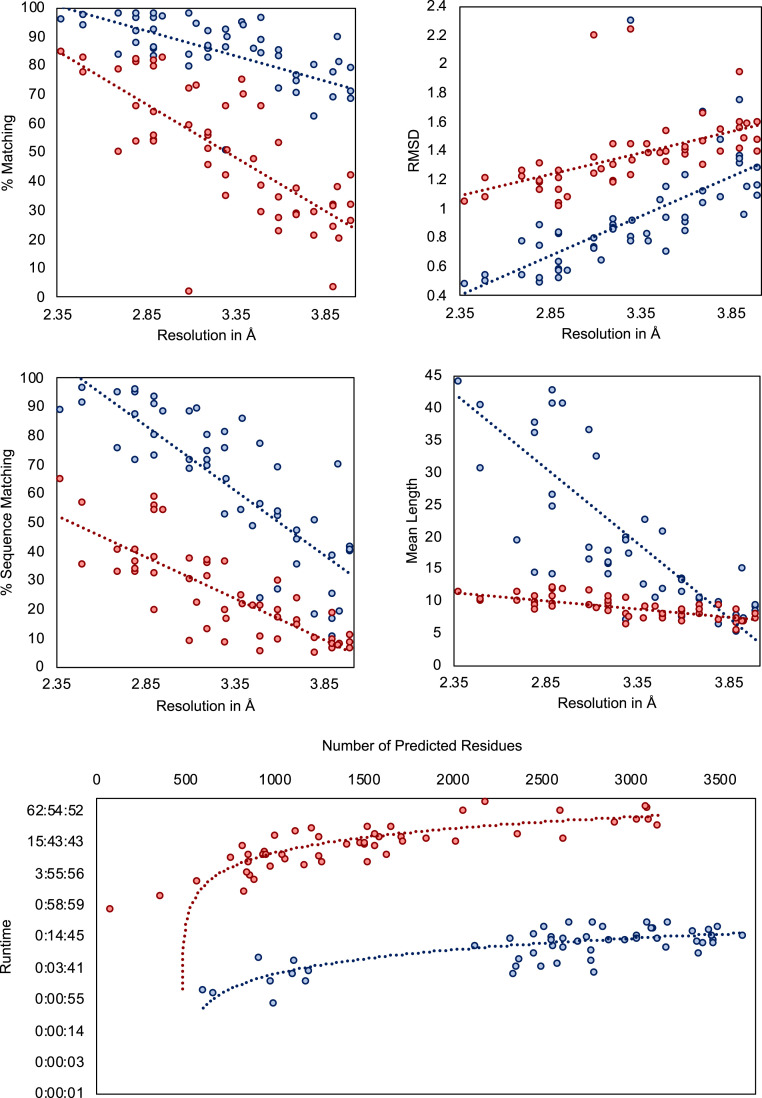
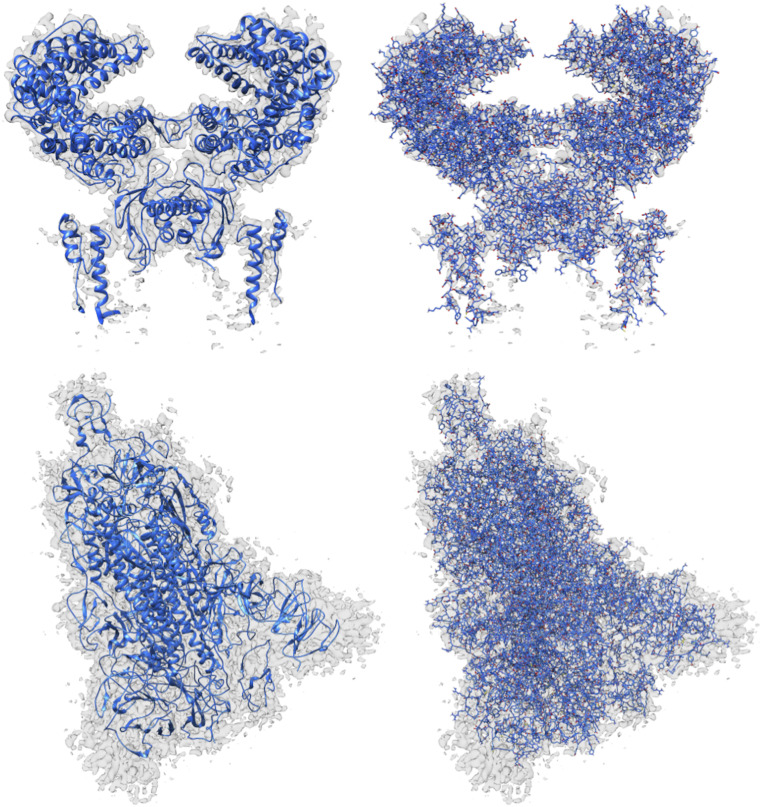
Information about macromolecular structure of protein complexes and related cellular and molecular mechanisms can assist the search for vaccines and drug development processes. To obtain such structural information, we present DeepTracer, a fully automated deep learning-based method for fast de novo multichain protein complex structure determination from high-resolution cryoelectron microscopy (cryo-EM) maps. We applied DeepTracer on a previously published set of 476 raw experimental cryo-EM maps and compared the results with a current state of the art method. The residue coverage increased by over 30% using DeepTracer, and the rmsd value improved from 1.29 Å to 1.18 Å. Additionally, we applied DeepTracer on a set of 62 coronavirus-related cryo-EM maps, among them 10 with no deposited structure available in EMDataResource. We observed an average residue match of 84% with the deposited structures and an average rmsd of 0.93 Å. Additional tests with related methods further exemplify DeepTracer's competitive accuracy and efficiency of structure modeling. DeepTracer allows for exceptionally fast computations, making it possible to trace around 60,000 residues in 350 chains within only 2 h. The web service is globally accessible at https://deeptracer.uw.edu.

Keywords: complex; cryo-EM; de novo; modeling; structure.


Conflict of interest statement

The authors declare no competing interest.

Figures

Fig. 1.
Fig. 1.
DeepTracer model determination pipeline. All-atom structure of multichain protein complexes is determined fully automatically solely from a cryo-EM map and amino acid sequence using the steps shown in the center of the figure. The structure shown on the right side is an actual model built by DeepTracer.
Fig. 2.
Fig. 2.
Architecture of tailored convolutional neural network. Top shows overview of DeepTracer’s neural network architecture consisting of four parallel U-Nets. The gray boxes show the input and output maps, with their dimensions noted to the left and the number of channels marked below. Bottom dashed box shows the detailed architecture of each parallel U-Net. The blue boxes show the output maps of the different layers, where the dimensions of the maps are depicted on the left and the number of channels is depicted on top.
Fig. 3.
Fig. 3.
Example masks from the training dataset based on the PDB ID code 6NQ1 deposited model structure. (A) Deposited model structure. (B) Backbone (Cα, C, and N atoms) in purple and side chains in green. (C) Atoms mask with labels for Cα, C, and N atoms. (D) Secondary structure mask with helices in turquoise, loops in pink, and sheets in orange. (E) Amino acid type mask with 20 different colors.
Fig. 4.
Fig. 4.
Backbone confidence map of the EMD-0478 map with identified chains annotated in different colors.
Fig. 5.
Fig. 5.
Traced backbone atoms. Predicted Cα atoms for the EMD-4054 map in blue before (Left) and after (Right) the backbone tracing step compared to the deposited model structure in pink.
Fig. 6.
Fig. 6.
Protein sequence alignment algorithm. Interval of the predicted sequence is aligned with the target sequence using a custom dynamic algorithm. The amino acid confusion matrix depicts the relative frequency of pairs of predicted and true amino acid type and was calculated based on a set of test cryo-EM maps. The numbers shown in the score matrix are solely for illustrative purposes and do not reflect real data.
Fig. 7.
Fig. 7.
Carbon, nitrogen, and oxygen determination. (A) Initial positioning of carbon (yellow) and nitrogen (blue) atoms in between the Cα atoms (gray) on Left and their initial refined positioning, which fits the U-Net prediction of carbon atoms (green volume) and nitrogen atoms (blue volume), on Right. (B) The positions of carbon and nitrogen atoms are refined further by forcing bond angles into their well-known values. The blue lines represent the bonds from the initial refinement. The red lines represent the bonds from the final refinement. (C) Position of oxygen atom in the carbonyl group by definition.
Fig. 8.
Fig. 8.
Evaluation results for set of 476 experimental cryo-EM maps. Evaluation of determined models from DeepTracer (blue) and Phenix (red) for 476 cryo-EM maps. The dotted lines represent the trend for each method. DeepTracer outperformed Phenix in all four metrics. Precise data can be found in SI Appendix, Table S3.
Fig. 9.
Fig. 9.
Results of EMD-6757 map. Models built by DeepTracer (blue) and Phenix (red) next to PDB ID code 5XS7 deposited model structure (yellow) for EMD-6757 map.
Fig. 10.
Fig. 10.
Results of EMD-6272 map. Models built by DeepTracer (blue) and Phenix (red) compared to PDB ID code 3J9S deposited model structure (yellow) for EMD-6272 map. Top shows structures in ribbon view, and Bottom shows structures in all-atom view. Areas where DeepTracer correctly predicted amino acids that Phenix missed are highlighted by the four red circles.
Fig. 11.
Fig. 11.
Results for coronavirus-related cryo-EM maps. Evaluation of models built by DeepTracer (blue) and Phenix (red) for 52 coronavirus-related high-resolution cryo-EM maps. The dotted lines represent the trend for each method. Computation times are shown on a logarithmic scale. Precise data can be found in SI Appendix, Table S2.
Fig. 12.
Fig. 12.
Models built from SARS-CoV-2 cryo-EM maps, which do not have deposited model structures in the EMDR. DeepTracer model for the EMD-30044 map (Top) showing a human receptor ACE2 to which spike proteins of the SARS-CoV-2 virus bind and (Bottom) the EMD-21374 depicting a SARS-CoV-2 spike glycoprotein. No model structure has been deposited to the EMDataResource for the cryo-EM maps as of the date this paper is announced.

References

    1. Branden C. I., Tooze J., Introduction to Protein Structure (Garland Science, 2012).
    1. Cohen F. S., How viruses invade cells. Biophys. J. 110, 1028–1032 (2016). - PMC - PubMed
    1. Bambini S., Rappuoli R., The use of genomics in microbial vaccine development. Drug Discov. Today 14, 252–260 (2009). - PMC - PubMed
    1. Callaway E., Revolutionary cryo-EM is taking over structural biology. Nature 578, 201 (2020). - PubMed
    1. Bai X. C., McMullan G., Scheres S. H., How cryo-EM is revolutionizing structural biology. Trends Biochem. Sci. 40, 49–57 (2015). - PubMed

Publication types

LinkOut - more resources