. 2020 Dec 23;4(2):e202000808.
doi: 10.26508/lsa.202000808. Print 2021 Feb.

The chromatin landscape of primary synovial sarcoma organoids is linked to specific epigenetic mechanisms and dependencies

Affiliations

The chromatin landscape of primary synovial sarcoma organoids is linked to specific epigenetic mechanisms and dependencies

Gaylor Boulay et al. Life Sci Alliance. .

Abstract

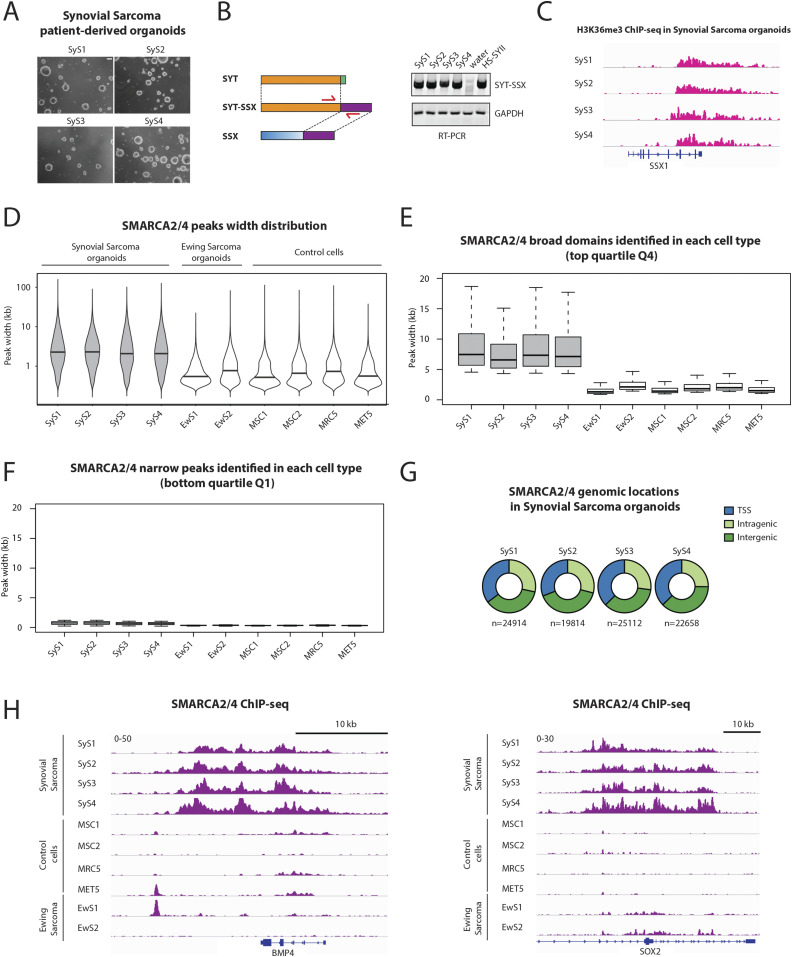
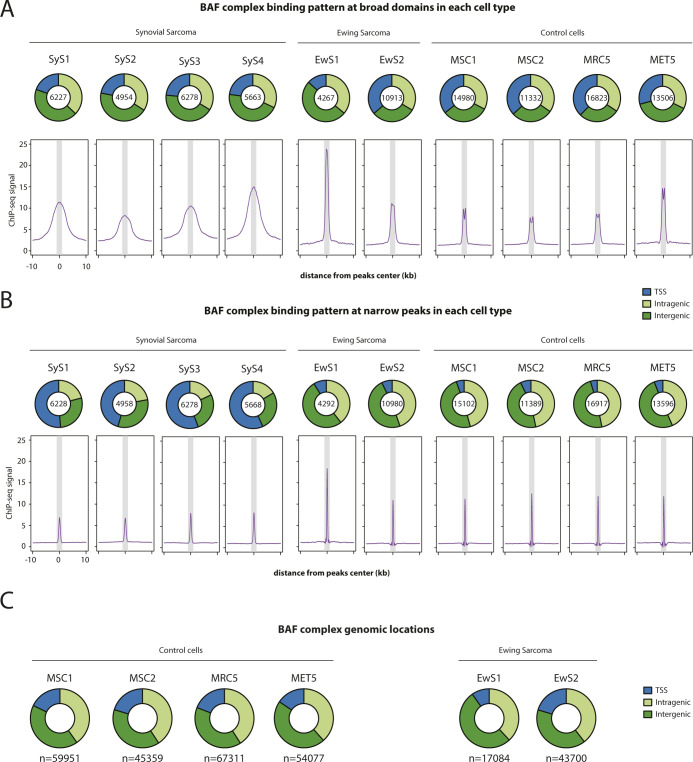
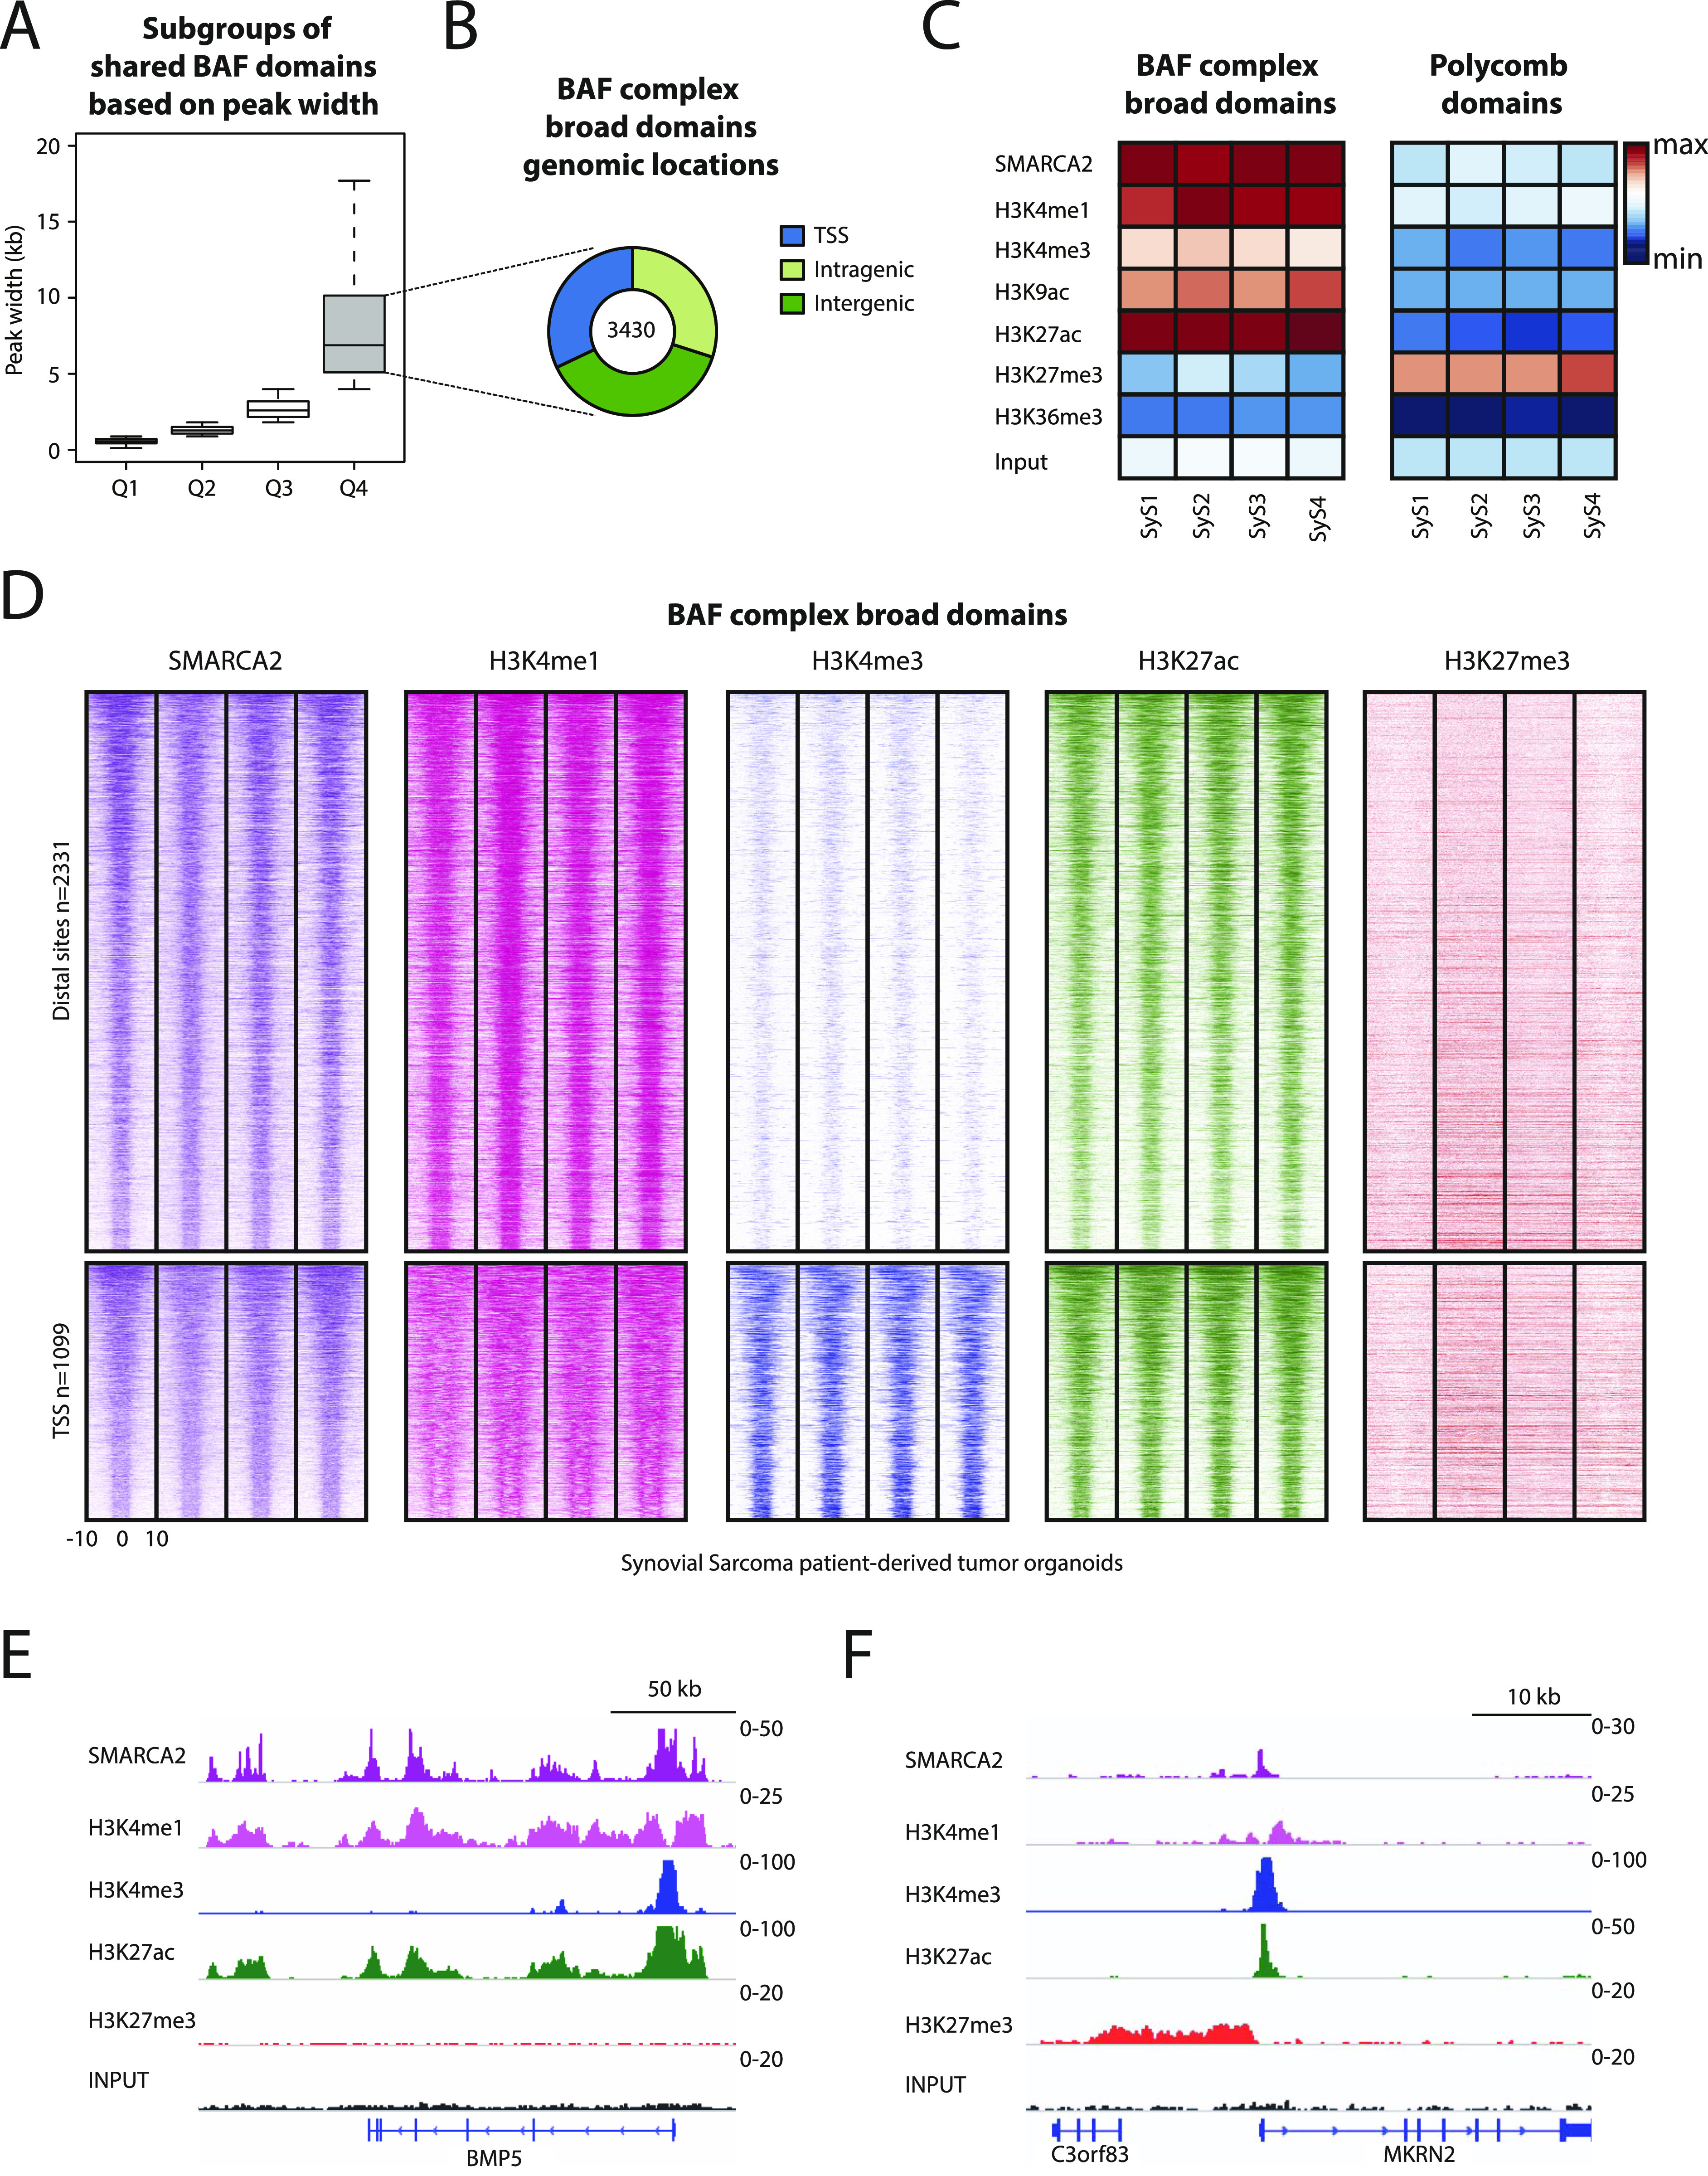
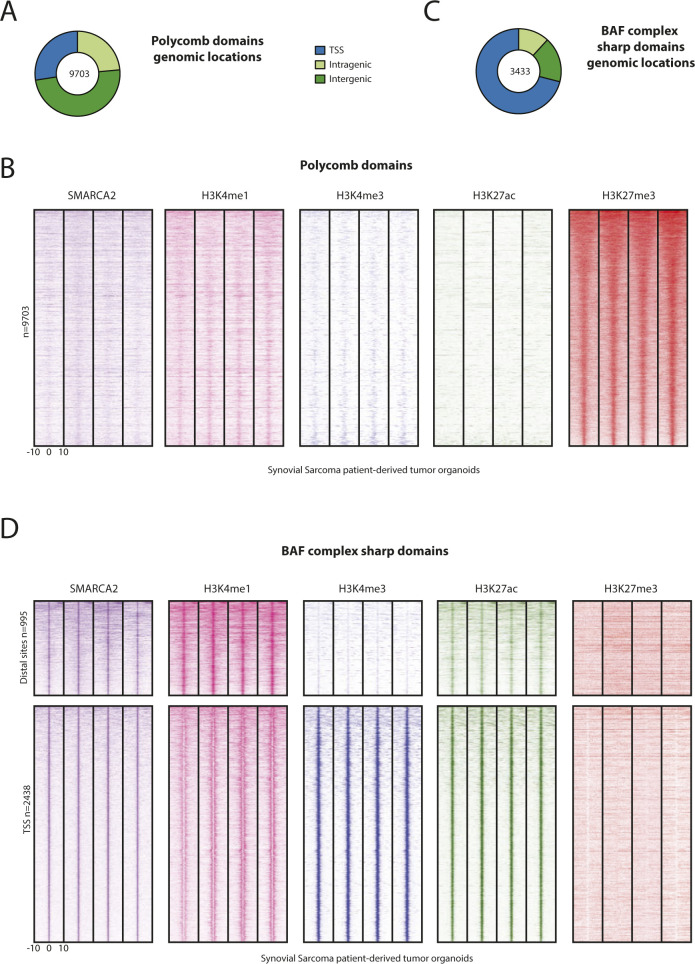
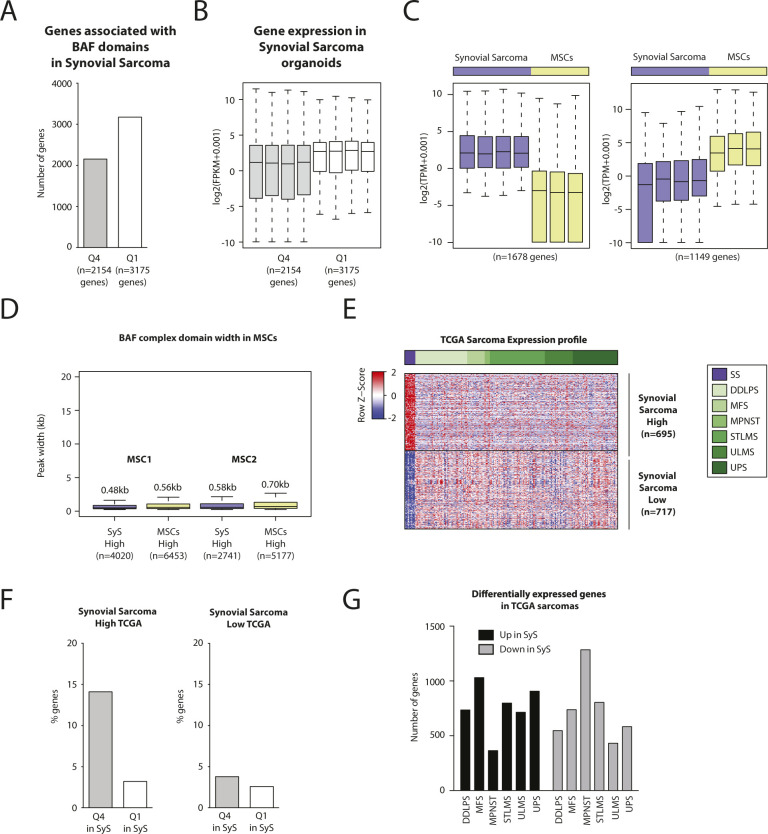
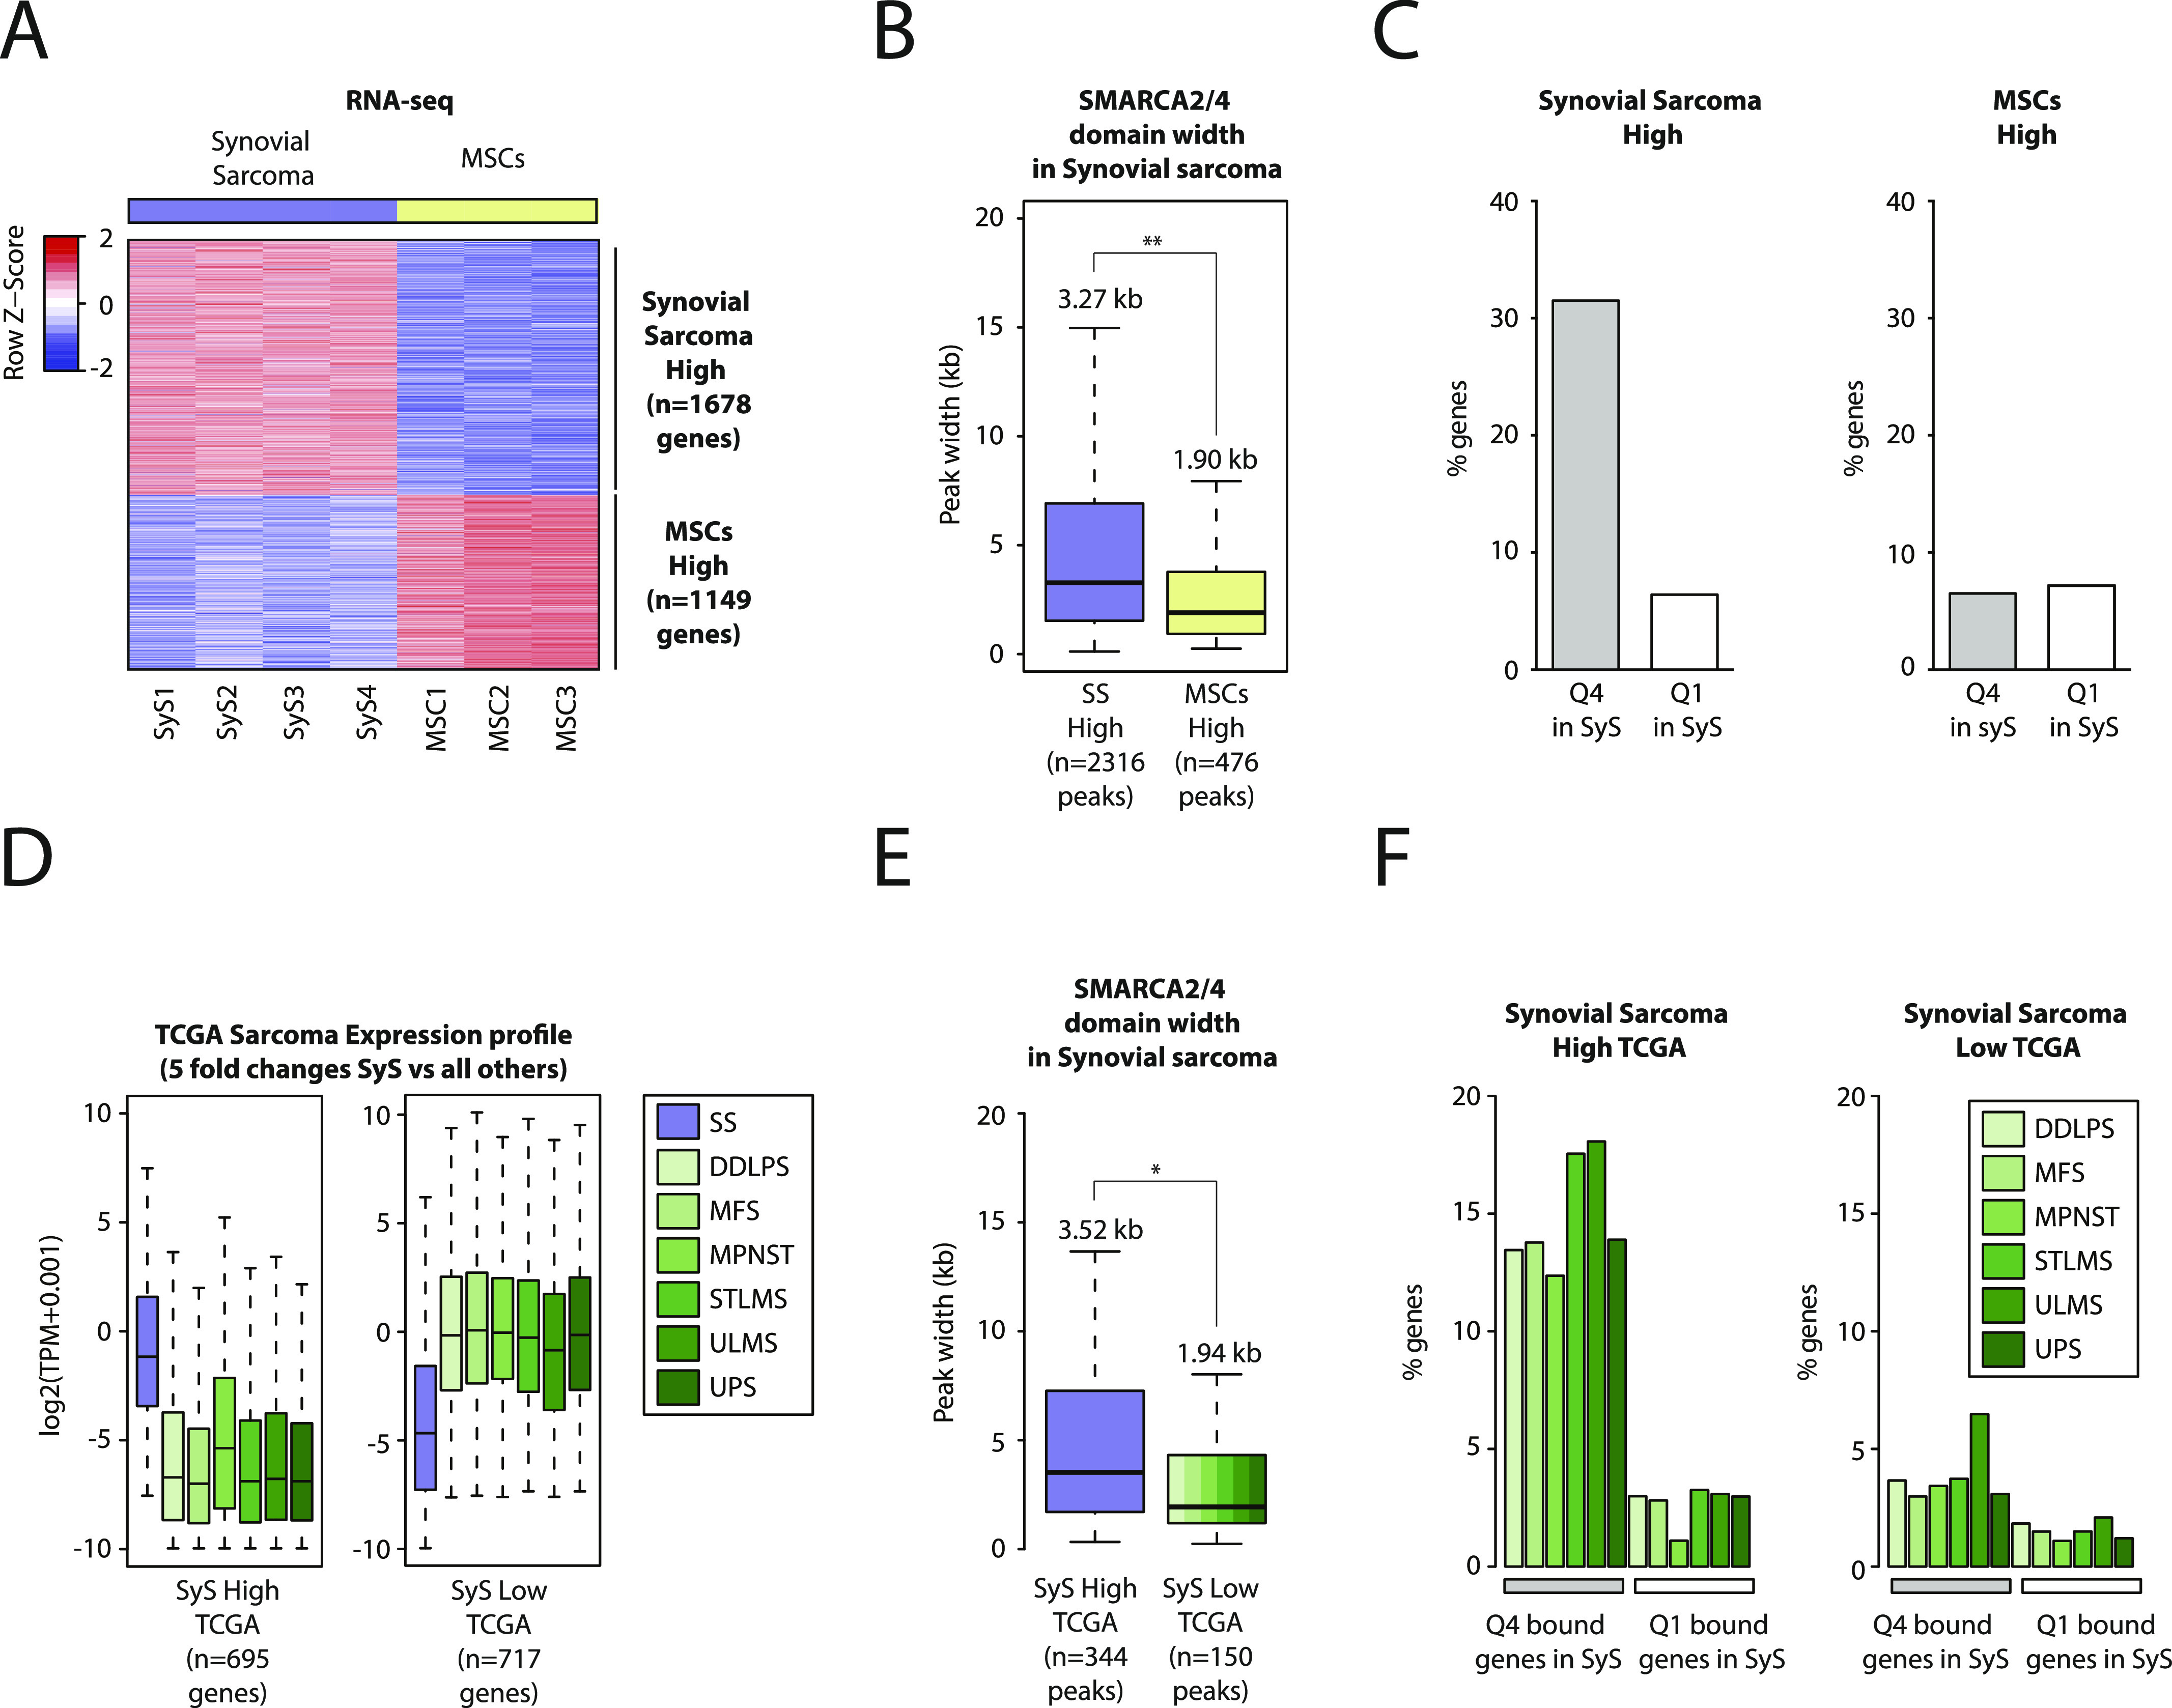
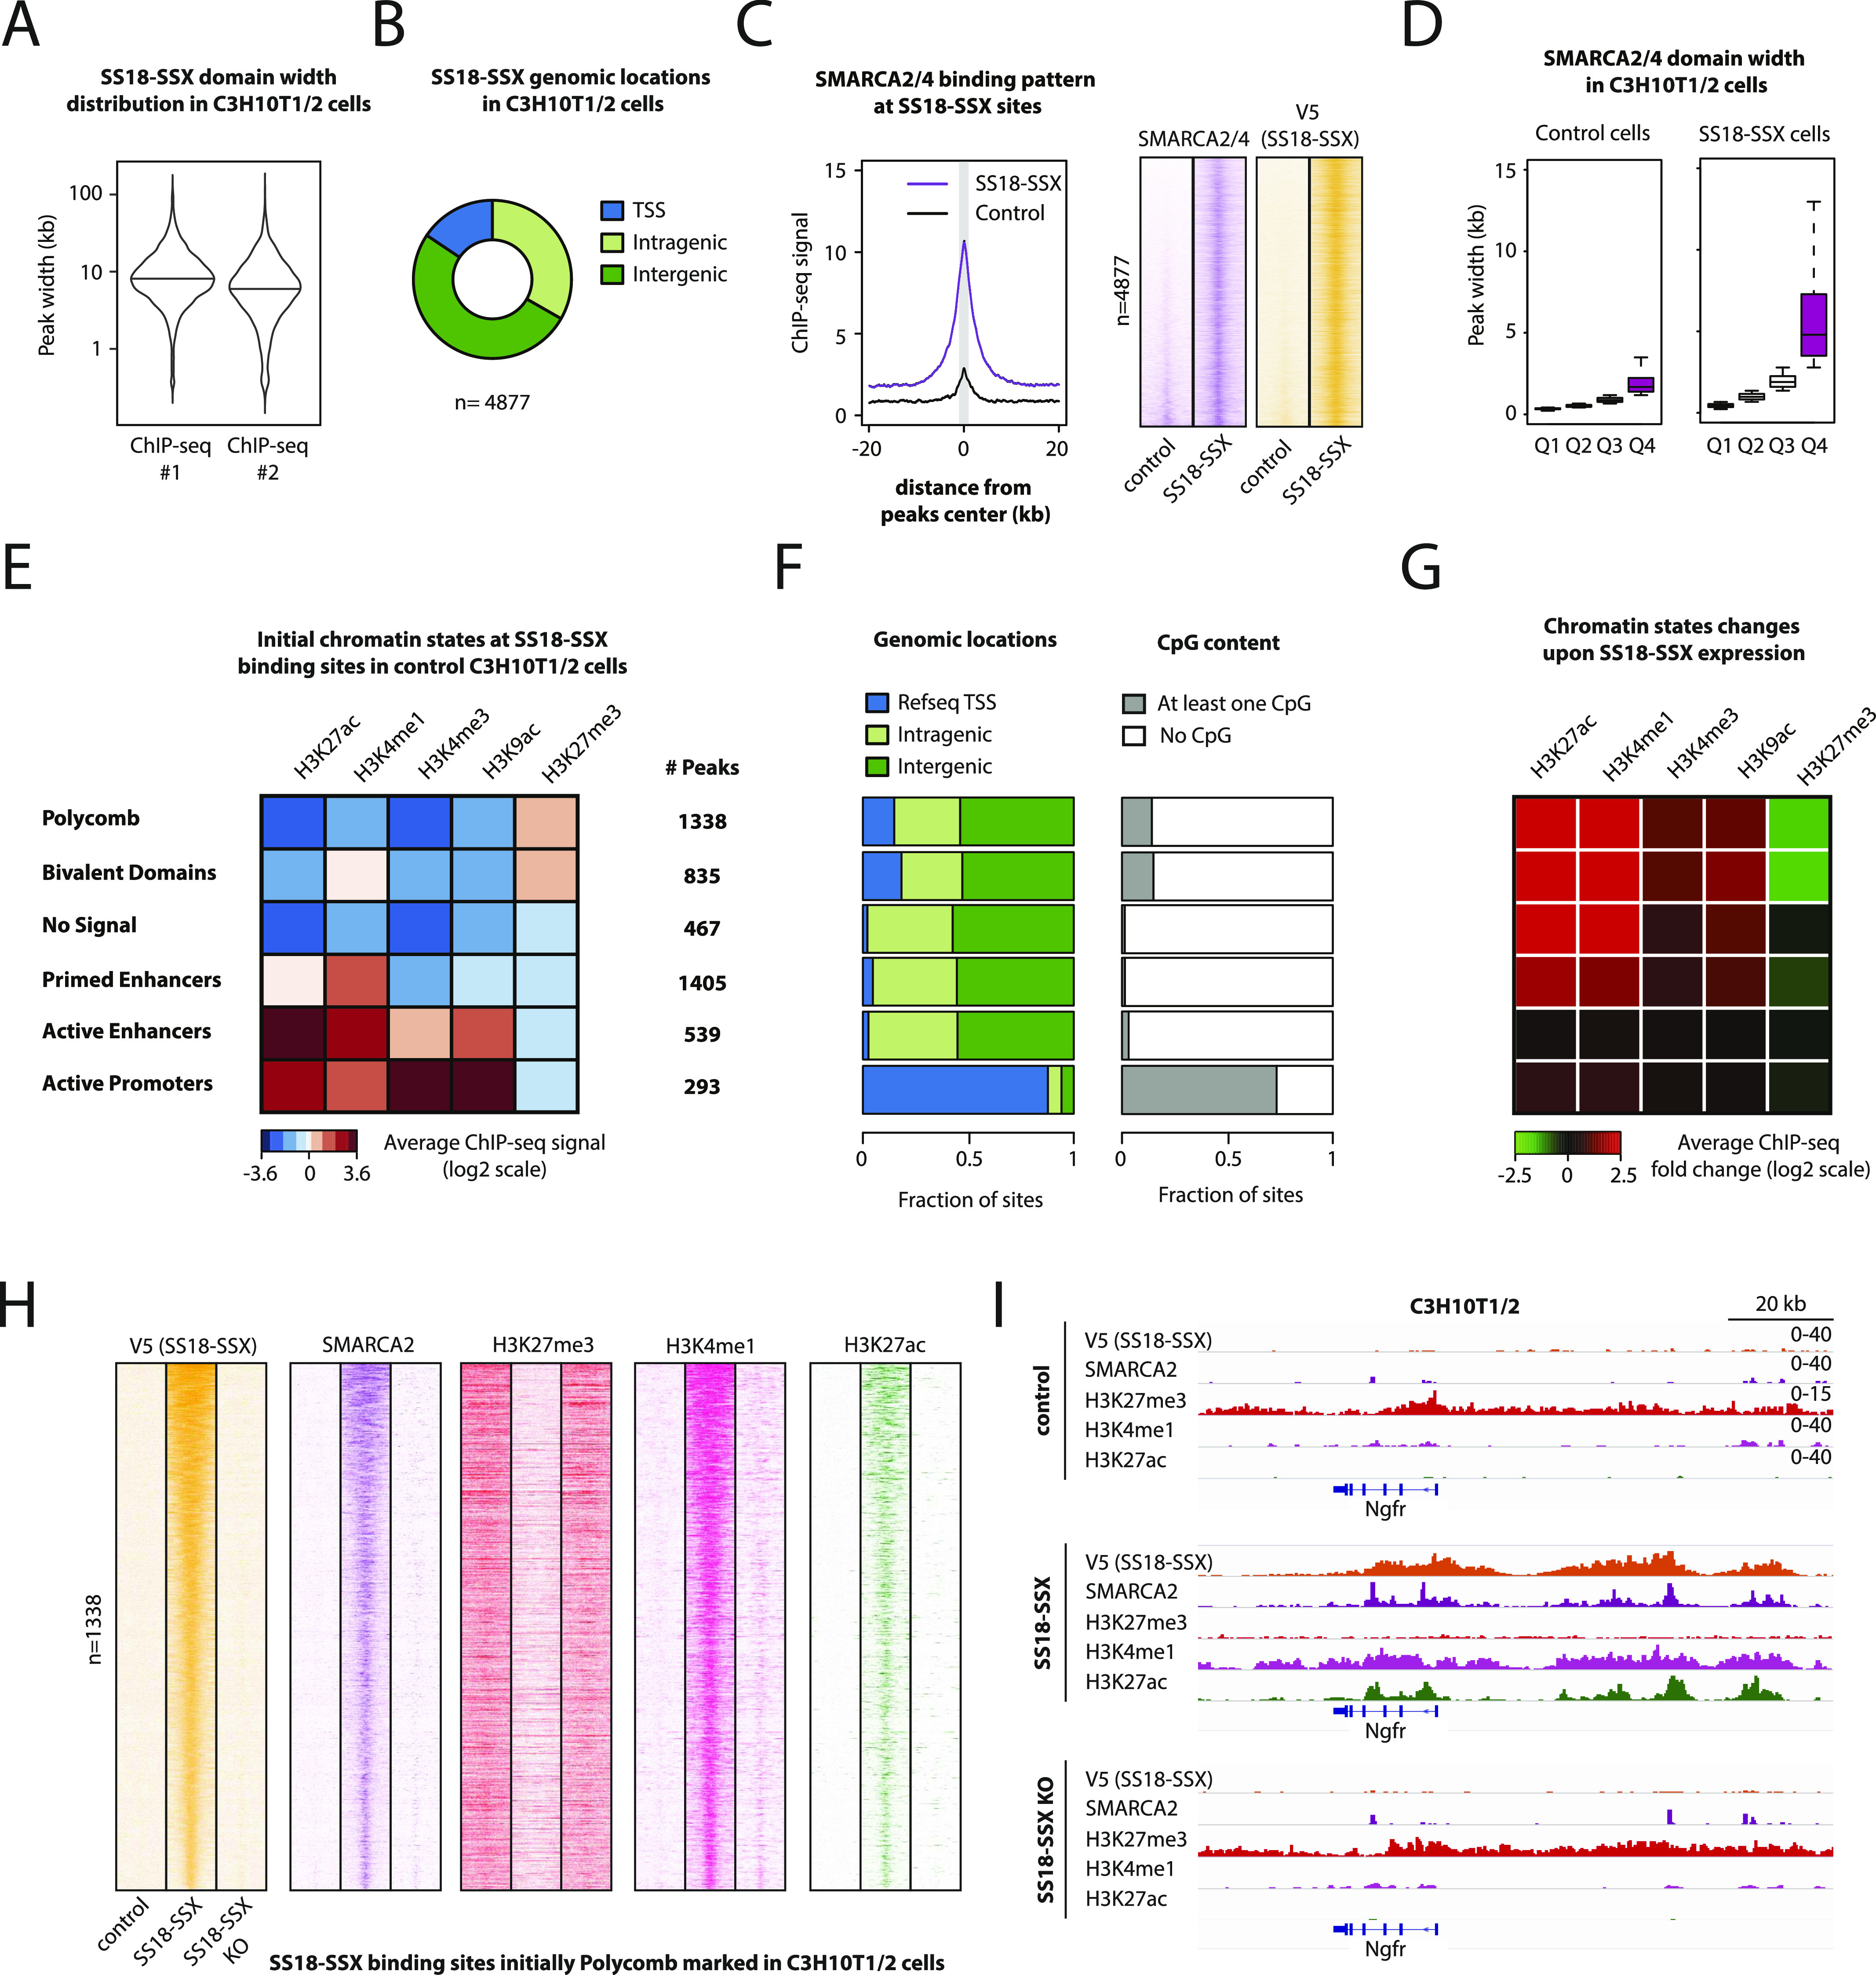
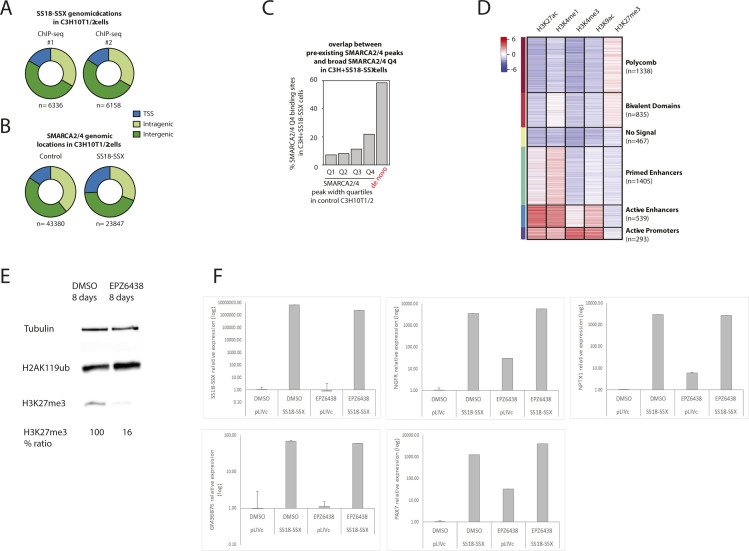
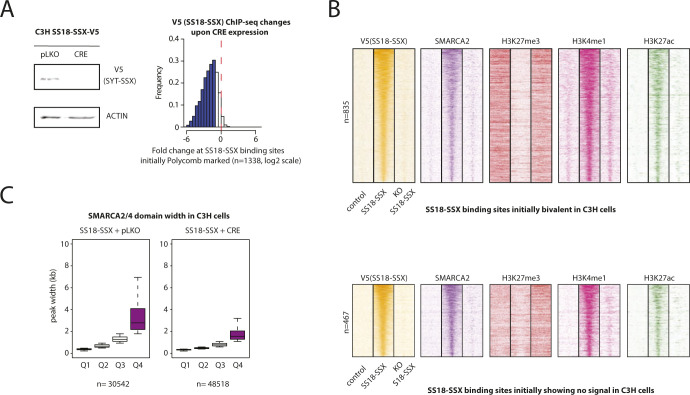
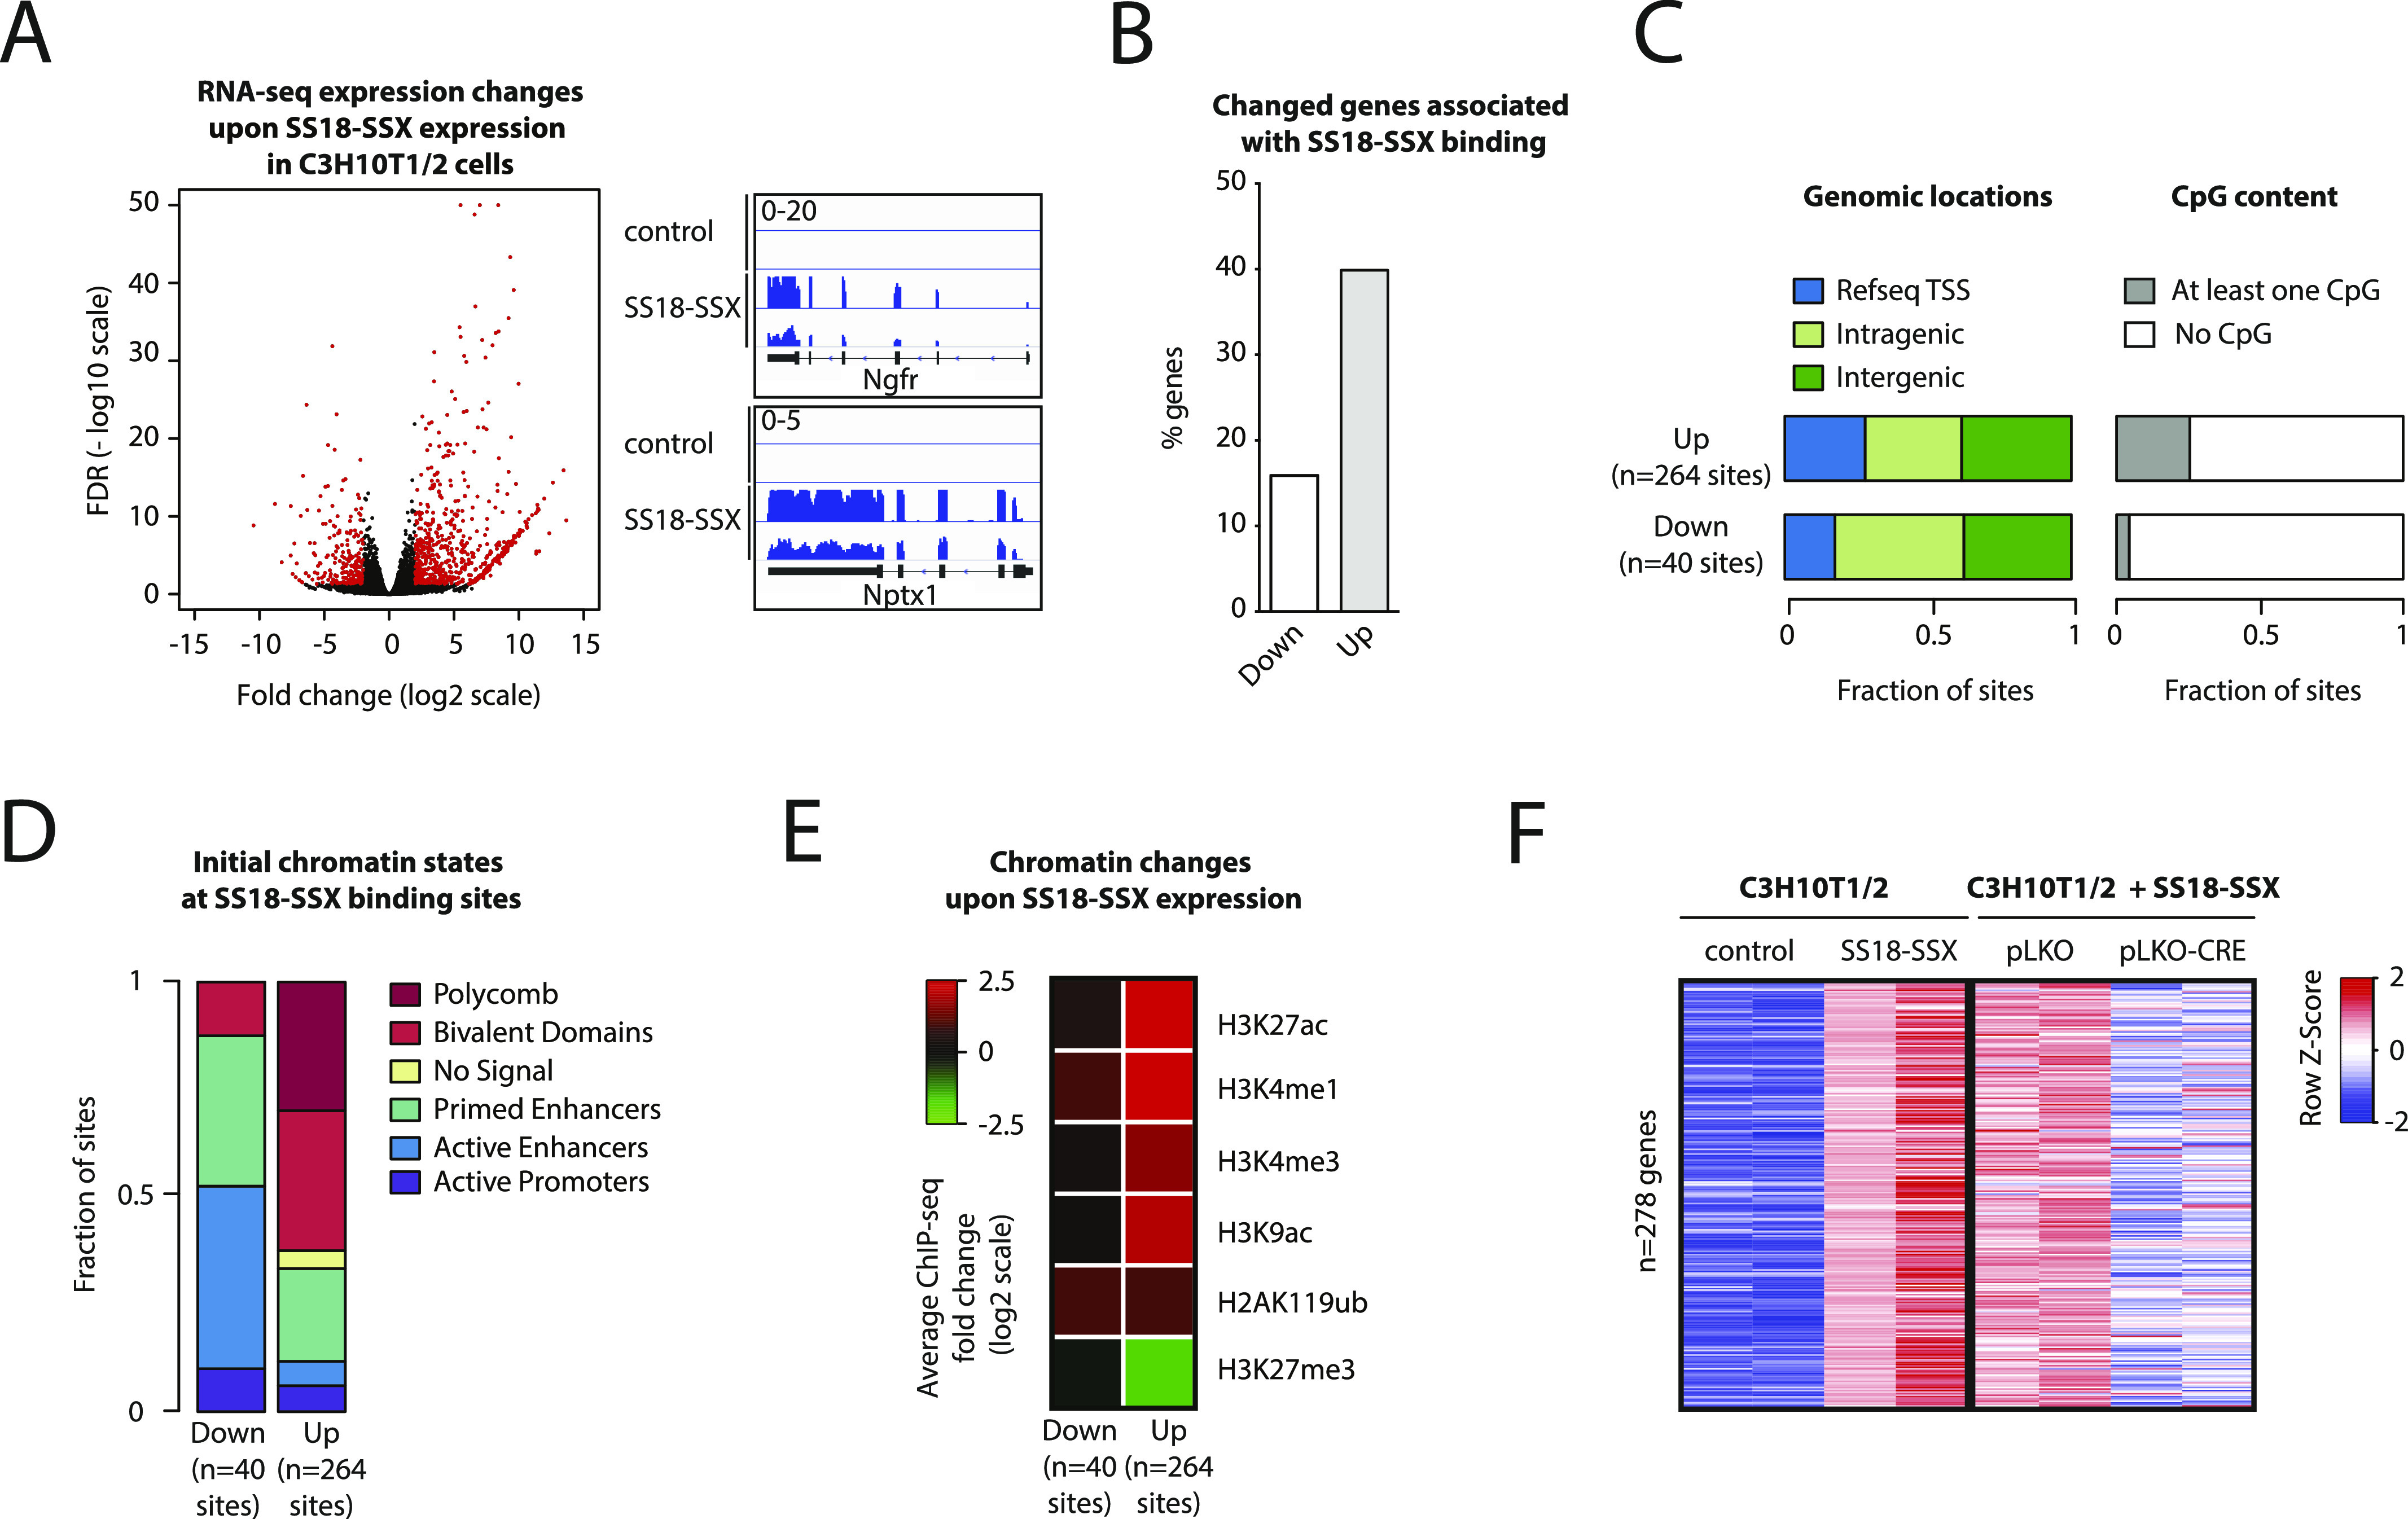
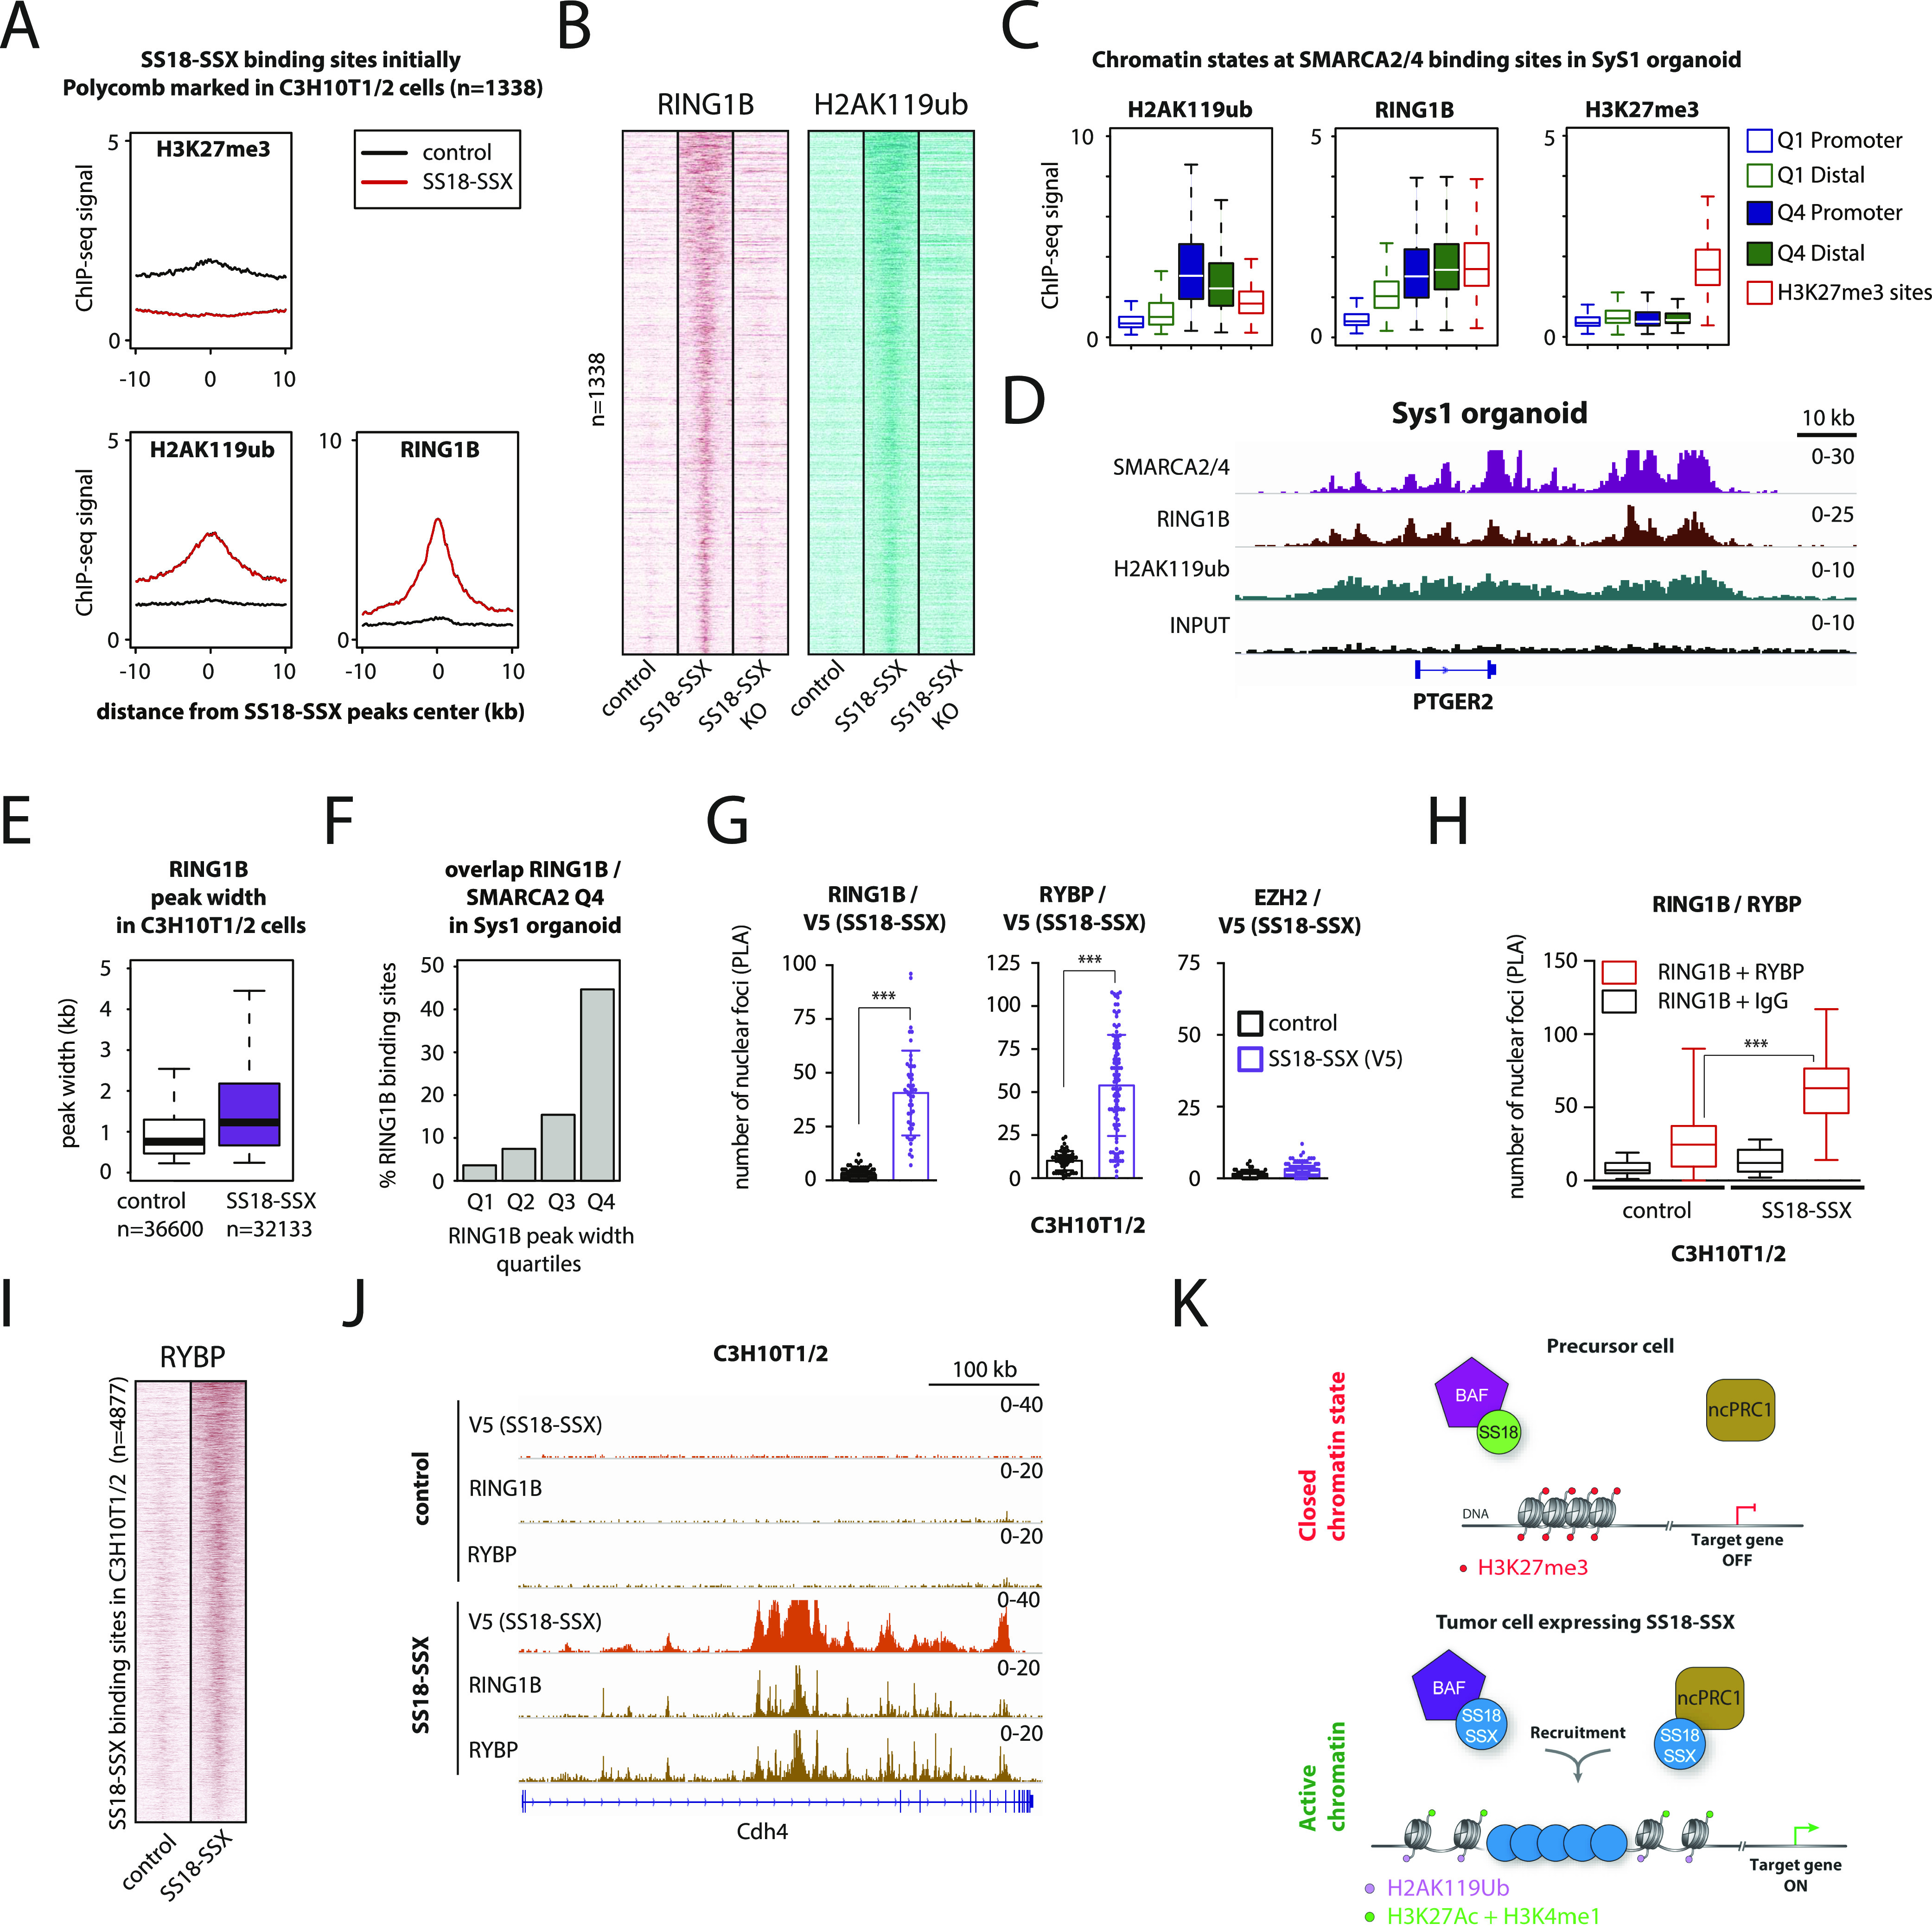
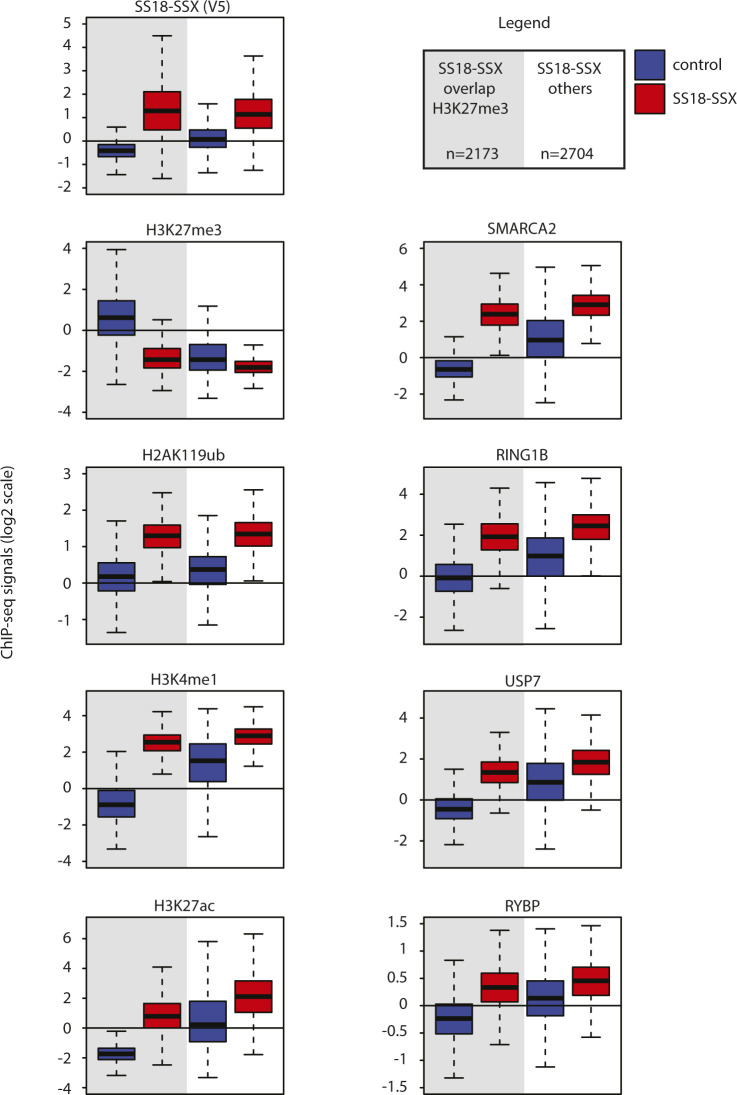
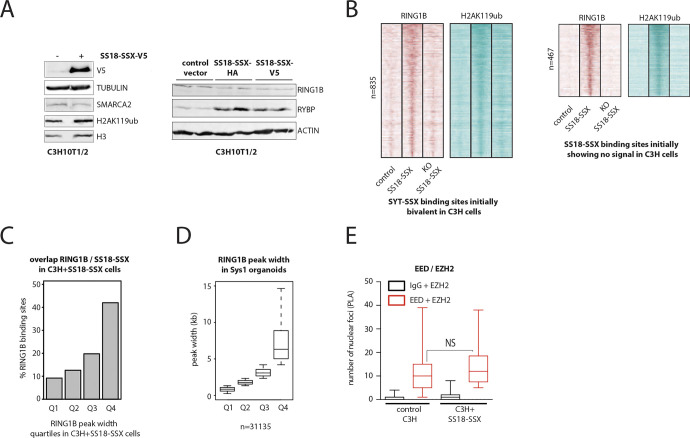
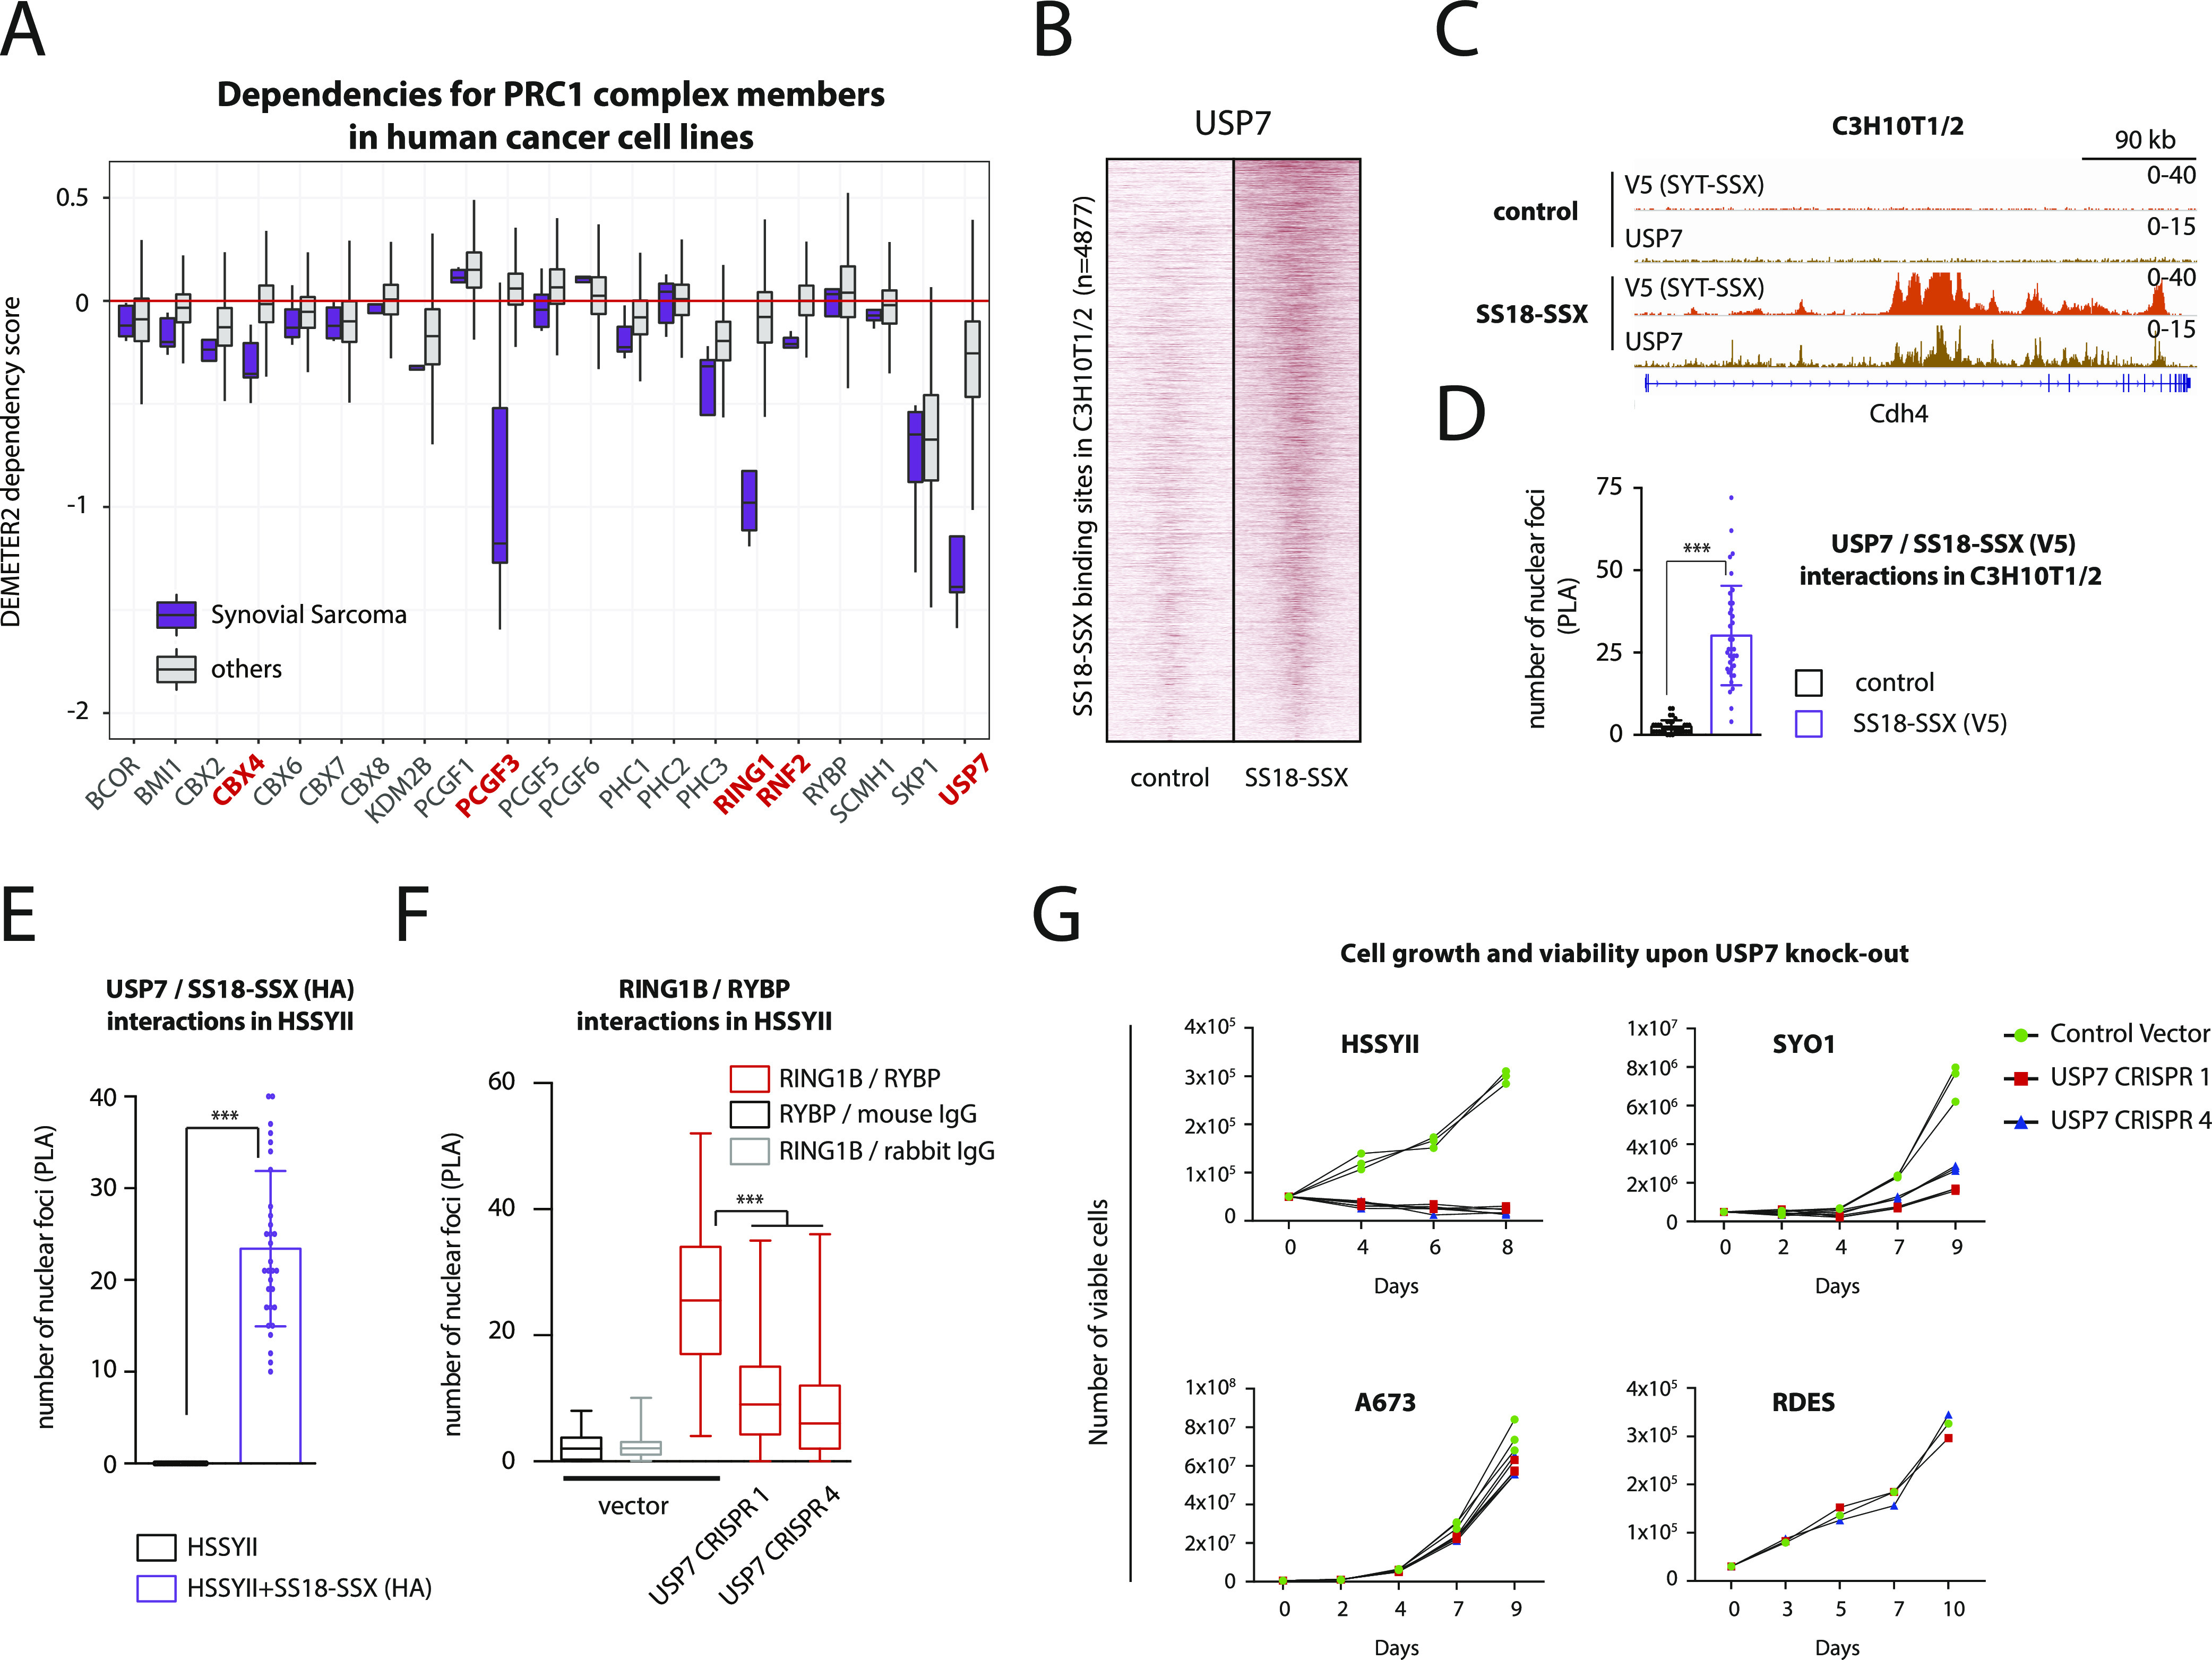
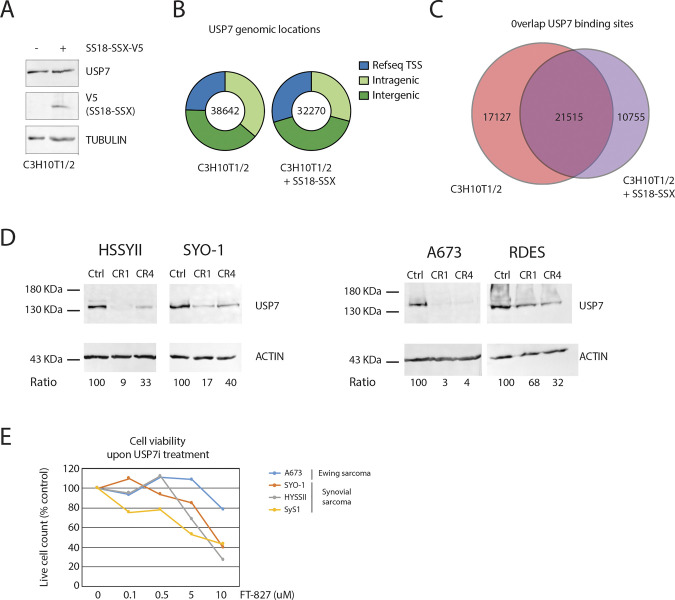
Synovial sarcoma (SyS) is an aggressive mesenchymal malignancy invariably associated with the chromosomal translocation t(X:18; p11:q11), which results in the in-frame fusion of the BAF complex gene SS18 to one of three SSX genes. Fusion of SS18 to SSX generates an aberrant transcriptional regulator, which, in permissive cells, drives tumor development by initiating major chromatin remodeling events that disrupt the balance between BAF-mediated gene activation and polycomb-dependent repression. Here, we developed SyS organoids and performed genome-wide epigenomic profiling of these models and mesenchymal precursors to define SyS-specific chromatin remodeling mechanisms and dependencies. We show that SS18-SSX induces broad BAF domains at its binding sites, which oppose polycomb repressor complex (PRC) 2 activity, while facilitating recruitment of a non-canonical (nc)PRC1 variant. Along with the uncoupling of polycomb complexes, we observed H3K27me3 eviction, H2AK119ub deposition and the establishment of de novo active regulatory elements that drive SyS identity. These alterations are completely reversible upon SS18-SSX depletion and are associated with vulnerability to USP7 loss, a core member of ncPRC1.1. Using the power of primary tumor organoids, our work helps define the mechanisms of epigenetic dysregulation on which SyS cells are dependent.


Conflict of interest statement

The authors declare that they have no conflict of interest.

Figures

Figure 1.
Figure 1.. BAF complex is organized in unusually broad domains in primary synovial sarcoma organoids.
(A) Micrographs show the four patient-derived synovial sarcoma 3D organoid cultures. Scale bar: 200 μm. (B) Schematic representation of the SS18-SSX fusion gene (left) and RT-PCR products showing the detection of SS18-SSX in patient-derived synovial sarcoma organoids. Water is used as a negative control and HSSYII cell line as a positive control. (C) H3K36me3 ChIP-seq signals at the SSX1 locus show active transcription of the 3′ terminal region that becomes fused to SS18 to form the fusion gene SS18-SSX in patient-derived synovial sarcoma organoids. (D) Violin plots show the overall distribution of peak widths for SMARCA2/4–binding sites in four synovial sarcoma patient-derived tumor organoids, two Ewing sarcoma patient-derived tumor organoids (EwS1 and 2) and four control cell types. (E, F) Boxplots show the distribution of peak widths of the (E) broadest BAF complex domains (Q4) and the (F) narrowest BAF complex domains (Q1) identified in each cell type separately. (G) Pie charts show the genomic locations of SMARCA2/4–binding sites in four synovial sarcoma patient-derived tumor organoids. (H) Examples of broad BAF complex domains identified in synovial sarcoma at loci associated with BMP4 and SOX2. See also Fig S1.
Figure S1.
Figure S1.. Related to Fig 1. Comparison of narrow and broad BAF complex–binding sites.
(A, B) Pie charts showing genomic locations (top) and composite plots show SMARCA2/4 ChIP-seq signal distribution (bottom) at broad domains (A, top quartile) and narrow peaks (B, bottom quartile) identified in each cell type. Synovial sarcoma patient-derived tumor organoids are shown on the left and control cells on the right. 20-kb windows centered on SMARCA2/4–binding sites are shown. The gray area shows a 2-kb window. (C) Pie charts showing genomic locations of SMARCA2/4–binding sites in control cells and Ewing sarcoma patient-derived tumor organoids.
Figure 2.
Figure 2.. BAF complex broad domains are associated with active chromatin states in synovial sarcoma.
(A) Boxplot showing the distribution of peak widths for shared BAF complex domains in synovial sarcoma per quartile. (B) Pie chart showing genomic locations of the broadest BAF complex domains shared among synovial sarcoma tumor organoids. (C) Heat maps showing average ChIP-seq signals for SMARCA2/4 and the indicated histone modifications at broad BAF complex domains (left) and polycomb H3K27me3 domains (right) in synovial sarcoma. (D) Heat maps showing ChIP-seq signals for SMARCA2/4, H3K4me1, H3K4me3, H3K27ac, and H3K27me3 at distal sites (top) and promoters (bottom) for broad BAF complex–binding sites in synovial sarcoma. Marks of activity (H3K4me1, H3K4me3, and H3K27ac) are detected but not the polycomb repressive mark H3K27me3. 20-kb windows centered on SMARCA2/4–binding sites are shown. (E) Representative example of BAF complex broad domain and associated histone modifications at the locus associated with BMP5 in synovial sarcoma tumor 3D cultures. (F) Representative example of a polycomb domain in synovial sarcoma organoids. Strong signals are detected for the polycomb repressive mark H3K27me3 but not for SMARCA2/4. See also Fig S2.
Figure S2.
Figure S2.. Related to Fig 2. BAF complex and polycomb domains do not overlap genome-wide in synovial sarcoma.
(A) Pie chart showing common genomic locations of polycomb domains in synovial sarcoma 3D cultures. (B) Heat maps showing ChIP-seq signals for SMARCA2/4, H3K4me1, H3K4me3, H3K27ac, and H3K27me3 at polycomb domains common to synovial sarcoma patient-derived tumor organoids. Strong signals are detected for the polycomb repressive mark H3K27me3 but not for SMARCA2/4. 20-kb windows centered on H3K27me3 peaks are shown. (C) Pie chart showing genomic locations of narrow SMARCA2/4–binding sites common to synovial sarcoma patient-derived tumor organoids (bottom quartile identified in Fig 2A). (D) Heat maps showing ChIP-seq signals for SMARCA2/4, H3K4me1, H3K4me3, H3K27ac, and H3K27me3 at distal sites (top) and promoters (bottom) for narrow BAF complex–binding sites common to synovial sarcoma organoids. Marks of activity (H3K4me1, H3K4me3, and H3K27ac) are detected but not the polycomb repressive mark H3K27me3. 20-kb windows centered on SMARCA2/4–binding sites are shown.
Figure S3.
Figure S3.. Related to Fig 3. Broad BAF domains are enriched at genes specifically expressed in synovial sarcoma.
(A) Barplot showing the number of genes associated with broad (Q4) and narrow BAF domains (Q1) in synovial sarcoma organoids. (B) Boxplot showing expression levels of the genes associated with broad (Q4) and narrow BAF domains (Q1) in synovial sarcoma organoids. (C) Boxplot showing the genes that are differentially expressed between synovial sarcoma organoids and mesenchymal stem/stromal cells (MSCs) shown in Fig 3A. (D) Boxplots showing the distribution of peak widths for BAF complex domains in MSCs at genes that are highly expressed in Sys organoids (purple) and the genes that are highly expressed in MSCs (yellow) identified in Fig 3A. Median values are indicated. (E) Heat map showing the genes that are differentially expressed between primary synovial sarcomas and other sarcomas from The Cancer Genome Atlas shown in Fig 3D. (F) Barplot showing the percentage of genes identified in Fig 3D bound by either a broad (Q4) or a narrow BAF domain (Q1) in synovial sarcoma organoids. (G) Barplot showing the number of genes that are differentially expressed between primary synovial sarcomas and all other sarcomas from The Cancer Genome Atlas taken individually.
Figure 3.
Figure 3.. Broad BAF complex domains are enriched at genes specifically expressed in synovial sarcoma.
(A) Heat map showing the genes that are differentially expressed between synovial sarcoma organoids and mesenchymal stem cells (fourfold differential expression). (A, B) Boxplot showing the distribution of peak widths for BAF complex domains in synovial sarcoma 3D cultures at genes highly expressed in synovial sarcoma (purple) and at genes highly expressed in mesenchymal stem cells (yellow) identified in (A). Median peak width values are indicated. (A, C) Barplot showing the percentage of genes identified in (A) bound by either a broad (Q4) or a narrow BAF domain (Q1) in synovial sarcoma organoids. (D) Boxplot showing the genes that are differentially expressed between primary synovial sarcomas and other sarcomas from The Cancer Genome Atlas (fivefold differential expression). (D, E) Boxplot showing the peak width distribution of BAF complex domains in synovial sarcoma organoids at genes highly expressed in synovial sarcoma (purple) versus the genes highly expressed in other sarcomas (green shades) identified in (D). Median values are indicated. (F) Barplot showing the percentage of genes identified by comparing primary synovial sarcomas to other sarcomas from The Cancer Genome Atlas independently (20-fold differential expression) bound by either a broad (Q4) or a narrow BAF domain (Q1) in synovial sarcoma organoids. * indicates P-value < 0.05, ** indicates P-value < 0.01 for a Welch two-sample t test with a 95% confidence interval. See also Fig S3.
Figure 4.
Figure 4.. SS18-SSX can induce broad BAF complex domains and evict polycomb activity.
(A) Violin plot showing the overall distribution of peak widths for SS18-SSX–binding sites in C3H10T1/2 cells stably expressing the fusion protein in two independent ChIP-seq experiments. (B) Pie chart showing genomic locations of common SS18-SSX–binding sites in C3H10T1/2 cells stably expressing the fusion protein. (C) Left: Composite plot showing the average SMARCA2/4 ChIP-seq signals at SS18-SSX–binding sites in control cells (black) and cells expressing SS18-SSX (purple). Right: Heat maps showing ChIP-seq signals for SMARCA2/4 and V5 (SS18-SSX) at SS18-SSX–binding sites in control and SS18-SSX–expressing C3H10T1/2 cells. (D) Boxplot showing the distribution of peak widths for SMARCA2/4 in control (left) and SS18-SSX–expressing cells (right) per quartile. (E) Heat map showing average initial ChIP-seq signals for the indicated histone modifications in control cells at SS18-SSX–binding sites. The six indicated categories of binding sites were obtained using hierarchical clustering and manually annotated based on chromatin states. (F) Bar charts showing genomic locations (left) and annotation of CpG content (right) for each category of SS18-SSX–binding sites. (E, G) Heat map showing changes of the indicated histone modifications at each category of SS18-SSX–binding sites identified in (E). Average log2 fold changes in ChIP-seq signals are displayed. (E, H) Heat maps showing ChIP-seq signals for V5 (SS18-SSX), SMARCA2/4, H3K27me3, H3K4me1, and H3K27ac at SS18-SSX–binding sites that bore the polycomb mark H3K27me3-in control C3H10T1/2 shown in (E) before SS18-SSX expression. 20-kb windows centered on SS18-SSX–binding sites are shown. (I) Representative example of broad BAF complex domains replacing preexisting H3K27me3 polycomb domains. See also Fig S4.
Figure S4.
Figure S4.. Related to Fig 4. SS18-SSX chromatin binding and activity are independent of preexisting H3K27me3.
(A) Pie charts showing genomic locations of SS18-SSX–binding sites in C3H10T1/2 cells stably expressing SS18-SSX in two independent ChIP-seq experiments. (B) Pie charts showing genomic locations of SMARCA2/4–binding sites in control and SS18-SSX–expressing C3H10T1/2 cells. (C) Barplot showing the percentage of preexisting and de novo SMARCA2 domains in each width quartile overlapping with SS18-SSX–binding sites in C3H10T1/2 cells transduced with SS18-SSX. (D) Heat map showing initial ChIP-seq signals for the indicated histone modifications in control cells at SS18-SSX–binding sites. The indicated categories were defined by hierarchical clustering and manually annotated based on chromatin states. (E) Western blot analysis of H3K27me3 and H2AK119ub expression levels in control (DMSO) and EPZ6438-treated C3H10T1/2 cells. Densitometric analysis, using ImageJ software package, is reported. (F) qPCR analysis of a panel of SS18-SSX target genes in control (DMSO) and EPZ6438-treated C3H10T1/2 cells infected with either Empty (pLIVc) or SS18-SSX–expressing lentiviral vectors. Error bars represent the SD of triplicate tests. Relative expression is reported on a logarithmic scale.
Figure S5.
Figure S5.. Related to Figs 4 and 5. Reversibility of the chromatin remodeling events induced by SS18-SSX in mouse C3H10T1/2 cells.
(A) Left: Immunoblot showing loss of V5-SS18-SSX in C3H10T1/2 cells upon CRE expression. Right: Histogram showing changes in V5 (SS18-SSX) ChIP-seq signals upon SS18-SSX removal in C3H10T1/2 cells expressing SS18-SSX at binding sites that bore the polycomb mark in control cells (n = 1,338 sites identified). (B) Heat maps showing ChIP-seq signals for V5 (SS18-SSX), SMARCA2/4, H3K27me3, H3K4me1, and H3K27ac at SS18-SSX–binding sites initially identified in control cells as bivalent or without signals (Fig 4E). 20-kb windows centered on SS18-SSX–binding sites are shown. (C) Boxplot showing the distribution of peak widths for SMARCA2/4 in C3H10T1/2 cells expressing SS18-SSX upon control pLKO vector (left) or CRE expression (right) per quartile.
Figure 5.
Figure 5.. SS18-SSX can induce strong gene expression changes through reversible chromatin modification mechanisms.
(A) Left: Volcano plot showing gene expression changes upon stable SS18-SSX expression in C3H10T1/2 cells. Red dots indicate genes differentially expressed (at least fourfold change and adjusted P-value < 0.05). Right: Representative examples of genes strongly activated upon SS18-SSX expression. (B) Barplot showing the percentage of up- and down-regulated genes upon SS18-SSX expression associated with SS18-SSX binding. (C) Bar charts showing genomic locations (left) and annotation of CpG content (right) of SS18-SSX–binding sites associated with up- and down-regulated genes. (D) Bar chart showing the distribution of initial chromatin states as defined in Fig 4E at SS18-SSX–binding sites associated with up- and down-regulated genes. (E) Heat map showing ChIP-seq changes for the indicated histone modifications at SS18-SSX–binding sites associated with up- and down-regulated genes. (F) Heat map showing gene expression changes upon SS18-SSX expression in C3H10T1/2 cells (left) and upon SS18-SSX removal (right). See also Figs S5 and S6.
Figure 6.
Figure 6.. SS18-SSX expression results in a functional PRC1–PRC2 complex uncoupling at its genomic binding sites.
(A) Composite plots for RING1B, H2AK119ub, and H3K27me3 signals at 1338 SS18-SSX–binding sites, initially bearing the PRC2 repressive mark, showing that expression of the fusion protein in C3H10T1/2 cells results in an increase in the RING1B and H2AK119ub signals, and the removal of the H3K27me3 mark. (A, B) Heat maps for RING1B and H2AK119ub signals at the same 1338 SS18-SSX–binding sites as in (A), illustrating the reversibility of the chromatin remodeling pattern upon CRE-mediated SS18-SSX depletion in C3H10T1/2 cells. 20-kb windows centered on SS18-SSX–binding sites are shown. (C) Boxplot analysis of the RING1B, H2AK119ub, and H3K27me3 ChIP-seq signals in primary SyS 1 organoids, confirming the presence of PRC1 and the related H2AK119ub mark, but not the PRC2 mark H3K27me3, at broad BAF domains in primary SyS tumor models. (D) Representative example of RING1B recruitment and H2AK119ub deposition at a broad BAF complex domain in SyS organoid cultures. (E) Boxplot showing the distribution of peak widths for RING1B in control and SS18-SSX–expressing C3H10T1/2 cells. (F) Barplot depicting the percentage of RING1B-binding sites in each width quartile that overlap with the broadest SMARCA2/4 domains in SyS organoids. (G) Proximity ligation assay analyses demonstrate direct interactions between SS18-SSX and the PRC1 subunits RING1B and RYBP, but not the PRC2 core member EZH2, in C3H10T1/2 cells. (H) Proximity ligation assay analysis of SS18-SSX–expressing or control C3H10T1/2 cells confirming that the expression of the fusion protein enhances the assembly of the ncPRC1, as indicated by the increase in interactions between its core members RING1B and RYBP. (I) Heat map showing ChIP-seq signals for RYBP at SS18-SSX–binding sites in C3H10T1/2 cells. 20-kb windows centered on SS18-SSX–binding sites are shown. (J) Representative example of RING1B and RYBP recruitment at SS18-SSX–binding sites in C3H10T1/2 cells. (K) A mechanistic model of SS18-SSX chromatin remodeling activity in SyS. After SS18-SSX expression, the PRC2 repressive mark H3K27me3 is replaced by the active histone modifications H3K4me1 and H3K27ac. The concomitant recruitment of a non-canonical PRC1 by the fusion protein leads to PRC2-PRC1 uncoupling, H2AK119ub deposition and target gene activation. *** indicates P-value < 0.0001. Statistical analyses were performed by t test. See also Fig S7.
Figure S6.
Figure S6.. Related to Figs 4 and 5. Comparison of SS18-SSX–induced chromatin remodeling events at the fusion protein–binding sites initially pre-marked or not by H3K27me3 in C3H10T1/2 cells.
Boxplots showing overall ChIP-seq signals of Histone marks, polycomb complex components (indicated) and SMARCA2/4, at SS18-SSX–binding sites in control and SS18-SSX–expressing C3H10T1/2 cells. SS18-SSX recruits BAF and ncPRC1 and activates chromatin independently of a preexisting H3K27me3 signal.
Figure S7.
Figure S7.. Related to Fig 6. SS18-SSX directly recruits the ncPRC1 complex at its binding sites.
(A) Immunoblot showing SS18-SSX-V5 expression and SMARCA2, RYBP, RING1B, and H2AK119ub protein levels in C3H10T1/2 cells. Tubulin, actin, and histone H3 are used as loading controls. (B) Heat maps showing ChIP-seq signals for RING1B and H2AK119ub at SS18-SSX–binding sites initially bivalent or without signal in C3H10T1/2. The effect of SS18-SSX protein depletion is shown. (C) Barplot showing the percentage of RING1B-binding sites in each width quartile overlapping with SS18-SSX domains in C3H10T1/2 cells transduced with SS18-SSX. (D) Boxplot showing the distribution of peak widths for RING1B in synovial sarcoma organoids per quartile. (E) Boxplot showing the distribution of proximity ligation assay signals representing the interactions between EED and EZH2 in control and SS18-SSX–expressing C3H10T1/2 cells. Species matched irrelevant IgG were used as a negative control. Source data are available for this figure.
Figure 7.
Figure 7.. USP7 depletion constitutes an epigenetic vulnerability in synovial sarcoma.
(A) Gene dependency score analysis for a panel of PRC1 members in SyS versus all other cell lines present in the DepMap database identifies USP7 as a selective vulnerability in SyS. Genes shown in red had an adjusted P-value < 0.05. (B) Heat map showing ChIP-seq signals for USP7 at 4877 SS18-SSX–binding sites in C3H10T1/2 cells. 20-kb windows centered on SS18-SSX–binding sites are shown. (C) Representative example of USP7 recruitment by SS18-SSX at its binding sites in C3H10T1/2 cells. (D, E) Proximity ligation assay analysis demonstrates direct interaction between USP7 and SS18-SSX in C3H10T1/2 and HSSYII SyS cells. (F) Proximity ligation assay shows a significant decrease in interactions between the ncPRC1 members RING1B and RYBP following USP7 removal in HSSYII cells. (G) Cell viability assays in SyS (HSSYII, SYO1) and EwS (A673, RDES) cells upon CRISPR-mediated USP7 KO confirm the selective detrimental effect of USP7 depletion in the SyS cells. *** indicates P-value < 0.0001. Statistical analyses were performed by t test. See also Fig S8.
Figure S8.
Figure S8.. Related to Fig 7. SS18-SSX recruits USP7 at its binding sites.
(A) Immunoblots showing that the expression of SS18-SSX-V5 does not change USP7 protein levels in C3H10T1/2 cells. Tubulin is used as a loading control. (B) Pie charts showing genomic distribution of USP7-binding sites in control and SS18-SSX–expressing C3H10T1/2 cells. (C) Venn diagrams showing the overlap between USP7-binding sites in control and SS18-SSX–expressing C3H10T1/2 cells. (D) Immunoblots confirm USP7 knockout in synovial sarcoma (HSSYII and SYO1) and Ewing sarcoma (A673 and RDES) cell lines. Actin is used as a loading control and densitometric analysis is reported as a percentage. (E) Effect of the USP7 inhibitor FT827 on growth and viability of Ewing sarcoma (A673) and synovial sarcoma (HSSYII and SYO1) cell lines, as well as synovial sarcoma organoids (SyS1). Cells were seeded in 100 mm plates at low concentration and treated for 72 h with the indicated amount of FT827 or vehicle (DMSO). The number of viable cells was evaluated by a trypan blue exclusion assay using an automated cell counter Countess II (Thermo Fisher Scientific). Mean values of triplicate counts are shown as a percentage with the mean value for vehicle treated cells set as 100%. Source data are available for this figure.

References

    1. Banito A, Li X, Laporte AN, Roe JS, Sanchez-Vega F, Huang CH, Dancsok AR, Hatzi K, Chen CC, Tschaharganeh DF, et al. (2018. a) The SS18-SSX oncoprotein hijacks KDM2B-PRC1.1 to drive synovial sarcoma. Cancer Cell 34: 346–348. 10.1016/j.ccell.2018.07.006 - DOI - PMC - PubMed
    1. Banito A, Li X, Laporte AN, Roe JS, Sanchez-Vega F, Huang CH, Dancsok AR, Hatzi K, Chen CC, Tschaharganeh DF, et al. (2018. b) The SS18-SSX oncoprotein hijacks KDM2B-PRC1.1 to drive synovial sarcoma. Cancer Cell 33: 527–541.e8. 10.1016/j.ccell.2018.01.018 - DOI - PMC - PubMed
    1. Brien GL, Remillard D, Shi J, Hemming ML, Chabon J, Wynne K, Dillon ET, Cagney G, Van Mierlo G, Baltissen MP, et al. (2018) Targeted degradation of BRD9 reverses oncogenic gene expression in synovial sarcoma. Elife 7: e41305 10.7554/elife.41305 - DOI - PMC - PubMed
    1. Cancer Genome Atlas Research Network. Electronic address edsc, Cancer Genome Atlas Research Network (2017) Comprehensive and integrated genomic characterization of adult soft tissue sarcomas. Cell 171: 950–965.e28. 10.1016/j.cell.2017.10.014 - DOI - PMC - PubMed
    1. Cironi L, Petricevic T, Fernandes Vieira V, Provero P, Fusco C, Cornaz S, Fregni G, Letovanec I, Aguet M, Stamenkovic I (2016) The fusion protein SS18-SSX1 employs core Wnt pathway transcription factors to induce a partial Wnt signature in synovial sarcoma. Sci Rep 6: 22113 10.1038/srep22113 - DOI - PMC - PubMed

Publication types