. 2021 Feb 24;95(6):e02357-20.
doi: 10.1128/JVI.02357-20. Print 2021 Feb 24.

Diverse Populations of Extracellular Vesicles with Opposite Functions during Herpes Simplex Virus 1 Infection

Affiliations

Diverse Populations of Extracellular Vesicles with Opposite Functions during Herpes Simplex Virus 1 Infection

Christos Dogrammatzis et al. J Virol. .

Abstract

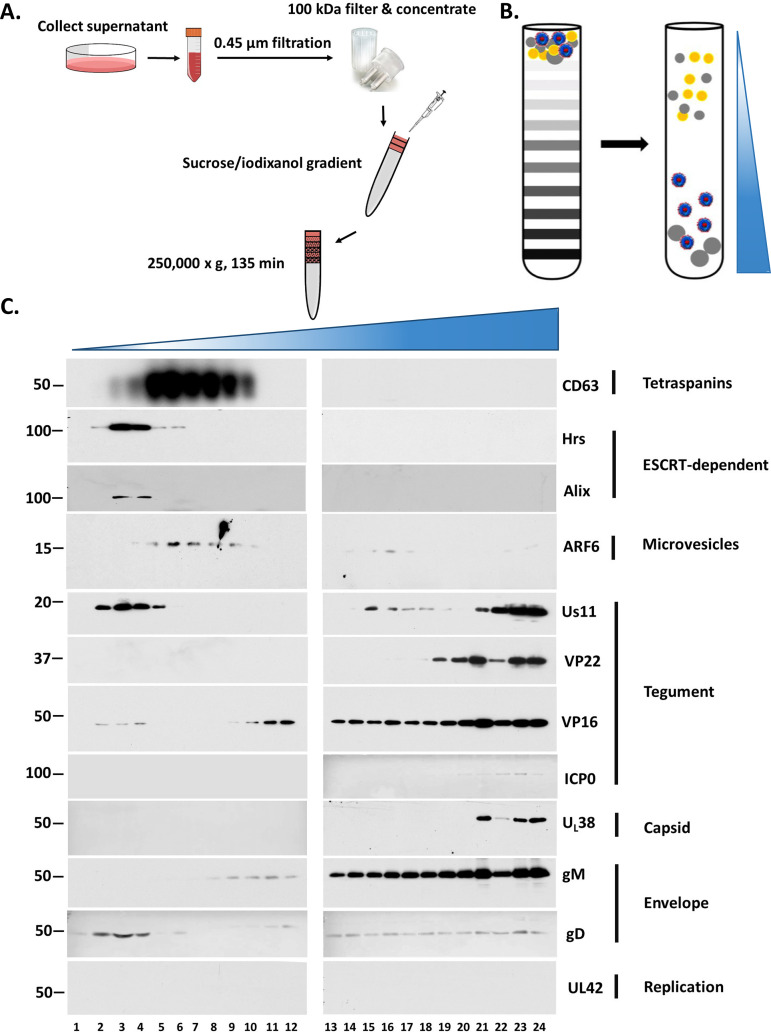
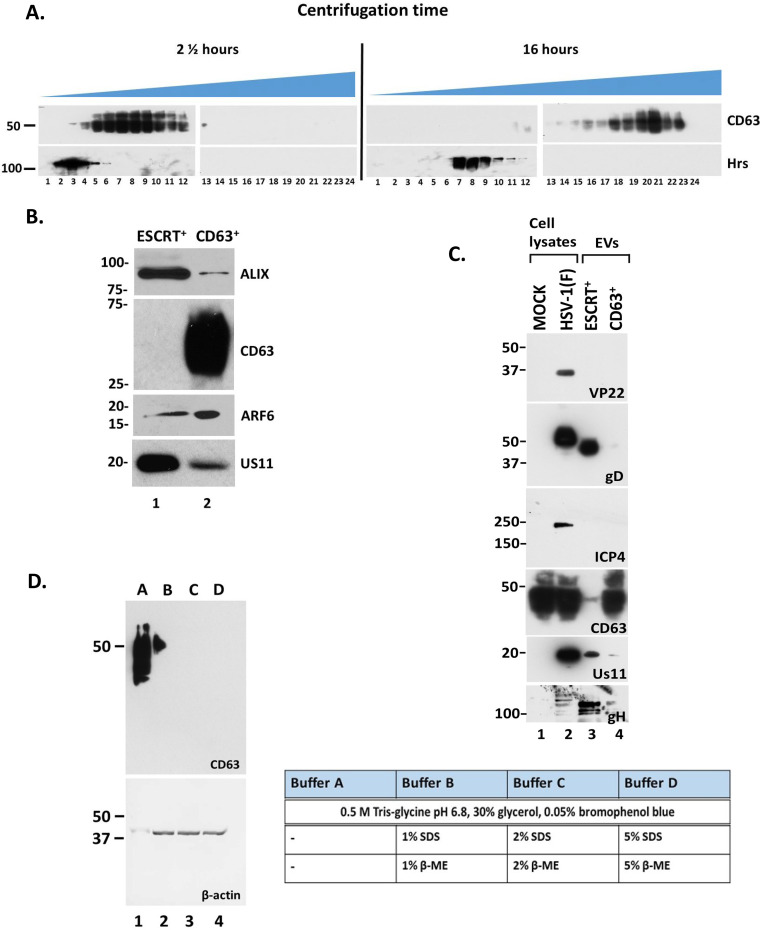
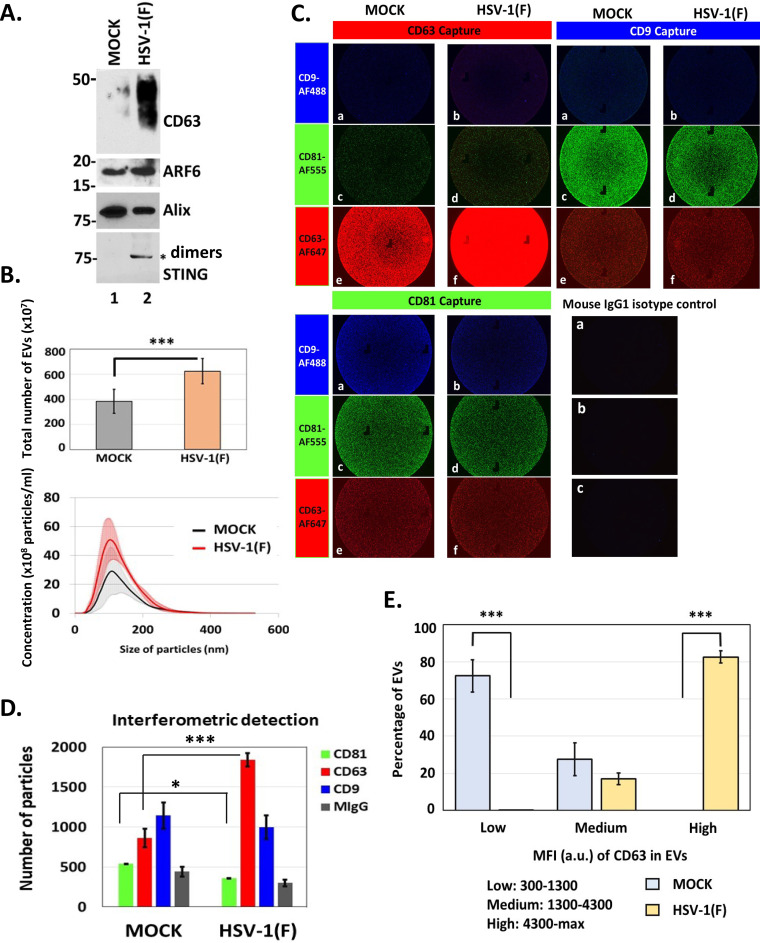
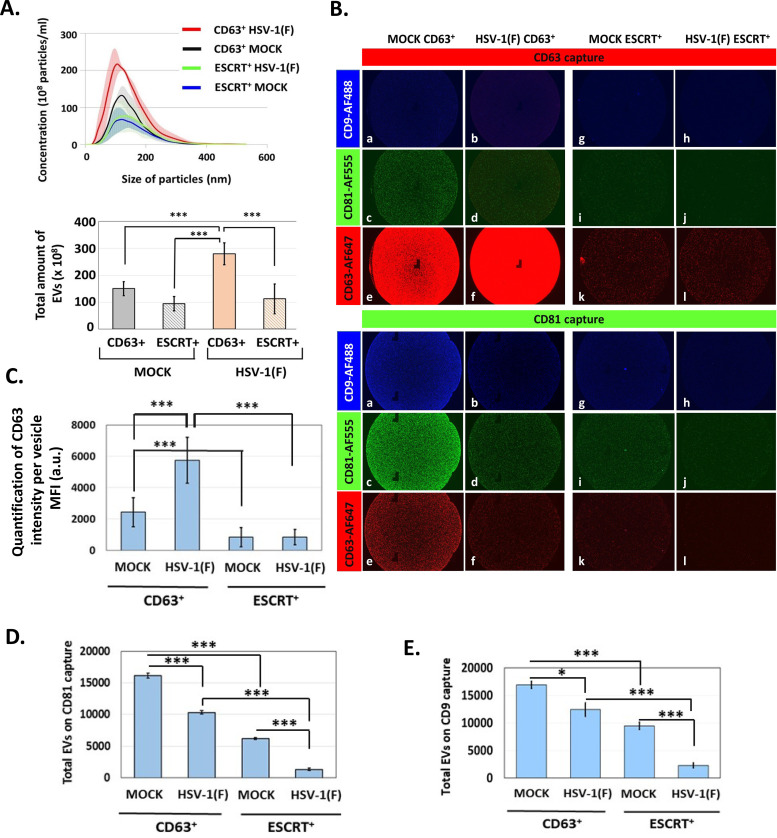
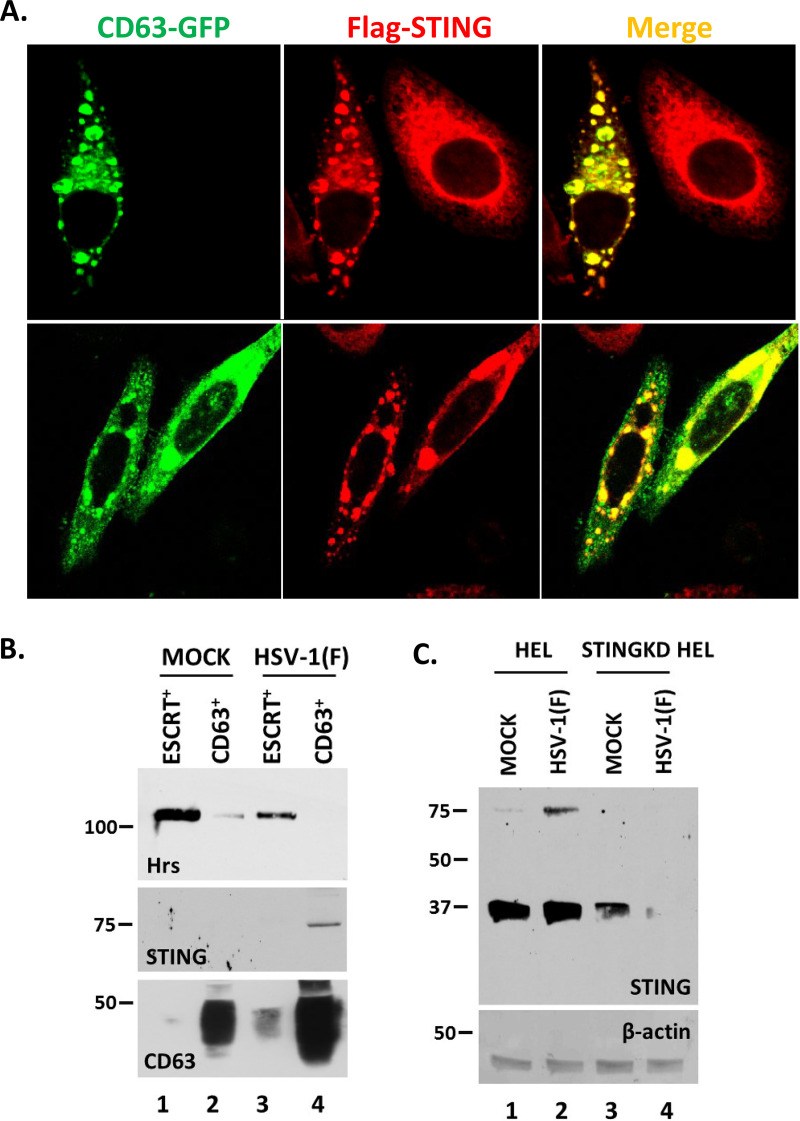
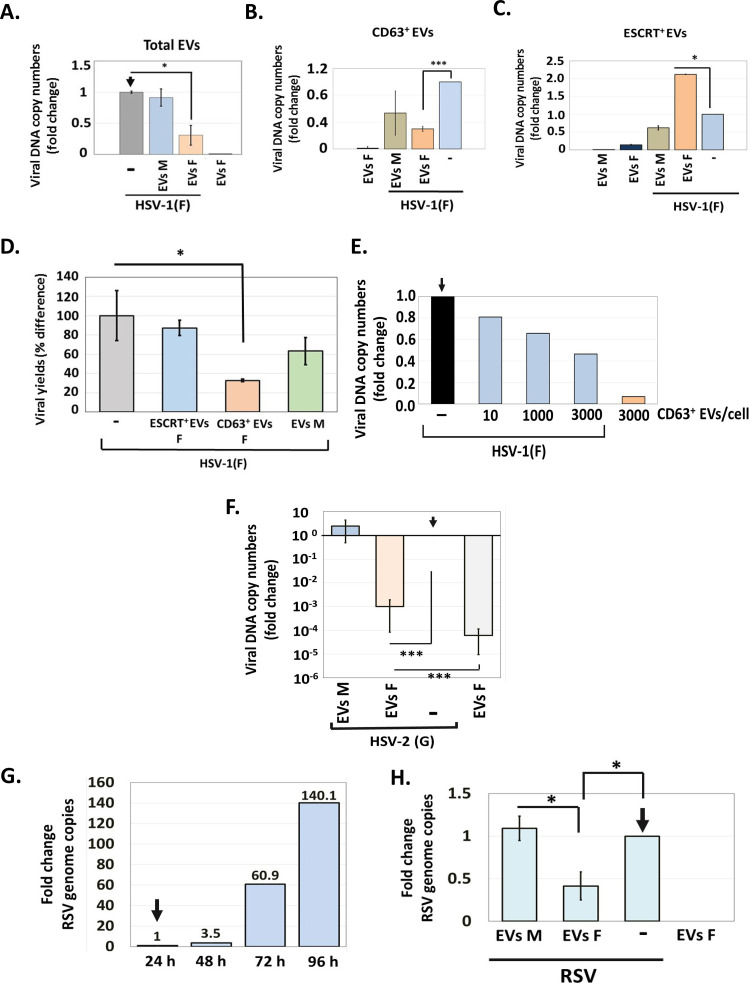
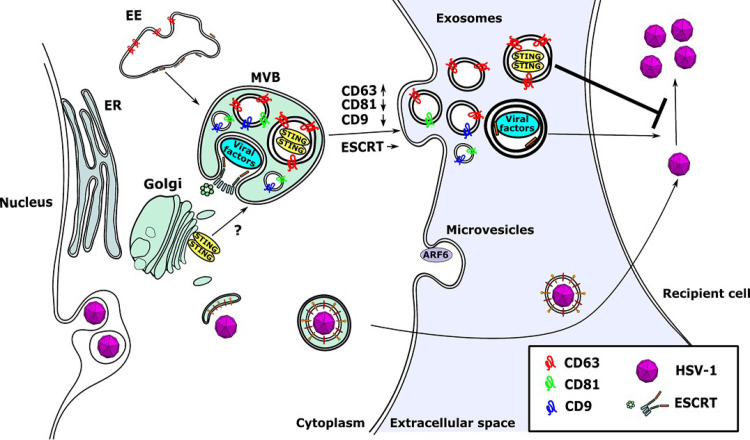
Extracellular vesicles (EVs) are released by all types of cells as a means of intercellular communication. Their significance lies in the fact that they can alter recipient cell functions, despite their limited capacity for cargo. We have previously demonstrated that herpes simplex virus 1 (HSV-1) infection influences the cargo and functions of EVs released by infected cells and that these EVs negatively impact a subsequent HSV-1 infection. In the present study, we have implemented cutting-edge technologies to further characterize EVs released during HSV-1 infection. We identified distinct EV populations that were separable through a gradient approach. One population was positive for the tetraspanin CD63 and was distinct from EVs carrying components of the endosomal sorting complexes required for transport (ESCRT). Nanoparticle tracking analysis (NTA) combined with protein analysis indicated that the production of CD63+ EVs was selectively induced upon HSV-1 infection. The ExoView platform supported these data and suggested that the amount of CD63 per vesicle is larger upon infection. This platform also identified EV populations positive for other tetraspanins, including CD81 and CD9, whose abundance decreased upon HSV-1 infection. The stimulator of interferon genes (STING) was found in CD63+ EVs released during HSV-1 infection, while viral components were found in ESCRT+ EVs. Functional characterization of these EVs demonstrated that they have opposite effects on the infection, but the dominant effect was negative. Overall, we have identified the dominant population of EVs, and other EV populations produced during HSV-1 infection, and we have provided information about potential roles.IMPORTANCE Extracellular vesicles mediate cell-to-cell communication and convey messages important for cell homeostasis. Pathways of EV biogenesis are often hijacked by pathogens to facilitate their dissemination and to establish a favorable microenvironment for the infection. We have previously shown that HSV-1 infection alters the cargo and functions of the released EVs, which negatively impact the infection. We have built upon our previous findings by developing procedures to separate EV populations from HSV-1-infected cells. We identified the major population of EVs released during infection, which carries the DNA sensor STING and has an antiviral effect. We also identified an EV population that carries selected viral proteins and has a proviral role. This is the first study to characterize EV populations during infection. These data indicate that the complex interactions between the virus and the host are extended to the extracellular environment and could impact HSV-1 dissemination and persistence in the host.

Keywords: CD63; CD81; ESCRT; HSV-1; L-particles; biogenesis of extracellular vesicles; extracellular vesicles; tetraspanins.


Figures

FIG 1
FIG 1
Separation of EVs from HSV-1 virions. (A and B) Schematic of the procedures used for EV isolation. HEL cells were infected with HSV-1(F) (0.1 PFU/cell). At 48 h postinfection, the supernatant was collected, centrifuged at 1,200 rpm for 5 min followed by a centrifugation at 3,500 rpm for 20 min, and filtered through a 0.45-μm filter. The supernatant was concentrated using Centricon Plus 70 (100-kDa cutoff) (Millipore). The sample was then loaded on top of an iodixanol/sucrose gradient ranging from 6 to 18%, with a 1.2% increment in the concentration of iodixanol for a total of 11 different concentrations. The 60% iodixanol was diluted in 10 mM Tris (pH 8) and 0.25 M sucrose. Samples were centrifuged in an SW41Ti rotor for 135 min at 250,000 × g and 4°C in a Beckman Coulter OPTIMA XPN-80 ultracentrifuge. Fractions of 500 μl were collected from the top to the bottom of the gradient. (C) Equal volumes from the fractions were separated in denaturing polyacrylamide gels and analyzed by immunoblot analysis using antibodies against EV components such as CD63, Hrs, Alix, and ARF6, viral tegument proteins such as Us11, VP22, VP16, and ICP0, viral capsid proteins such as UL38, viral envelope proteins such as glycoprotein M (gM) and gD, and a component of the viral replication machinery, UL42. Numbers on the left are molecular weight markers.
FIG 2
FIG 2
Separation of EV populations from HSV-1-infected cells. (A) Samples from HSV-1(F)-infected HEL cells prepared as for Fig. 1 were centrifuged either for 135 min or 16 h in an SW41Ti rotor in a Beckman Coulter OPTIMA XPN-80 ultracentrifuge. Fractions of 500 μl were collected from the top to the bottom of the gradient, and equal volumes were electrophoretically separated in denaturing polyacrylamide gels, transferred to nitrocellulose sheets, and analyzed by immunoblot analysis using antibodies against CD63 or Hrs. (B) HEp-2 cells were infected with HSV-1(F) (0.1 PFU/cell), the supernatant was processed as for Fig. 1, the fractions containing the ESCRT+ EVs and the CD63+ EVs were isolated separately, and equal numbers of EVs were analyzed by immunoblot analysis using antibodies against Alix, CD63, ARF6, or Us11. (C) The supernatant of HSV-1(F)-infected cells (0.1 PFU/cell) was collected at 48 h postinfection. CD63+ EVs were separated from the ESCRT+ EVs using procedures as for panel A, and the fractions of the gradient containing either CD63+ EVs or ESCRT+ EVs were pooled. Protein analysis was performed on equal amounts of EVs. Total lysates served as a control. Differences in the mobility of glycoproteins between virions and EVs are most likely due to sucrose present in EV samples. (D) HEL cells seeded in a 6-well plate were lysed using the triple detergent buffer (see Materials and Methods), and equal amounts of cell lysates were mixed with different loading buffers (A, B, C, and D), electrophoretically separated on a 12% SDS-polyacrylamide gel, and transferred to a nitrocellulose sheet, and immunoblot analysis was performed using an anti-CD63 antibody. β-Actin served as a loading control. β-ME, β-mercaptoethanol.
FIG 3
FIG 3
Increased production of EVs upon HSV-1 infection. (A) Total EVs were isolated from the supernatant of infected or uninfected HEL cells as for Fig. 1. The first seven fractions containing the EVs were pooled, washed with PBS, and quantified by NTA. Equal numbers of EVs were analyzed by immunoblot analysis using antibodies against CD63, ARF6, Alix, and STING. The STING dimers are prevalent in EVs released from HSV-1-infected cells. (B) EVs were isolated as for Fig. 1 and quantified using NTA. The quantity of the EVs and their size distribution are depicted. Results represent the averages from three independent EV isolations. The color-shaded regions are error bars that are used to show the variation in the concentration and size of EVs between different EV isolations. (C) Chips coated with separate capture spots for anti-CD63, anti-CD81, anti-CD9, or mouse isotype control IgG1 were placed in the center of separate wells in a 24-well plate. Diluted sample (40 μl) prepared as for Fig. 1 was applied to each chip. Sterile water was added to the void space between wells to form a humidity chamber, and the plate was sealed and allowed to incubate for 16 h at room temperature. Subsequently, wells containing chips were washed three times with buffer supplied by the manufacturer (NanoView Biosciences, USA). Anti-CD9-Alexa Fluor 488, anti-CD81-Alexa Fluor 555, or anti-CD63-Alexa Fluor 647 was applied to the chips for 1 h at room temperature. After washing, the chips were dried and imaged using an ExoView R100 reader on nScan2 2.7.6 software and analyzed using NanoViewer 2.8.9. (D) Interferometric detection of EVs from panel C, which were captured using different anti-tetraspanin antibodies, was performed using NanoViewer 2.8.9 supplied by the manufacturer (NanoView Biosciences). Total captured EVs on each chip were quantified. (E) Mean fluorescence intensity (MFI) of CD63 in single EVs from uninfected (mock) and infected (HSV-1) samples was quantified using NanoViewer 2.8.9 supplied by the manufacturer (NanoView Biosciences). MFI values were divided in 3 arbitrary groups; the percentage of EVs from mock or infected samples in each group is depicted. *, P ≤ 0.05; **, P ≤ 0.01; ***, P ≤ 0.001.
FIG 4
FIG 4
Increased production of CD63+ EVs during HSV-1 infection. A. EVs were isolated from the supernatant of infected or uninfected HEL cells as for Fig. 1, and the ESCRT+ EVs were collected separately from the CD63+ EVs. Quantification of the two EV populations derived from either infected or uninfected cells was done by NTA. The color-shaded regions are error bars that are used to show the variation in the concentration and size of EVs between different EV isolations. (B) Chips coated with separate capture spots for anti-CD63, anti-CD81, anti-CD9, or mouse isotype control IgG1 (shown in Fig. 3) were incubated with either ESCRT+ EVs or CD63+ EVs, as for Fig. 3. Anti-CD9-Alexa Fluor 488, anti-CD81-Alexa Fluor 555, or anti-CD63-Alexa Fluor 647 was applied to the chips for 1 h at room temperature. After washing, the chips were dried and imaged using an ExoView R100 reader on nScan2 2.7.6 software and analyzed using NanoViewer 2.8.9. (C) MFI of CD63 in single EVs from ESCRT+ and CD63+ fractions from mock or infected cells was quantified using NanoViewer 2.8.9 supplied by the manufacturer (NanoView Biosciences). (D and E) The number of EVs on each chip from panel C was quantified using NanoViewer 2.8.9. *, P ≤ 0.05; **, P ≤ 0.01; ***, P ≤ 0.001.
FIG 5
FIG 5
STING protein associates with the CD63+ EVs released from HSV-1-infected cells. (A) The Flag-STING-expressing HEp-2 cell line was transfected with a CD63-GFP-expressing plasmid. At 24 h posttransfection, the cells were infected with HSV-1(F) (10 PFU/cell). The cells were fixed using 4% paraformaldehyde at 10 h postinfection and stained with an anti-Flag antibody. Images were obtained using a Leica confocal microscope. (B) HEL cells either left uninfected or infected with HSV-1(F) (0.1 PFU/cell) were harvested at 48 h postinfection, and CD63+ EVs and ESCRT+ EVs were isolated as for Fig. 1 and 2. Equal numbers of EVs were analyzed in denaturing polyacrylamide gels, and immunoblot analysis was performed using antibodies against Hrs, STING, and CD63. (C) HEL or STING-KD HEL cells were either left uninfected or infected with HSV-1(F) (0.1 PFU/cell). The cells were harvested at 24 h postinfection, and equal amounts of proteins were analyzed by immunoblot analysis using a mouse monoclonal antibody against STING. β-Actin was used as a loading control.
FIG 6
FIG 6
Effect of EVs on HSV-1 infection. (A) EVs from infected or uninfected HEL cells present in the first seven fractions of the gradient described in the legend for Fig. 1 were quantified by NTA and used to expose uninfected HEL cells (1,000 EVs/cell). At 2 h post-EV exposure, the cells were infected with HSV-1(F) (0.01 PFU/cell). The cells were harvested at 24 h postinfection, and quantification of the viral genome was done by qPCR analysis as detailed in Materials and Methods. Cells exposed only to EVs or to virus served as controls. (B and C) CD63+ EVs (B) and ESCRT+ EVs (C) were isolated from infected and uninfected HEL cells at 24 h postinfection (0.01 PFU/cell), as for Fig. 1. Equal volumes of EVs were used to expose HEL cells for 2 h, followed by HSV-1 infection (0.01 PFU/cell). The cells were harvested at 48 h postinfection, and viral genome copy numbers were quantified as described above. Relative fold gene expression was calculated using the delta-delta threshold cycle (CT) method. (D) CD63+ and ESCRT+ EVs were isolated from infected and uninfected HEL cells at 24 h postinfection (0.01 PFU/cell), as for Fig. 2. Equal volumes of EVs were used to expose HEL cells for 2 h, followed by HSV-1 infection (0.01 PFU/cell). The cells were harvested at 48 h postinfection, and quantification of the infectious virus was done by plaque assay in Vero cells. (E) CD63+ EVs were isolated from HSV-1(F)-infected HEL cells as described above, and different doses were used to expose HEL cells for 2 h prior to HSV-1(F) infection (0.01 PFU/cell). The cells were harvested at 48 h postinfection, and viral genome copy numbers were quantified as described above. Exposure to CD63+ EVs from infected cells served as a contamination control. Fold change is relative to infected but non-EV-treated cells. (F) HEL cells were exposed to CD63+ EVs isolated from HSV-1(F)-infected or uninfected cells as for panel B, but infection was done with HSV-2(G) (0.01 PFU/cell). The cells were harvested at 48 h postinfection, and viral genome copy numbers were quantified as described above using primer pairs targeting the gG region of HSV-2 genome. (G) HEL cells were infected with RSV (0.01 PFU/cell). The cells were harvested every 24 h up to 96 h postinfection. Total RNA was extracted, reversed transcribed, and used to quantify the RSV genome. (H) HEL cells were infected with RSV (0.01 PFU/cell) for 48 h, followed by exposure to CD63+ EVs derived from HSV-1(F)-infected or uninfected cells as for panel B for another 48 h. The cells were harvested at 96 h postinfection, and viral genome copy numbers were quantified as detailed in Materials and Methods. All values are derived from triplicate samples. *, P ≤ 0.05; **, P ≤ 0.01; ***, P ≤ 0.001.
FIG 7
FIG 7
Model of EV exocytosis during HSV-1 infection. STING is sorted into CD63+ ILVs, whereas viral factors are sorted into ESCRT+ ILVs. The ILVs are released to the extracellular space after fusion of the MVBs to the plasma membrane and are referred to as exosomes. Production of CD63+ EVs is selectively enhanced during HSV-1 infection, but the quantity of ESCRT+ EVs remains unaltered. Also, the production of the microvesicles released from the plasma membrane is unaffected. CD81 is degraded during the late stages of HSV-1 infection and therefore is underrepresented in EVs. A small population of EVs carrying CD81 and CD9 appears to be distinct from the CD63+ EVs. The CD63+ EVs appear to have an antiviral role and suppress subsequent HSV-1 infection, but the ESCRT+ EVs seem to have an opposite effect.

Similar articles

Cited by

References

    1. Wolf P. 1967. The nature and significance of platelet products in human plasma. Br J Haematol 13:269–288. doi:10.1111/j.1365-2141.1967.tb08741.x. - DOI - PubMed
    1. Edelstein LC. 2017. The role of platelet microvesicles in intercellular communication. Platelets 28:222–227. doi:10.1080/09537104.2016.1257114. - DOI - PubMed
    1. Hargett LA, Bauer NN. 2013. On the origin of microparticles: from “platelet dust” to mediators of intercellular communication. Pulm Circ 3:329–340. doi:10.4103/2045-8932.114760. - DOI - PMC - PubMed
    1. van der Meijden PEJ, Heemskerk JWM. 2019. Platelet biology and functions: new concepts and clinical perspectives. Nat Rev Cardiol 16:166–179. doi:10.1038/s41569-018-0110-0. - DOI - PubMed
    1. Harding C, Heuser J, Stahl P. 1983. Receptor-mediated endocytosis of transferrin and recycling of the transferrin receptor in rat reticulocytes. J Cell Biol 97:329–339. doi:10.1083/jcb.97.2.329. - DOI - PMC - PubMed

Publication types

MeSH terms

LinkOut - more resources