. 2021 Feb 24;95(6):e02313-20.
doi: 10.1128/JVI.02313-20. Print 2021 Feb 24.

Phosphatidylinositol 3-Phosphate Mediates the Establishment of Infectious Bursal Disease Virus Replication Complexes in Association with Early Endosomes

Affiliations

Phosphatidylinositol 3-Phosphate Mediates the Establishment of Infectious Bursal Disease Virus Replication Complexes in Association with Early Endosomes

María Cecilia Gimenez et al. J Virol. .

Abstract

Infectious bursal disease virus (IBDV) is the archetypal member of the family Birnaviridae and the etiological agent of Gumboro disease, a highly contagious immunosuppressive infection of concern to the global poultry sector for its adverse health effects in chicks. Unlike most double-stranded RNA (dsRNA) viruses, which enclose their genomes within specialized cores throughout their viral replication cycle, birnaviruses organize their bisegmented dsRNA genome in ribonucleoprotein (RNP) structures. Recently, we demonstrated that IBDV exploits endosomal membranes for replication. The establishment of IBDV replication machinery on the cytosolic leaflet of endosomal compartments is mediated by the viral protein VP3 and its intrinsic ability to target endosomes. In this study, we identified the early endosomal phosphatidylinositol 3-phosphate [PtdIns(3)P] as a key host factor of VP3 association with endosomal membranes and consequent establishment of IBDV replication complexes in early endosomes. Indeed, our data reveal a crucial role for PtdIns(3)P in IBDV replication. Overall, our findings provide new insights into the replicative strategy of birnaviruses and strongly suggest that it resembles those of positive-strand RNA (+ssRNA) viruses, which replicate in association with host membranes. Furthermore, our findings support the role of birnaviruses as evolutionary intermediaries between +ssRNA and dsRNA viruses and, importantly, demonstrate a novel role for PtdIns(3)P in the replication of a dsRNA virus.IMPORTANCEInfectious bursal disease virus (IBDV) infects chicks and is the causative agent of Gumboro disease. During IBDV outbreaks in recent decades, the emergence of very virulent variants and the lack of effective prevention/treatment strategies to fight this disease have had devastating consequences for the poultry industry. IBDV belongs to the peculiar family Birnaviridae Unlike most dsRNA viruses, birnaviruses organize their genomes in ribonucleoprotein complexes and replicate in a core-independent manner. We recently demonstrated that IBDV exploits host cell endosomes as platforms for viral replication, a process that depends on the VP3 viral protein. In this study, we delved deeper into the molecular characterization of IBDV-endosome association and investigated the role of host cell phosphatidylinositide lipids in VP3 protein localization and IBDV infection. Together, our findings demonstrate that PtdIns(3)P serves as a scaffold for the association of VP3 to endosomes and reveal its essential role for IBDV replication.

Keywords: birnavirus; double-stranded RNA virus; endosomes; phosphoinositides; viral replication.


Figures

FIG 1
FIG 1
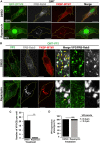
IBDV VP3 localizes on PtdIns(3)P-enriched compartments. (A and B) Subcellular distribution of PIs biosensors and VP3 viral protein. QM7 or QM7-VP3 cells were transfected with several PIs biosensors (green): GFP-PLCδ-PH, which binds to PtdIns(4,5)P2 (47); PH-Akt-GFP, which binds both PtdIns(3,4,5)P3 and PtdIns(3,4)P2 (91); GFP-2FYVE and GFP-p40-PX biosensors, which bind to PtdIns(3)P (54, 55); EGFP-cPHx3, which binds to PtdIns(3,4)P2 (53), and the probe for PtdIns(4)P, GFP-2xP4M (49–52). After 12 h, cells were fixed, permeabilized, stained with antibodies against VP3 (red), and analyzed by spinning-disc confocal microscopy. Main panels and insets show representative images of merged z-stacks. The images are representative of three independent experiments. Bars, 10 μm. Arrows (B) indicate VP3-PtdIns(3)P-positive compartments, and 3D renderings of those compartments are shown on the right. (C) Quantitative analysis of VP3-PI association. QM7-VP3 cells were treated as below in panels A and B, and the percent association between VP3 and PIs was calculated after analysis of cell images with Volocity software. Data are the percentage of VP3 puncta associated with PtdIns(3)P or PtdIns(4)P biosensor-derived signals, calculated as described in Materials and Methods. Data are means and SD. ***, P < 0.01.
FIG 2
FIG 2
IBDV replication complexes localize on PtdIns(3)P-enriched compartments. (A and B) Subcellular distribution of VP3 protein and PtdIns(3)P biosensors. QM7 cells were transiently transfected with GFP-2FYVE or GFP-p40-PX constructs for 12 h and either infected with IBDV at an MOI of 1 PFU/cell or incubated with virus-free culture medium (mock condition). After 1 h of adsorption at 37°C, cells were infected for 24 h and processed for IIF against VP3 protein as described in Materials and Methods. Arrows indicate IBDV replication complexes on PtdIns(3)P-positive compartments. The z-stack images are representative of three independent experiments. Bars, 10 μm. Numbers show the percentages of VP3 puncta associated with PtdIns(3)P biosensor-derived signals, determined with Volocity software and calculated as described in Materials and Methods. Data are means and SD.
FIG 3
FIG 3
VP3 displays a discontinuous distribution along the membrane of PtdIns(3)P-enriched compartments. (A) Spinning-disc confocal microscopy analysis of VP3 protein distribution phenotype along the membrane of enlarged Rab5Q79L/PtdIns(3)P compartments. QM7-VP3 cells were cotransfected with RFP-2FYVE and EGFP-Rab5-Q79L for 12 h, and the cells were fixed, permeabilized, and stained with antibodies against VP3 (white) prior to analysis by spinning-disc confocal microscopy. (Left) Merged image showing a single confocal plane. (Middle) Magnified single plane from the framed region showing a giant endosome positive for VP3-, RFP-2FYVE-, and EGFP-Rab5-Q79L-derived signals. (Right) Single channels and surface intensity plots corresponding to the endosome in the middle. The images are representative of three independent experiments. Bars, 10 μm. (B) Improved-resolution analysis of VP3 distribution in enlarged EEs. QM7-VP3 cells where transfected with EGFP-Rab5-Q79L and processed as described for panel A, and the cells were analyzed using enhanced resolution imaging, acquired with a Hyvolution microscopy system as described in Materials and Methods. (Top left) Merged image showing a single confocal plane; (top right) Merged image of a magnified single plane from the framed region on the left showing enlarged endosomes positive for VP3- and EGFP-Rab5-Q79L-derived signals. (Bottom) Single planes of the framed region above. Bars, 10 μm. The images are representative of three independent experiments.
FIG 4
FIG 4
The chemical depletion of PtdIns(3)P prevents VP3 localization on EEs. (A) Analysis of the subcellular distribution of GFP-2FYVE in avian cells treated with PI3K inhibitors. QM7 cells were transfected with GFP-2FYVE for 12 h and then treated with DMSO (control vehicle), 100 μM LY294002, or 1 μM Vps34-IN1 for 2 h. Subsequently, cells were fixed and visualized by spinning-disc confocal microscopy. Main panels show representative images of merged z-stacks. Framed regions show amplified images that depict the intracellular localization of GFP-2FYVE under the different conditions. The images are representative of three independent experiments. Bars, 10 μm. The percentages were calculated from 100 cells per condition. (B) Analysis of GFP-2FYVE and VP3 protein subcellular distributions in avian cells treated with PI3K inhibitors. QM7-VP3 cells were transfected with GFP-2FYVE and for 12 h and treated as described for panel A. Subsequently, cells were fixed, permeabilized, stained using antibodies against VP3 (red), and analyzed using spinning-disc confocal microscopy. Main panels show representative images of merged single confocal planes. The smaller boxes are amplified images that depict the intracellular localization of GFP-2FYVE and VP3. Bars, 10 μm. VP3 expression phenotypes (punctate or cytoplasmic) were determined for QM7-VP3 cells with Volocity as described in Materials and Methods. Fifty cells per condition were scored for each experiment. The images are representative of three independent experiments. Data are means and SD. ***, P < 0.01.
FIG 5
FIG 5
The localized depletion in endosomal PtdIns(3)P prevents VP3 localization on EEs. (A) Analysis of GFP-2FYVE subcellular distribution in QM7 cells after rapamycin-induced localized depletion of PtdIns(3)P in EEs. QM7 cells were transiently cotransfected with mCherry-FKBP-MTM1, iRFP-FRB-Rab5, and GFP-2FYVE for 12 h and subsequently treated for 15 min with DMSO or 1 μM rapamycin to induce the recruitment of FKBP-MTM1 to the FRB-Rab5-decorated membranes to trigger PtdIns(3)P dephosphorylation in EEs. Cells were fixed and visualized by spinning-disc confocal microscopy. Main panels show representative images of merged z-stacks. Framed regions show amplified images that depict the intracellular localization of GFP-2FYVE. The images are representative of three independent experiments. Bars, 10 μm. Percentages were calculated by analyzing 50 cells per condition. (B to D) Analysis of VP3 distribution in cells locally depleted of PtdIns(3)P. QM7-VP3 cells were transiently cotransfected with mCherry-FKBP-MTM1 and iRFP-FRB-Rab5 for 12 h and subsequently treated for 15 min with DMSO or 1 μM rapamycin. The cells were fixed, permeabilized, VP3 (green) stained as described in Materials and Methods, and analyzed by spinning-disc confocal microscopy. (B) Representative images of merged z-stacks. The images are representative of three independent experiments. Bars, 10 μm (left panels) or 0.5 μm (right panels). (C) The number of VP3-Rab5-positive EEs per cell were calculated as described in Materials and Methods. The images are representative of three independent experiments. Data are means and SD. **, P < 0.05. (D) VP3 expression phenotypes were determined employing Volocity software as described in Materials and Methods. Twenty-five cells per condition were scored for each experiment. Data are means and SD. ***, P < 0.01.
FIG 6
FIG 6
IBDV replication complexes detach from EEs after rapamycin-induced localized depletion of PtdIns(3)P. (A) Subcellular distribution of IBDV RNPs in infected QM7 cells after the localized depletion of PtdIns(3)P from EEs. QM7 cells were transiently cotransfected with mCherry-FKBP-MTM1 and iRFP-FRB-Rab5 for 12 h and subsequently infected with IBDV at an MOI of 1 PFU/cell or incubated with virus-free culture medium. After 1 h of adsorption at 37°C, the cells were infected for 24 h. Before the end of the infection period, the cells were treated for 30 min with DMSO or 1 μM rapamycin to induce the recruitment of FKBP-MTM1 to the FRB-Rab5-decorated membranes in order to trigger the dephosphorylation of PtdIns(3)P in EEs. The cells were fixed and permeabilized, and IBDV replication complexes were stained with antibodies against VP3 (red) as described in Materials and Methods. Cells were analyzed by spinning-disc confocal microscopy. Representative images of merged z-stacks are shown. The images are representative of three independent experiments. Bars, 10 μm. (B) VP3 expression phenotypes were determined with Volocity software as described in Materials and Methods. Twenty-five cells per condition were scored for each experiment. The images are representative of three independent experiments. Data are means and SD. ***, P < 0.01.
FIG 7
FIG 7
The rapamycin-induced recruitment of MTM1 to Rab7-positive compartments does not prevent VP3-EE association. (A) Analysis of GFP-2FYVE subcellular distribution in QM7 cells after rapamycin-induced recruitment of MTM1 to late endosomes. QM7 cells were transiently cotransfected with mCherry-FKBP-MTM1, iRFP-FRB-Rab7, and GFP-2FYVE for 12 h and subsequently treated for 15 min with DMSO or 1 μM rapamycin, to induce the recruitment of FKBP-MTM1 to the FRB-Rab7-decorated membranes. Cells were fixed and visualized by spinning-disc confocal microscopy. Main panels show representative images of merged z-stacks. Insets show amplified images that depict the intracellular localization of GFP-2FYVE. The images are representative of three independent experiments. Bars, 10 μm. Percentages were calculated by analyzing 50 cells per condition. (B and C) Analysis of VP3 subcellular distribution after recruitment of MTM1 to late endosomes. (B) QM7-VP3 cells were transiently cotransfected with mCherry-FKBP-MTM1 and iRFP-FRB-Rab7 for 12 h and subsequently treated for 15 min with DMSO or 1 μM rapamycin. The cells were fixed, permeabilized, VP3 (green) stained as described in Materials and Methods, and analyzed by spinning-disc confocal microscopy. Representative images of merged z-stacks are shown. The images are representative of three independent experiments. Bars, 10 μm. (C) VP3 expression phenotypes (punctate or cytoplasmic) were determined employing Volocity software and following the criteria described in Materials and Methods. Twenty-five cells per condition were scored for each experiment. The images are representative of three independent experiments. Data are means and SD. ***, P < 0.01.
FIG 8
FIG 8
The constitutive active mutant of Rab5 does not prevent VP3 dissociation from PtdIns(3)P-depleted endosomes. (A) Analysis of GFP-2FYVE subcellular distribution in avian cells overexpressing the constitutive active mutant of Rab5 and treated with PI3K inhibitors. QM7 cells were cotransfected with EGFP-Rab5-Q79L and RFP-2FYVE for 12 h and then treated with DMSO, 100 μM LY294002, or 1 μM Vps34-IN1 for 2 h. Subsequently, cells were fixed and analyzed by spinning-disc confocal microscopy. Main panels show representative images of merged single confocal planes. Insets show amplified images that depict the intracellular localization of EGFP-Rab5-Q79L and RFP-2FYVE. The images are representative of three independent experiments. Bars, 10 μm. The percentages depicted in main panels were calculated from 100 cotransfected cells per condition. (B) Analysis of RFP-2FYVE and VP3 protein subcellular distribution in avian cells expressing the constitutive active mutant of Rab5 and treated with PI3K inhibitors. QM7-VP3 cells were cotransfected with EGFP-Rab5-Q79L and RFP-2FYVE for 12 h, treated, processed, and analyzed as for panel A. The larger panels show representative images of merged single confocal planes. The smaller panels depict the subcellular distribution of VP3, RFP-2FYVE, and EGFP-Rab5-Q79L. The images are representative of three independent experiments. Bars, 10 μm. The percentages of cells positive for EGFP-Rab5-Q79L and VP3 vesicles were analyzed with Volocity software, and results are presented in the graph. Fifty cells per condition were scored for each experiment. The images are representative of three independent experiments. Data are means and SD. ***, P < 0.01.
FIG 9
FIG 9
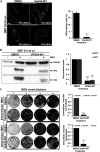
The chemical depletion of PtdIns(3)P in avian cells inhibits IBDV replication and reduces its infectivity. (A) Treatment of infected avian cells with Vps34-IN1 impairs IBDV infection. QM7 cells were either mock infected or infected with IBDV at an MOI of 1 PFU/cell and at 2 h p.i. were treated with DMSO or 1 μM Vps34-IN1. At 24 h p.i., cells were fixed, permeabilized, stained with antibodies against VP3 (white) and analyzed by spinning-disc confocal microscopy. Panels a to d show representative images of infected cells. Images are merged z-stacks. The images are representative of three independent experiments. Bars, 10 μm. The percentages of IBDV-infected cells were calculated by scoring 100 cells per condition, and the results are presented in the graph. Data are means and SD. **, P < 0.05. (B) Intracellular accumulation of VP2 and VP3 proteins in QM7 cells depleted of PtdIns(3)P. QM7 cells were either mock infected or infected and treated as for panel A and at 24 h p.i. were processed by Western blotting using the corresponding anti-VP2 and VP3 antibodies described in Materials and Methods. The Western blots and the data shown in the normalized bar graph correspond to an experiment representing three independent trials. Data are means and SD. ***, P < 0.01. (C) QM7 cells were either mock infected or infected and treated as for panel A. At 24 h p.i., the supernatants were collected for extracellular virus titration, and the cellular pellets were processed for intracellular viral titration as described in Materials and Methods. The image shows a representative plaque assay results from three independent trials. Normalized extra- and intracellular viral titers are shown in the graphs. The crude viral titers are shown above the bars. Error bars show SD. ***, P < 0.01; **, P < 0.05.
FIG 10
FIG 10
siRNA-mediated depletion of Vps34 inhibits IBDV replication and decreases its infectivity. (A) Evaluation of macropinocytosis of Vps34 knockdown cells. HeLa cells were transfected with control siRNA or a Vps34 siRNA duplex for 72 h and then incubated with the fluid-phase reagent 70-kDa dextran-tetramethylrhodamine, as described in Materials and Methods. Cells were fixed and analyzed by spinning-disc confocal microscopy. Images are merged z-stacks and representative of three independent trials. Bars, 10 μm. The corrected total cell fluorescence (CTCF) was determined with ImageJ software, as described in Materials and Methods. Data are means and SD. ns, not significant. (B) Intracellular accumulation of VP3 protein in Vps34 knockdown cells infected with IBDV. HeLa cells were transfected with control siRNA or a Vps34 siRNA duplex for 24 h and either mock infected or infected with IBDV at an MOI of 1 PFU/cell. After 1 h of adsorption at 37°C, cells were infected for 48 h. At 72 h, they were processed by Western blotting with anti-VP3 and anti-Vps34 antibodies as described in Materials and Methods. The Western blots and the data shown in the normalized bar graph correspond to an experiment representing three independent trials. Data are means and SD. **, P < 0.05; ***, P < 0.01. (C) HeLa cells were transfected and infected as described above, and at 72 h, the cell supernatants were collected for extracellular virus titration, as described in Materials and Methods. The image shows representative plaque assays from three independent trials. Normalized extracellular viral titers are shown in the graph. The crude viral titers are shown above the bars. Error bars show SD. ***, P < 0.01.

Similar articles

Cited by

References

    1. Cosgrove AS. 1962. An apparently new disease of chickens: avian nephrosis. Avian Dis 6:385–389. doi:10.2307/1587909. - DOI
    1. Müller H, Islam MR, Raue R. 2003. Research on infectious bursal disease–the past, the present and the future. Vet Microbiol 97:153–165. doi:10.1016/j.vetmic.2003.08.005. - DOI - PubMed
    1. Delmas B, Attoui H, Ghosh S, Malik YS, Mundt E, Vakharia VN, Ictv Report Consortium. 2019. ICTV virus taxonomy profile: Birnaviridae. J Gen Virol 100:5–6. doi:10.1099/jgv.0.001185. - DOI - PubMed
    1. Mertens P. 2004. The dsRNA viruses. Virus Res 101:3–13. doi:10.1016/j.virusres.2003.12.002. - DOI - PubMed
    1. Luque D, Mata CP, González-Camacho F, González JM, Gómez-Blanco J, Alfonso C, Rivas G, Havens WM, Kanematsu S, Suzuki N, Ghabrial SA, Trus BL, Castón JR. 2016. Heterodimers as the structural unit of the T=1 capsid of the fungal double-stranded RNA Rosellinia necatrix quadrivirus 1. J Virol 90:11220–11230. doi:10.1128/JVI.01013-16. - DOI - PMC - PubMed

Publication types

MeSH terms

Substances

LinkOut - more resources