. 2021 Jan;589(7843):591-596.
doi: 10.1038/s41586-020-03057-y. Epub 2020 Dec 23.

Nociceptive nerves regulate haematopoietic stem cell mobilization

Affiliations

Nociceptive nerves regulate haematopoietic stem cell mobilization

Xin Gao et al. Nature. 2021 Jan.

Abstract

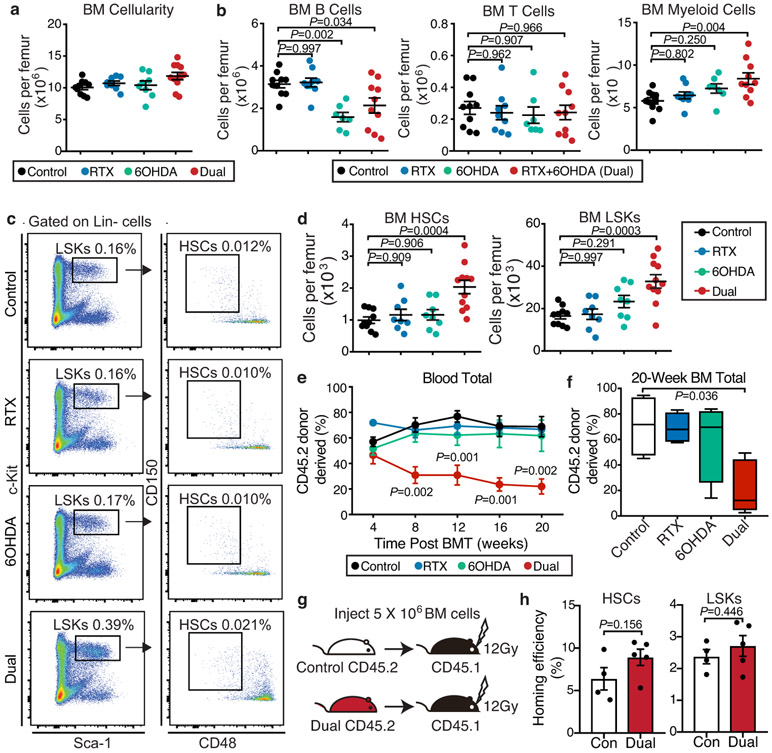
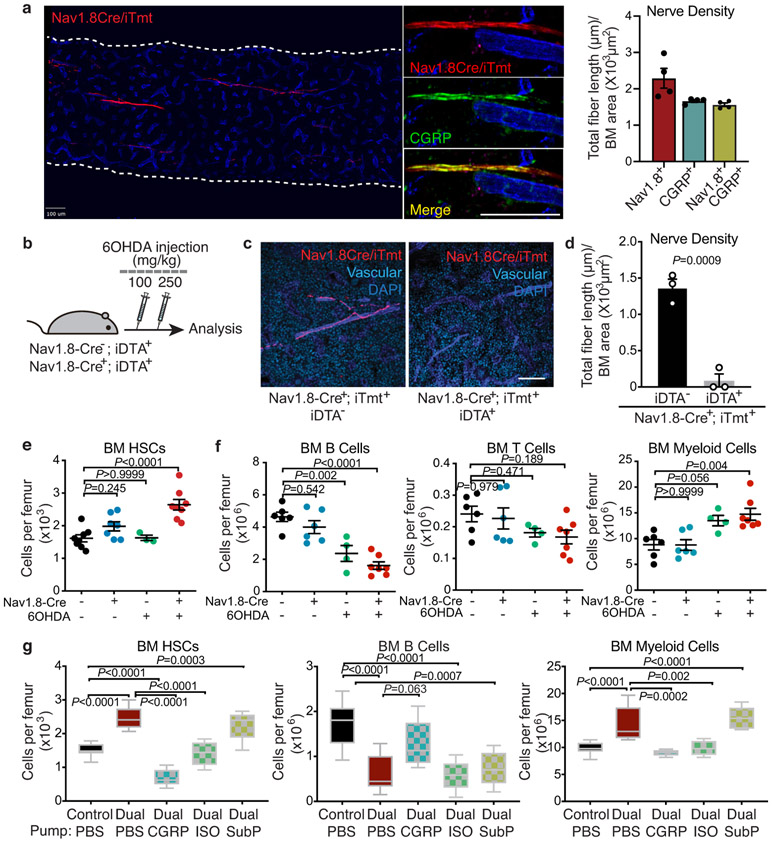
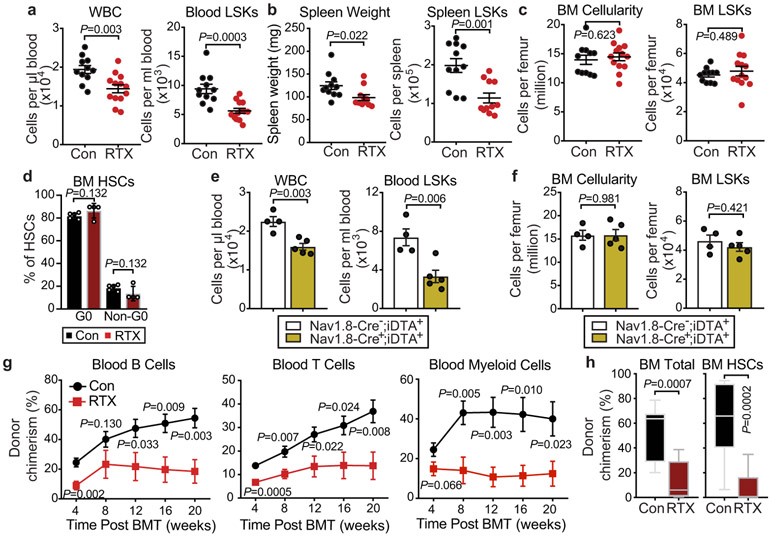
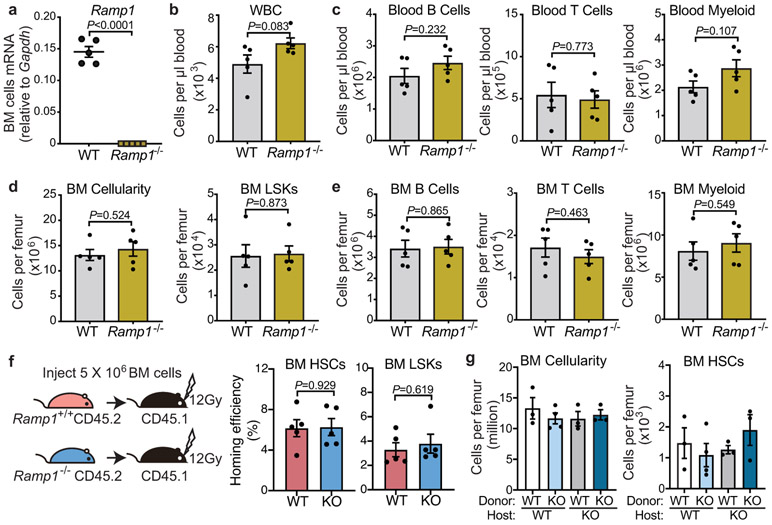
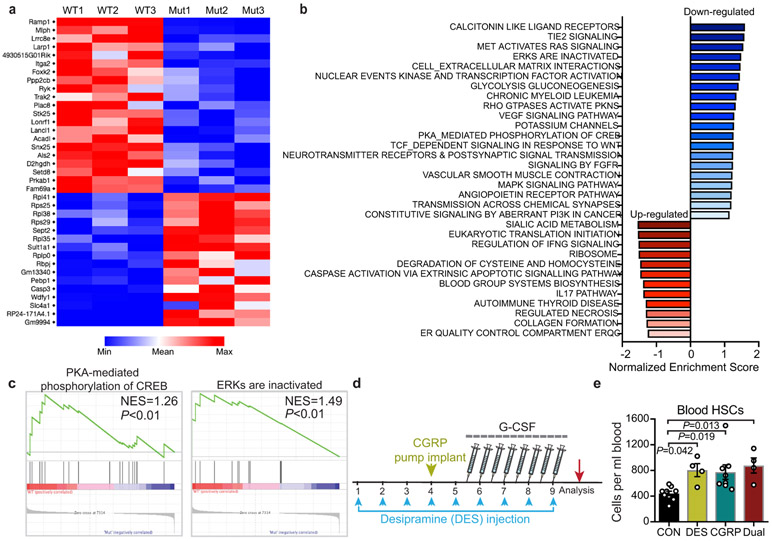
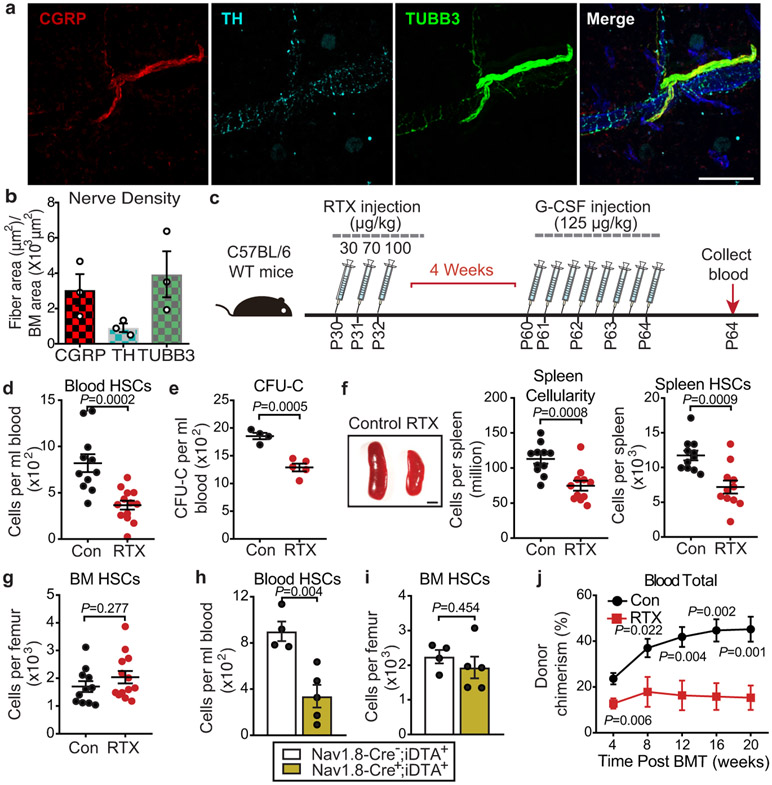
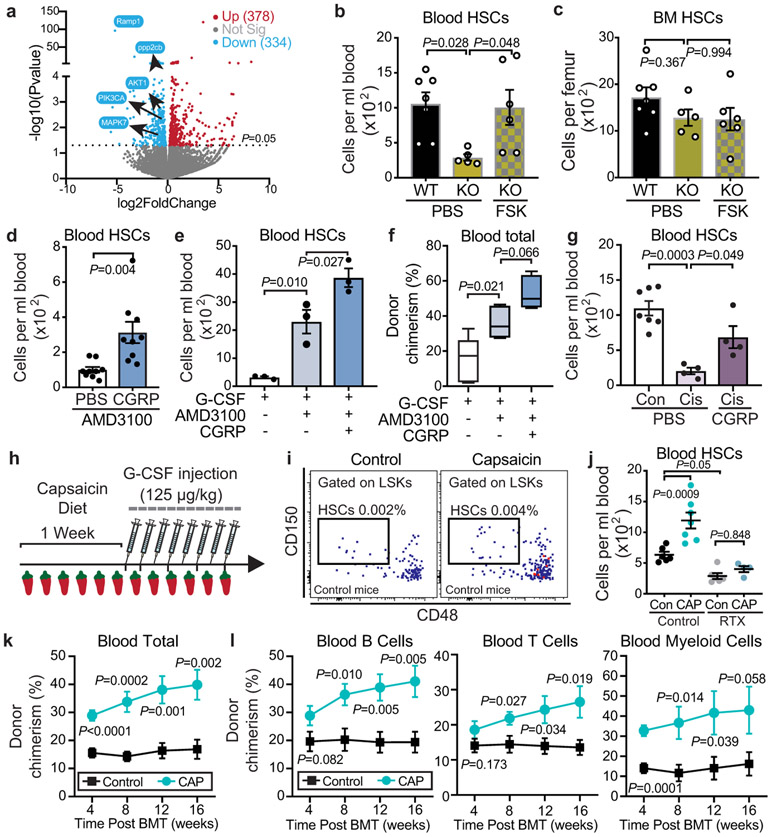
Haematopoietic stem cells (HSCs) reside in specialized microenvironments in the bone marrow-often referred to as 'niches'-that represent complex regulatory milieux influenced by multiple cellular constituents, including nerves1,2. Although sympathetic nerves are known to regulate the HSC niche3-6, the contribution of nociceptive neurons in the bone marrow remains unclear. Here we show that nociceptive nerves are required for enforced HSC mobilization and that they collaborate with sympathetic nerves to maintain HSCs in the bone marrow. Nociceptor neurons drive granulocyte colony-stimulating factor (G-CSF)-induced HSC mobilization via the secretion of calcitonin gene-related peptide (CGRP). Unlike sympathetic nerves, which regulate HSCs indirectly via the niche3,4,6, CGRP acts directly on HSCs via receptor activity modifying protein 1 (RAMP1) and the calcitonin receptor-like receptor (CALCRL) to promote egress by activating the Gαs/adenylyl cyclase/cAMP pathway. The ingestion of food containing capsaicin-a natural component of chili peppers that can trigger the activation of nociceptive neurons-significantly enhanced HSC mobilization in mice. Targeting the nociceptive nervous system could therefore represent a strategy to improve the yield of HSCs for stem cell-based therapeutic agents.


Figures

Extended Data Fig. 1.
Extended Data Fig. 1.. Characterization of nociceptive and sympathetic innervation in the bone marrow.
a, b, Representative confocal z-stack projection montages of C57BL/6 mouse femur stained for CGRP (nociceptive nerves), TH (sympathetic nerves), and TUBB3 (all peripheral nerves), CD31+ CD144+ double-positive vasculature. Scale bar, 100 μm. Femoral sensory and sympathetic innervation quantified by the total length of all CGRP+, TH+, or TUBB+ nerve fibres divided by the bone marrow area. n=3 mice. c, Schematic illustration of the pharmacological denervation experiment using RTX and 6OHDA. d, e, Representative images of confocal z-stack projections from femurs of control-, RTX-, 6OHDA-, dual-denervated mice stained for CGRP+ nociceptive nerve fibres, TH+ sympathetic nerve fibres, CD31+CD144+ blood vessels and DAPI. Scale bar, 100 μm. Femoral sensory and sympathetic innervation quantified by the total length of CGRP+ or TH+ nerves divided by total bone marrow area. Data from n=4, 5, 4, 4 mice, respectively. Error bars represent s.e.m. one-way ANOVA.
Extended Data Fig. 2.
Extended Data Fig. 2.. Nociceptive or sympathetic nerves are dispensable for HSC maintenance, whereas the depletion of both systems expands poorly functional HSCs.
a, b, BM cellularity and absolute numbers of B cells (B220+), T cells (CD3e+) and myeloid cells (Mac-1+) per femur from control, RTX, 6OHDA, or dual-denervated mice. n=10, 8, 8, 11 (a) and 10, 9, 7, 10 (b) mice, respectively. c, Representative FACS plots showing the gating strategy for Lin Sca-1+ c-Kit+ CD150+ CD48 HSCs. The same gating strategy was used throughout. d, Absolute number of HSCs and LSK cells (Lin Sca-1+ c-Kit+) per femur from control, RTX, 6OHDA, or dual-denervated mice. n=10, 8, 8, 11 mice, respectively. e, Peripheral blood chimerism (CD45.2+) in CD45.1-recipient mice transplanted with 0.5 x 10⁶ CD45.1 competitor BM cells mixed with 0.5 x 10⁶ donor BM cells (CD45.2) from control, RTX, 6OHDA, or dual-denervated mice at the indicated time points post-transplantation. n=4, 4, 4, 5 mice, respectively. f, Bone marrow chimerism (CD45.2+) 20 weeks after transplantation. g. Experimental design to determine the homing efficiency of HSCs and LSK cells (CD45.2) from control- or dual-denervated mice to the bone marrow of recipients (CD45.1). h, Homing efficiency of donor CD45.2 HSCs and LSK cells detected in the recipient bone marrow. n=4,5 mice, respectively. Error bars represent s.e.m. Two-tailed unpaired Student’s t test (h) or one-way ANOVA (a, b, d-f). For box plots, the box spans from the 25th to 75th percentiles and the centerline was plotted at the median. Whiskers represent minimum to maximum range.
Extended Data Fig. 3.
Extended Data Fig. 3.. Expansion of phenotypic HSCs following dual sympathetic and nociceptive denervation is normalized by administration of CGRP or a β-adrenergic agonist.
a, Representative confocal z-stack projections from femurs of Nav1.8-Cre+, iTdTomato+ mice stained for CD31+ CD144+ vasculature and CGRP+ nociceptive nerves. Nociceptive innervation quantified by the total length of all Nav1.8+ (red), CGRP+ (green), and Nav1.8+ CGRP+ double positive (yellow) nerves divided by the bone marrow area. n=4 mice. b, Schematic illustration of the dual denervation experiment with Nav1.8-Cre; iDTA mice. c, d, Representative images of confocal z-stack projections from femurs of Nav1.8-Cre+; iTdTomato+; iDTA or Nav1.8-Cre+; iTdTomato+; iDTA+ mice stained for blood vessels (blue). Quantification of TdTomato+ nociceptive nerves in the femurs. n=3 mice per group. e, f, Absolute numbers of HSCs (Lin Sca-1+ c-Kit+ CD150+ CD48), B cells (B220+), T cells (CD3e+) and myeloid cells (Mac-1+) per femur from Nav1.8-Cre; iDTA+ or Nav1.8-Cre+; iDTA+ mice with or without 6OHDA treatment. Each dot represents data from individual mice. n=8, 7, 3, 8 (e) and 6, 6, 4, 7 (f) mice, respectively. g, BM cellularity and absolute numbers of HSCs, B cells and myeloid cells per femur from control and dual-denervated mice implanted with osmotic pumps containing saline as control, CGRP, isoproterenol or substance P. n=14, 9, 5, 5, 5 mice respectively. Error bars represent s.e.m. Two-tailed unpaired Student’s t test (d) or one-way ANOVA (e-g). For box plots, the box spans from the 25th to 75th percentiles and the centerline was plotted at the median. Whiskers represent minimum to maximum range.
Extended Data Fig. 4.
Extended Data Fig. 4.. G-CSF-induced HSPC mobilization is impaired in mice lacking nociceptor neurons.
a, White blood cell counts and absolute numbers of LSK (Lin Sca-1+ c-Kit+) cells per mL of peripheral blood following G-CSF mobilization in vehicle-treated control and RTX-treated mice. n=11, 13 mice, respectively. b, Spleen weight and the absolute numbers of LSK cells in the spleen following G-CSF mobilization in vehicle-treated control and RTX-treated mice n=11 mice per group. c, Bone marrow cellularity and the absolute numbers of LSK cells in the bone marrow following G-CSF-induced mobilization in vehicle-treated control and RTX-treated mice. n=11, 13 mice, respectively. d, Cell cycle analysis of BM HSCs (Lin Sca-1+ c-Kit+ CD150+ CD48) from control or RTX-treated animals determined by FACS using anti-Ki67 and Hoechst 33342 staining. n=6, 4 mice, respectively. e, White blood cell counts and absolute numbers of LSK cells per mL of peripheral blood following G-CSF-induced mobilization in Nav1.8-Cre; iDTA+ and Nav1.8-Cre+; iDTA+. n=4, 5 mice, respectively. f, Bone marrow cellularity and the absolute numbers of LSK cells in the bone marrow following G-CSF-induced mobilization in Nav1.8-Cre; iDTA+ and Nav1.8-Cre+; iDTA+. n=4, 5 mice, respectively. g, Peripheral blood B-cell (B220+CD45.2+), blood T-cell (CD3e+CD45.2+), and myeloid-cell (Mac-1+CD45.2+) donor chimerism in CD45.1-recipient mice transplanted with mobilized blood (CD45.2) derived from saline or RTX-treated mice mixed with CD45.1 competitor BM cells at the indicated time points post-transplantation. n=9,8 mice, respectively. h, Total bone marrow chimerism (CD45.2+) and bone marrow HSC chimerism (Lin Sca-1+ c-Kit+ CD150+ CD48 CD45.2+) 20 weeks after transplantation. n=9, 8 mice, respectively. Error bars represent s.e.m. Two-tailed unpaired Student’s t test. For box plots, the box spans from the 25th to 75th percentiles and the centerline was plotted at the median. Whiskers represent minimum to maximum range.
Extended Data Fig. 5.
Extended Data Fig. 5.. The neuropeptide CGRP, but not substance P, promotes G-CSF-induced HSC mobilization.
a, Absolute numbers of HSCs (Lin Sca-1+ c-Kit+ CD150+ CD48) and LSK cells (Lin Sca-1+ c-Kit+) per mL of peripheral blood following G-CSF-induced mobilization in C57BL/6 mice implanted with osmotic pumps containing saline or substance P. n=5 mice per group. b, Bone marrow cellularity and the absolute numbers of LSK cells and HSCs in the bone marrow following G-CSF administration in C57BL/6 mice implanted with osmotic pumps containing saline or substance P. n=5 mice per group. c, Bone marrow cellularity and the absolute numbers of HSCs per femur from mice described in Fig. 2a. n=18, 9, 7, 7 mice, respectively. d, Experimental design to determine the effect of CGRP on HSC mobilization of 6OHDA-denervated mice (left). Absolute number of HSCs per mL of peripheral blood following G-CSF administration in saline-or 6OHDA- treated C57BL/6 mice implanted with osmotic pumps containing saline or CGRP. n=6 mice per group. Error bars represent s.e.m. Two-tailed unpaired Student’s t test.
Extended Data Fig. 6.
Extended Data Fig. 6.. Ramp1-deficient mice exhibit no haematopoietic defect at steady state.
a, Ramp1 mRNA expression levels determined by quantitative PCR in total bone marrow cells derived from Ramp1+/+ or Ramp1−/− mice. n=5 biological sample. b, c, White blood cell counts, and the absolute numbers of B cells (B220+), T cell (CD3e+) and myeloid cells (Mac-1+) per mL of peripheral blood from Ramp1+/+ or Ramp1−/− mice at steady state. n=5 mice per group. d, e, Bone marrow cellularity, and the absolute numbers of LSK (Lin Sca-1+ c-Kit +) cells, B cells (B220+), T cell (CD3e+) and myeloid cells (Mac-1+) per femur from Ramp1+/+ or Ramp1−/− mice at steady state. n=5 mice per group. f, Experimental design to determine the homing efficiency of HSCs (Lin Sca-1+ c-Kit+ CD150+ CD48) and LSK cells from Ramp1+/+ and Ramp1−/− mice (CD45.2) to the bone marrow of lethally irradiated recipients (CD45.1) (left panel). Percentage of donor CD45.2+ HSCs and LSK cells detected in the recipient bone marrow (right panel). n=5 mice per group. g, BM cellularity and the absolute number of HSCs in the BM. n=3, 4, 3, 3 mice, respectively. Error bars represent s.e.m. Two-tailed unpaired Student’s t test (a-f) or one-way ANOVA (g).
Extended Data Fig. 7.
Extended Data Fig. 7.. Nociceptive nerve-deficient mice exhibit no alteration of HSC niche components following G-CSF treatment.
a, Absolute numbers of MSCs (CD45 Ter119 CD31 CD51+ PDGFRα+), ECs (CD45 Ter119 CD31high), and macrophages (Gr-1 F4/80+ CD115int SSCint/lo) per femur from saline- or RTX-treated mice following G-CSF treatment. n=4, 4 (left and middle), 6, 8 (right) mice, respectively. b, qRT-PCR quantification of Cxcl12 mRNA levels in total bone marrow cells, sorted MSCs and ECs from saline- or RTX-treated mice following G-CSF treatment. n=5 mice per group. c, Bone marrow extracellular fluid (BMEF) CXCL12 levels measured by ELISA. n=3, 5, 4 (left), 3, 4, 5 (middle), 4, 5 (right) mice, respectively. d. Mean fluorescence intensities (MFI) in the expression of CXCR4, VLA4 and CD44 on HSCs (Lin Sca-1+ c-Kit+ CD150+ CD48). n=4 mice per group Error bars represent s.e.m. Two-tailed unpaired Student’s t test (a, b, d) or one-way ANOVA (c).
Extended Data Fig. 8.
Extended Data Fig. 8.. Transcriptome analysis by RNA-seq of HSCs from Ramp1+/+ and Ramp1−/− mice.
a, Heatmap shows differentially expressed genes between wild-type- and Ramp1−/−-sorted HSCs (adjusted P value <0.05). b, Gene set enrichment analyses showing up-regulated and down-regulated pathways in Ramp1−/− HSCs compared to wild-type HSCs (P<0.01, n=3 biological replicates per group). c, Gene set enrichment analyses showing significant alterations of gene sets involved in the Gαs/AC/cAMP pathway. d, e, Schematic illustration of the dual stimulation experiment (d). Absolute number of HSCs (Lin Sca-1+ c-Kit+ CD150+ CD48) in the mobilized peripheral blood of mice treated with control saline, desipramine (DES), CGRP, or both DES and CGRP (e). n=9, 4, 8, 4 mice, respectively. Error bars represent s.e.m. One-way ANOVA.
Extended Data Fig. 9.
Extended Data Fig. 9.. Spicy food ingestion enhances HSC mobilization.
a, Scoville heat scale for chili peppers. 100 ppm=100 mg/kg. b. Three pellets of standard chow (brown) and spicy chow (red) were provided to 2 mice (6:00 pm on day 1). Sixteen hours later (10:00 am on day 2), two of the three standard pellets were consumed while spicy food pellets remained untouched. c, Daily food intake and the body weight of mice fed with standard or capsaicin-containing diet. n=5 (left), 4 mice (right) per group. d, CGRP levels in the BMEF from mice fed with control- or capsaicin- diet. n=9 mice per group. e, Absolute numbers of HSCs (Lin Sca-1+ c-Kit+ CD150+ CD48) in the bone marrow following G-CSF-induced mobilization in mice fed with standard or capsaicin-containing chow (left). n=6, 7 mice, respectively. Cell cycle analysis of BM HSCs was determined by FACS using anti-Ki67 and Hoechst 33342 staining. n=6 mice. f, White blood cell counts and absolute numbers of LSK cells (Lin Sca-1+ c-Kit+) per mL of peripheral blood following G-CSF-induced mobilization in mice fed with standard or capsaicin-containing diet. n=6, 7 mice, respectively. g, i, Peripheral total blood donor chimerism (CD45.2+) in CD45.1-recipient mice transplanted with 0.5 x 10⁶ CD45.1 competitor BM cells and 250 HSCs sorted from mobilized blood (g) or BM (i) from mice fed with standard or capsaicin chow. n=9, 8 (g), 8, 8 (i) mice, respectively. h, j. Peripheral blood B cell (B220+CD45.2+), T cell (CD3e+CD45.2+) and myeloid cell (Mac-1+CD45.2+) donor chimerism in CD45.1-recipient mice transplanted with 250 blood HSCs (h) or BM HSCs (j) with competitor bone marrow cells at 16 weeks post-transplantation. n=9, 8 (h), 8, 8 (j) mice, respectively. k, Experimental design to determine the effects of CGRP administration on HSC competitiveness. l, Peripheral total blood donor chimerism (CD45.2+) in CD45.1-recipient mice transplanted with 0.5 x 10⁶ CD45.1 competitor BM cells and 250 HSCs sorted from mobilized blood from PBS- or CGRP- treated mice. n=7, 9 mice, respectively. m, Peripheral blood B cell, T cell and myeloid cell donor chimerism in CD45.1-recipient mice transplanted with 250 blood HSCs with competitor bone marrow cells at 16 weeks post-transplantation. n=7, 9 mice, respectively. Error bars represent s.e.m. Two-tailed unpaired Student’s t test. For box plots, the box spans from the 25th to 75th percentiles and the centerline was plotted at the median. Whiskers represent minimum to maximum range.
Extended Data Fig. 10.
Extended Data Fig. 10.. Nociceptor-mediated HSC mobilization.
Schematic representation showing that nociceptive nerve-derived CGRP, but not substance P, acts via CGRP receptors on HSCs to enhance their mobilization via cAMP-medicated signalling pathway.
Figure 1.
Figure 1.. Nociceptive neurons promote HSC mobilization.
a, b, Representative confocal z-stack projection of C57BL/6 mouse femur stained for CGRP (red), TH (light blue), and TUBB3 (green) nerve fibres. Scale bar, 100μm. Femoral sensory and sympathetic innervation quantified by CGRP+, TH+ or TUBB3+ stained area divided by total BM area. n=3 mice. c, Schematic illustration of G-CSF-induced HSC mobilization and analyses. d, Absolute numbers of HSCs (LinSca-1+cKit+CD150+CD48) per mL of peripheral blood following G-CSF-induced mobilization in saline- or RTX-treated mice. n=11,13 mice, respectively. e, Colony-forming units (BFU-E, CFU-GM, and CFU-GEMM) per mL of G-CSF-mobilized blood from saline- or RTX-treated mice. n=4,5 mice, respectively. f, Left, representative images of the spleen following G-CSF administration in saline- or RTX-treated mice. Scale bar, 2mm; middle and right, cellularity and absolute numbers of HSCs in the spleen of saline and RTX-treated mice after G-CSF. n=11 mice per group. g, HSC numbers per femur from saline- or RTX-treated mice after G-CSF. n=11, 13 mice, respectively. h, i, HSC numbers per mL of peripheral blood or per femur following G-CSF mobilization in Nav1.8-Cre;iDTA+ and Nav1.8-Cre+;iDTA+. n=4,5 mice, respectively. j, Peripheral blood donor chimerism (CD45.2+) in CD45.1-recipient mice transplanted with mobilized blood (CD45.2) derived from saline or RTX-treated mice mixed with CD45.1 competitor BM cells at the indicated time points post-transplantation. n=9,8 mice, respectively. Error bars represent s.e.m. Two-tailed unpaired Student’s t test.
Figure 2.
Figure 2.. Nociceptor-derived CGRP induces HSC mobilization via its cognate receptor CALCRL/ RAMP1.
a, Schematic illustration of the rescue experiment. b, Bone marrow extracellular fluid (BMEF) CGRP levels measured by ELISA (n=11,6,3,4 mice, respectively). c, Absolute numbers of HSCs (LinSca-1+cKit+CD150+CD48) per mL of peripheral blood following G-CSF mobilization in saline- or RTX-treated mice implanted with osmotic pumps containing saline or CGRP. n=18,9,7,7 mice, respectively. d, e, HSC numbers per mL of peripheral blood or per femur from Ramp1+/+ (WT) or Ramp1−/− (KO) mice with or without G-CSF. n=5 mice per group. f, Ramp1 mRNA levels in sorted HSCs, endothelial and stromal compartments (from RNA-seq datasets,). g, Schematic illustration of reciprocal transplantation of BM cells from Ramp1−/− (KO) or Ramp1+/+ (WT) mice into lethally irradiated Ramp1+/+ (WT) or Ramp1−/− (KO) recipients and G-CSF was injected 8 weeks post-transplantation. h, HSCs per mL of peripheral blood following G-CSF treatment after reciprocal transplantation. n=6,7,5,6 mice, respectively. i, Schematic illustration of mobilization experiment with Vav1-iCre+;Calcrlf/f mice. j, k, HSCs per mL of blood or per femur following G-CSF treatment in Vav1-iCre+;Calcrlw/w or Vav1-iCre+;Calcrlf/f mice. n=6 mice per group. Error bars represent s.e.m. Two-tailed unpaired Student’s t test (b,c,d,e,j,k) or one-way ANOVA (h).
Figure 3.
Figure 3.. RAMP1 signals directly in HSCs.
a. Quantification of Ramp1 mRNA levels in sorted cell populations from the BM by qRT-PCR. n=3-4 biological samples. b, Schematic illustration of the macrophage depletion experiment. c, Macrophage numbers (Gr-1F4/80+CD115intSSCint/lo) per femur from PBS or clodronate-liposome-treated mice implanted with osmotic pumps containing saline or CGRP. n=7 mice per group. d, CXCL12 levels in BMEF measured by ELISA. n=7 biological samples. e, f, HSCs (LinSca-1+cKit+CD150+CD48) and LSKs (LinSca-1+cKit+) per mL of peripheral blood. n=7 mice per group. g, Experimental design of the transwell assay. h, Colony-forming units per well of migrated stem progenitor cells from Ramp1+/+ (WT) or Ramp1−/− (KO) mice. n=5, 4 mice, respectively. i, Schematic illustration of the mixed chimerism experiment. j, Chimerism of mobilized HSC in blood normalized to the chimerism of BM HSCs. n=4,4,3,3 mice, respectively. Error bars represent s.e.m. Two-tailed unpaired Student’s t test (c-e, h) or one-way ANOVA (j).
Figure. 4.
Figure. 4.. CGRP amplifies HSC mobilization via the Gαs/AC/cAMP pathway.
a, Volcano plot showing differentially expressed genes (P<0.05) in Ramp1−/− compared to Ramp1+/+ HSCs. b, c, Absolute numbers of HSCs per mL of blood or per femur following G-CSF administration in Ramp1+/+ and Ramp1−/− mice treated with vehicle or forskolin. n=7,5,6 mice, respectively. d, HSC numbers in plerixafor-mobilized blood from saline or CGRP-treated mice. n=9 mice per group. e, HSCs per mL of blood from mice treated with G-CSF, G-CSF+AMD3100 or G-CSF+AMD3100+CGRP. n=3 mice per group. f, Blood donor chimerism (CD45.2) in CD45.1-recipient mice transplanted with mobilized blood (CD45.2) mixed with CD45.1 competitor BM cells, 16 weeks post-transplantation. n=5 mice per group. g, HSC numbers in G-CSF-mobilized blood of saline or cisplatin-treated mice with or without CGRP administration. n=7,4,4 mice, respectively. h, Experimental design to determine the effect of capsaicin diet on HSC mobilization. i, j, Representative gating strategy and quantification of HSCs per mL of blood following G-CSF administration in saline or RTX-treated mice fed on control or capsaicin-containing diet. n=6,7,6,4 mice, respectively. k, l, Blood leukocyte chimerism in CD45.1-recipient mice transplanted with mobilized blood (CD45.2) derived from mice fed on control or capsaicin diet mixed with CD45.1 competitor BM cells. n=9 mice per group. Error bars represent s.e.m. Two-tailed unpaired Student’s t test (d,k,l) or one-way ANOVA for (b,c,e,f,g,j). For box plots, the box spans from the 25th to 75th percentiles and the centerline shows the median. Whiskers represent minimum to maximum range.

Comment in

References

    1. Gao X, Xu C, Asada N & Frenette PS The hematopoietic stem cell niche: from embryo to adult. Development 145, doi: 10.1242/dev.139691 (2018). - DOI - PMC - PubMed
    1. Hoggatt J, Kfoury Y & Scadden DT Hematopoietic Stem Cell Niche in Health and Disease. Annu Rev Pathol 11, 555–581, doi: 10.1146/annurev-pathol-012615-044414 (2016). - DOI - PubMed
    1. Katayama Y et al. Signals from the sympathetic nervous system regulate hematopoietic stem cell egress from bone marrow. Cell 124, 407–421, doi: 10.1016/j.cell.2005.10.041 (2006). - DOI - PubMed
    1. Lucas D et al. Chemotherapy-induced bone marrow nerve injury impairs hematopoietic regeneration. Nat Med 19, 695–703, doi: 10.1038/nm.3155 (2013). - DOI - PMC - PubMed
    1. Maryanovich M et al. Adrenergic nerve degeneration in bone marrow drives aging of the hematopoietic stem cell niche. Nat Med 24, 782–791, doi: 10.1038/s41591-018-0030-x (2018). - DOI - PMC - PubMed

Publication types

MeSH terms