. 2021 Jan;589(7842):442-447.
doi: 10.1038/s41586-020-03071-0. Epub 2020 Dec 23.

RANK links thymic regulatory T cells to fetal loss and gestational diabetes in pregnancy

Affiliations

RANK links thymic regulatory T cells to fetal loss and gestational diabetes in pregnancy

Magdalena Paolino et al. Nature. 2021 Jan.

Abstract

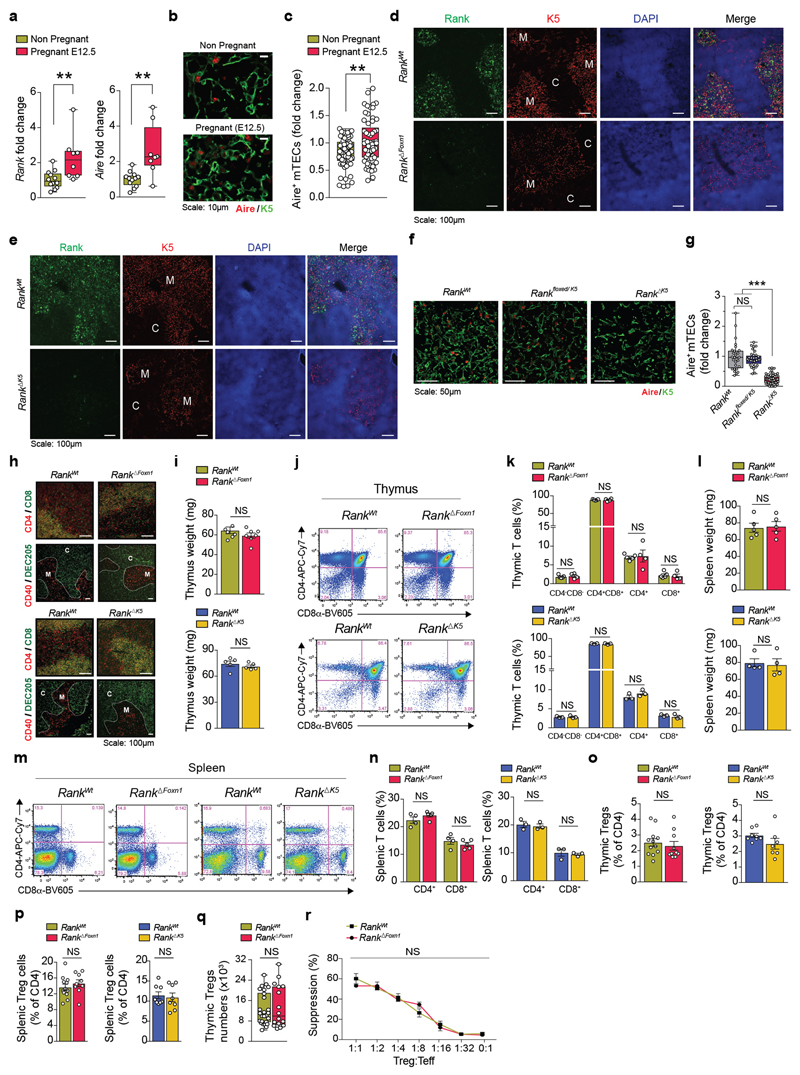
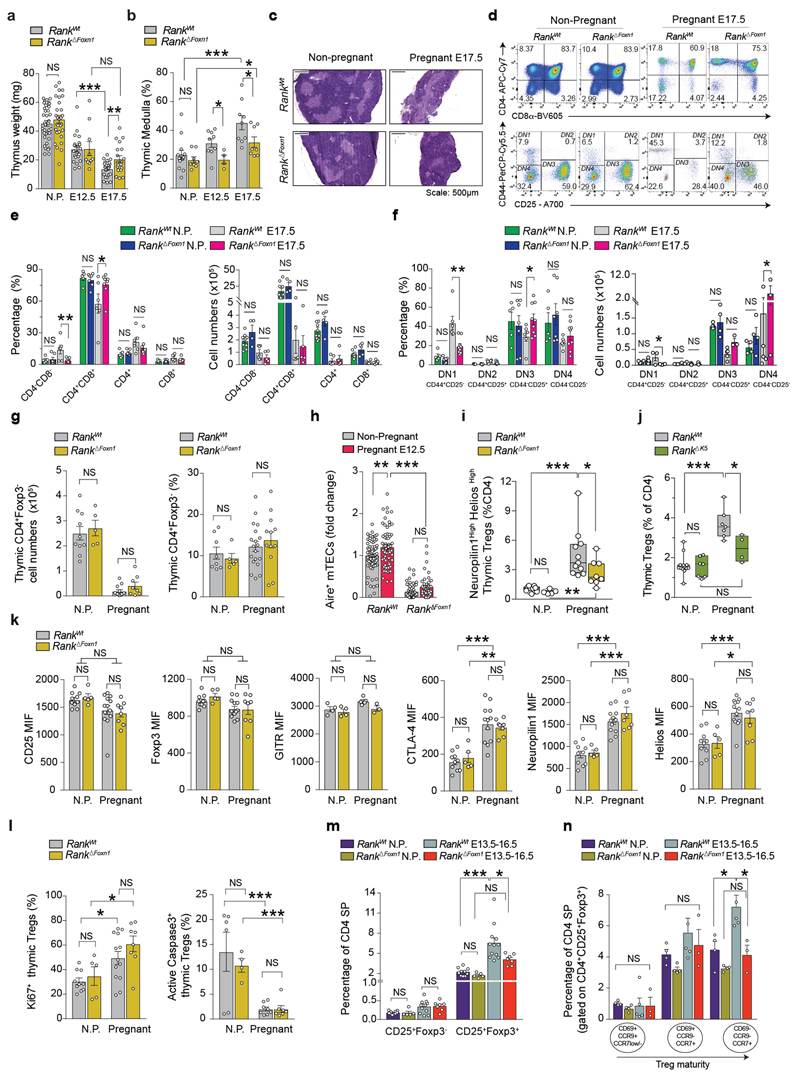
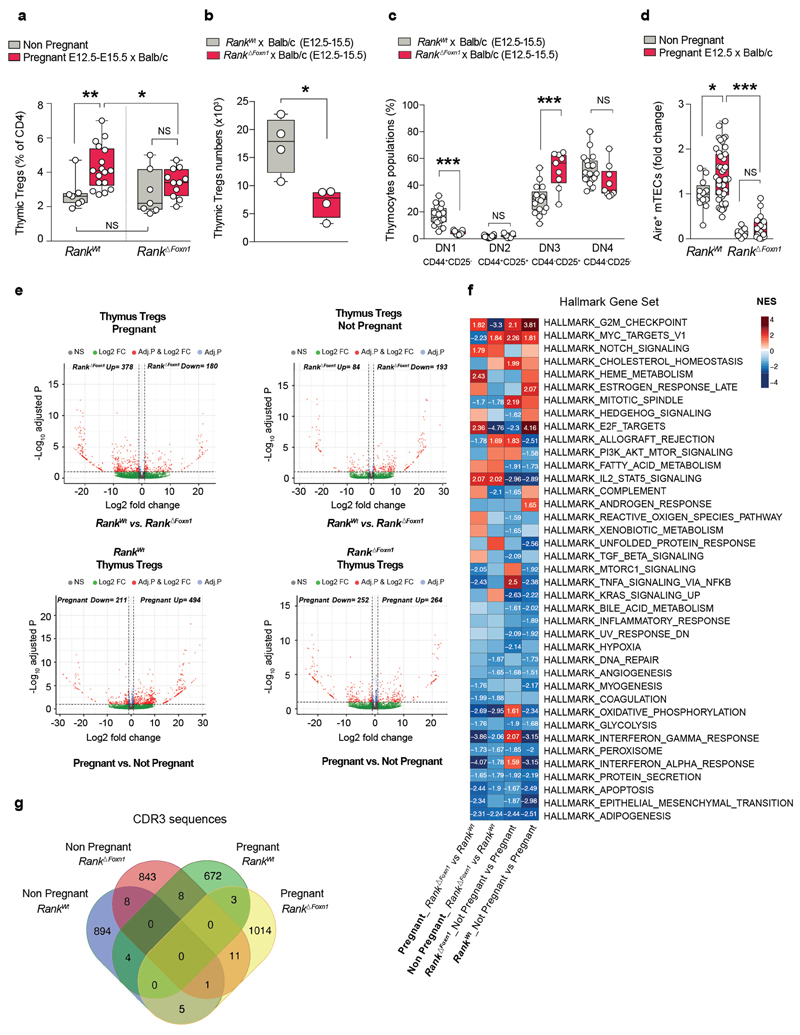
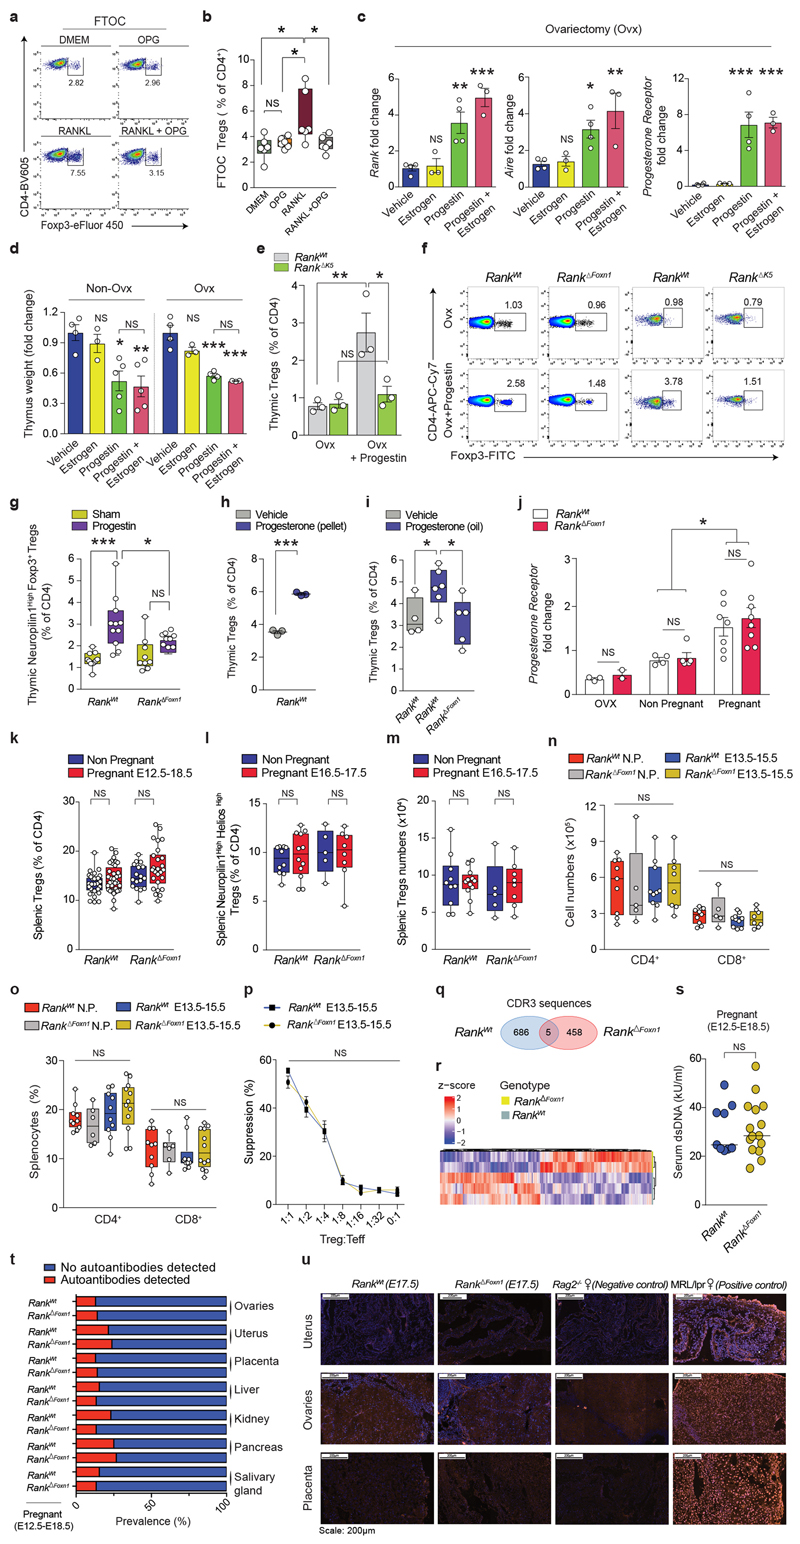
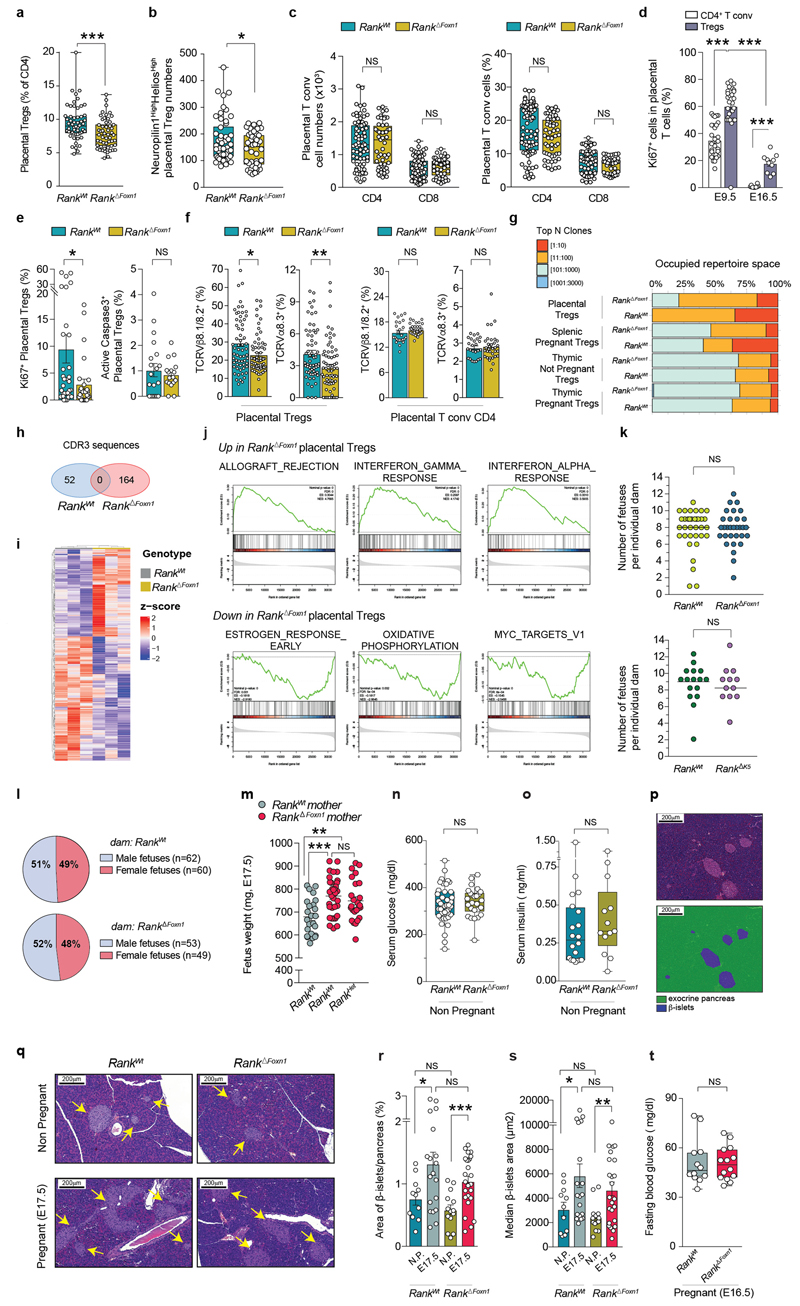
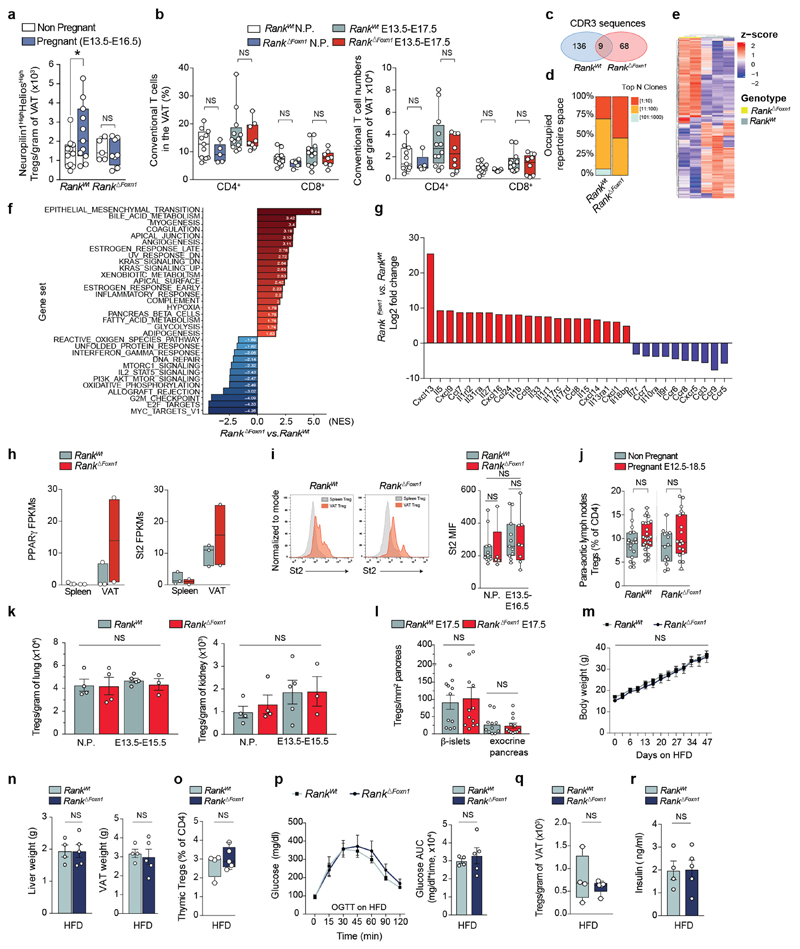
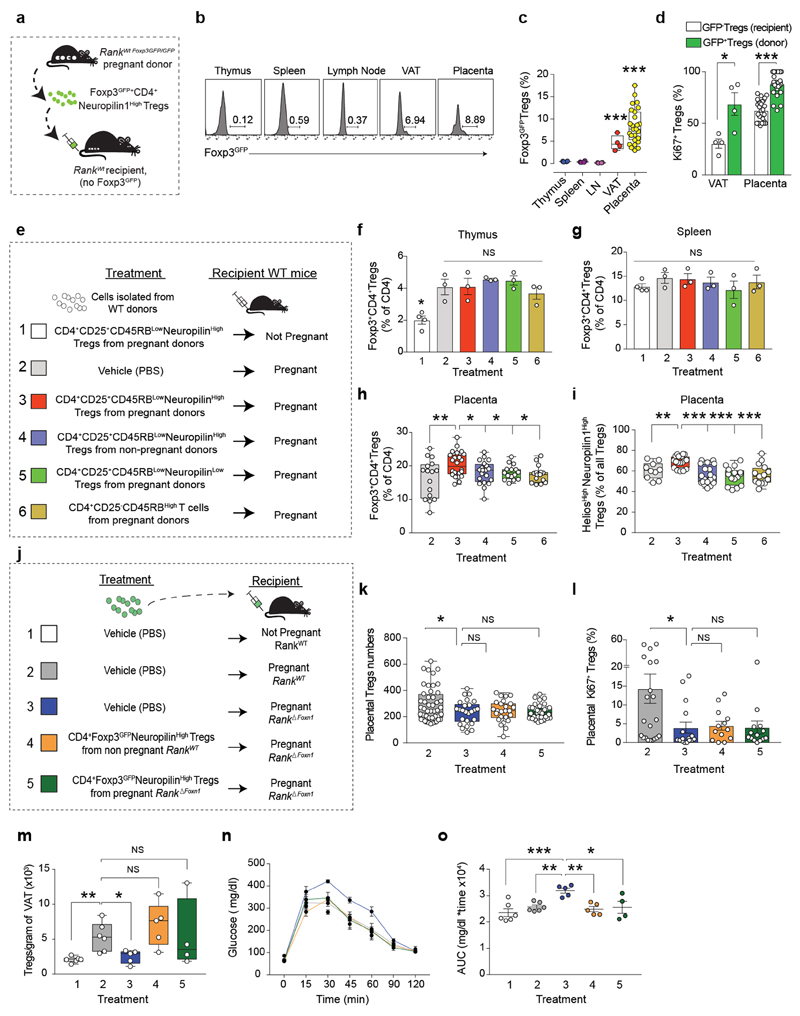
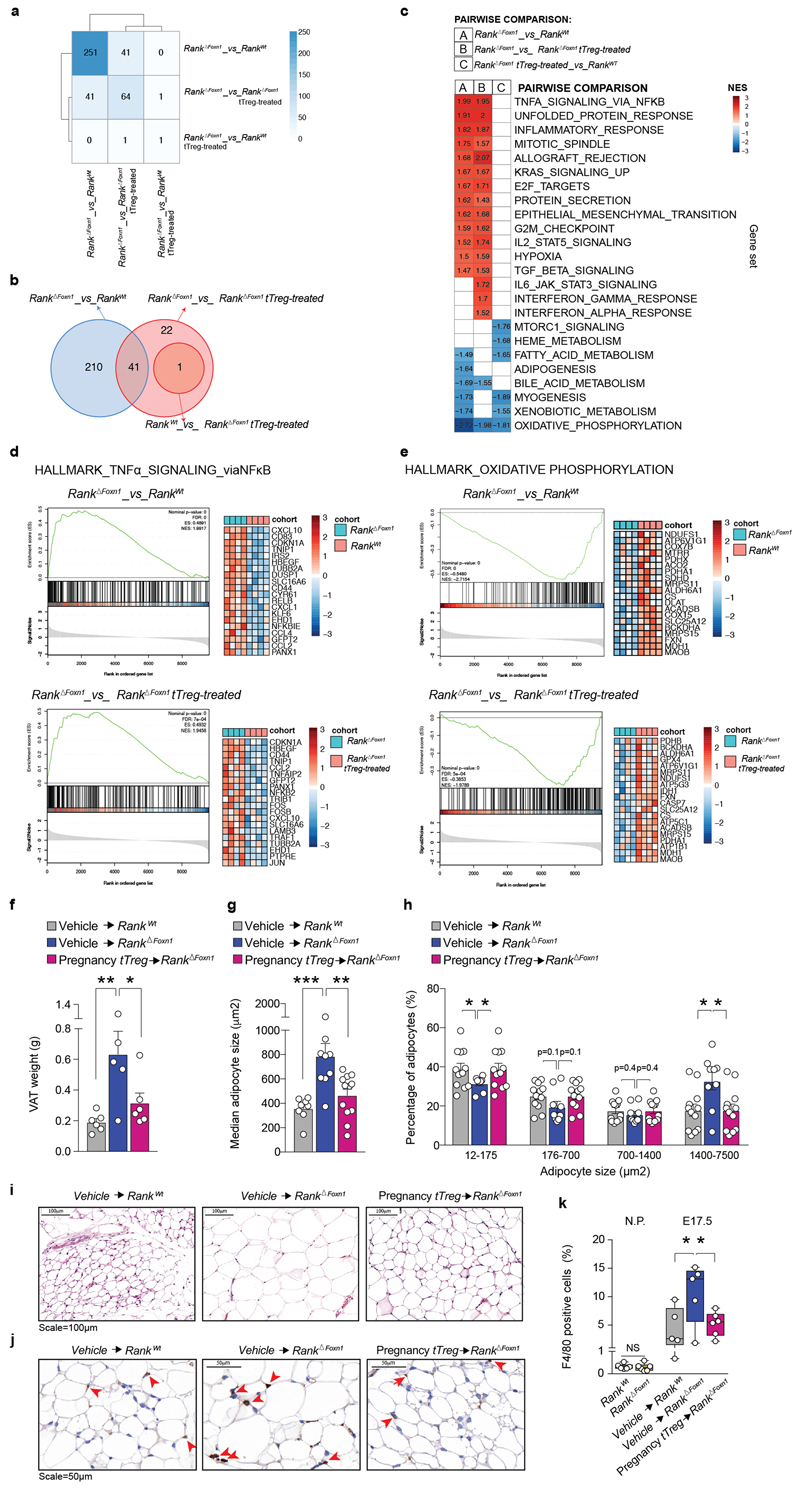
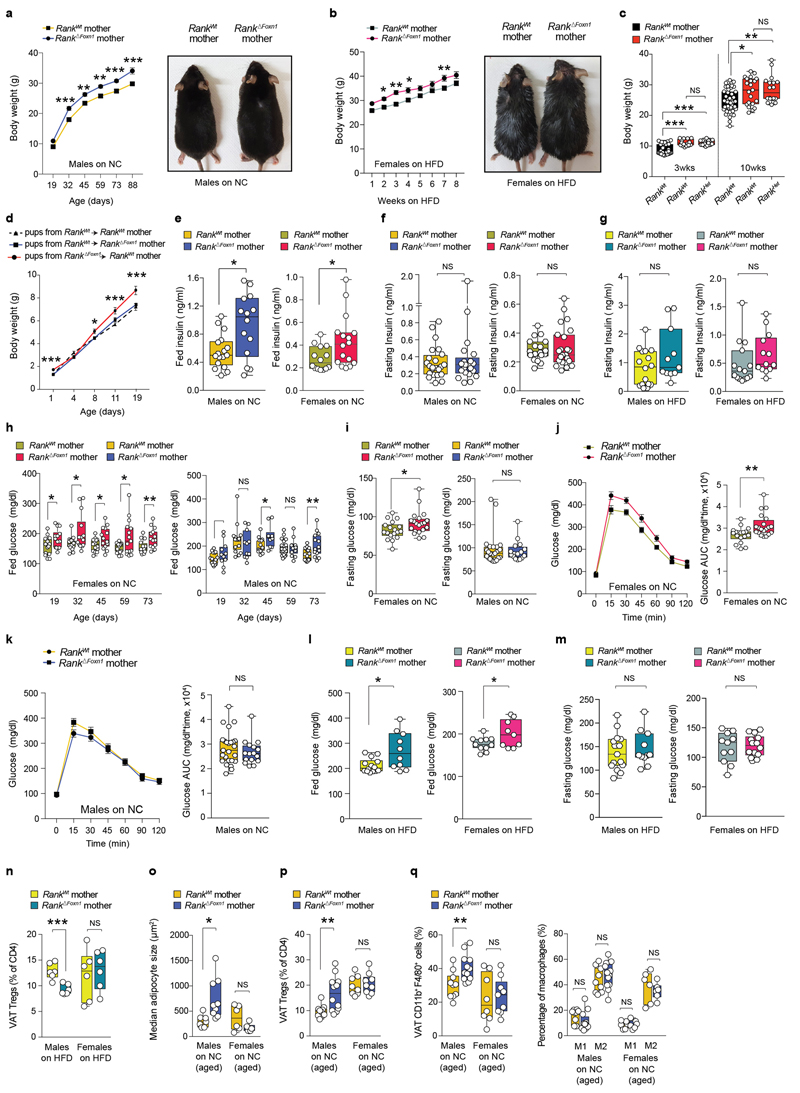
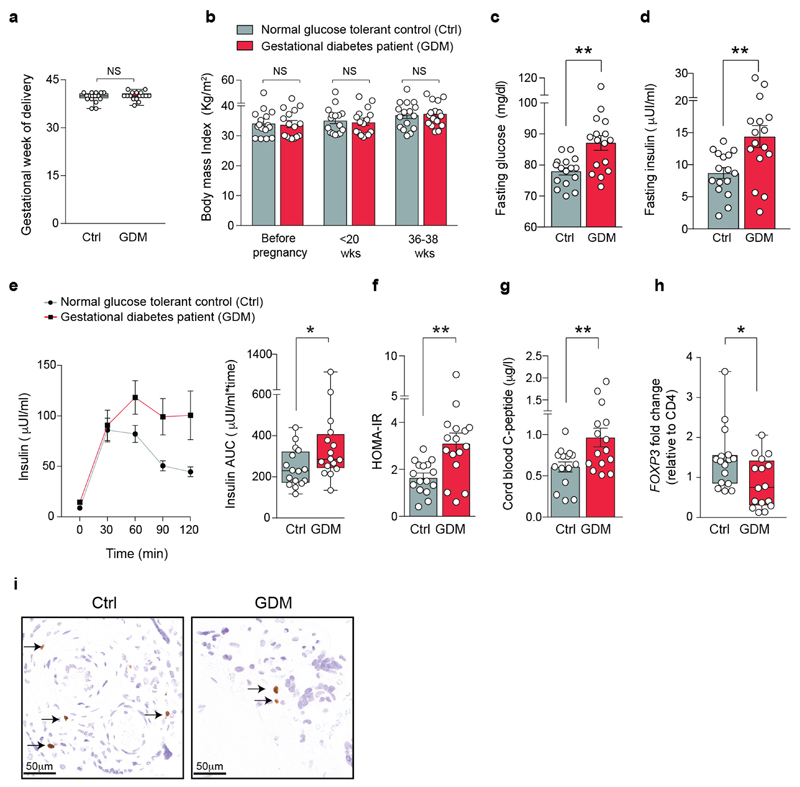
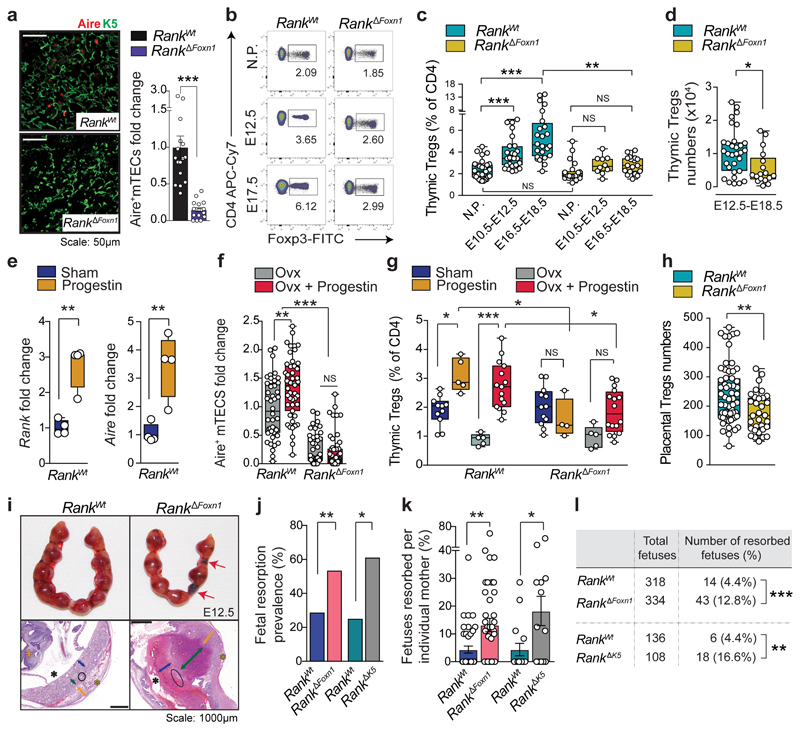
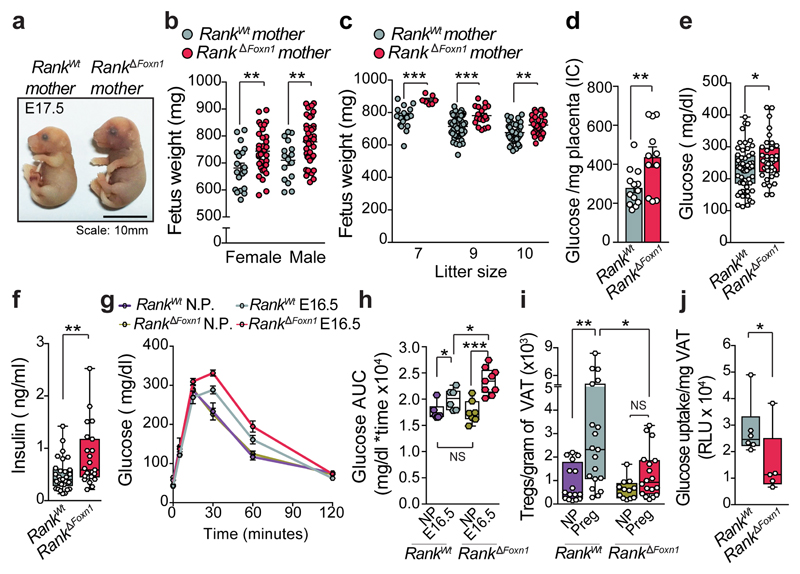
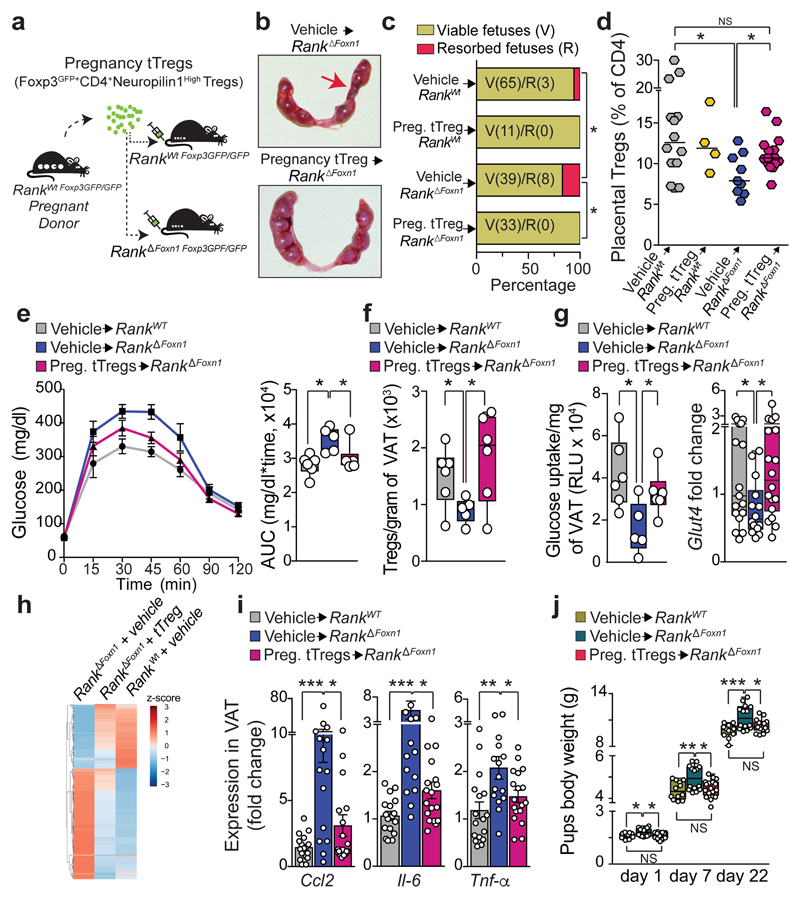
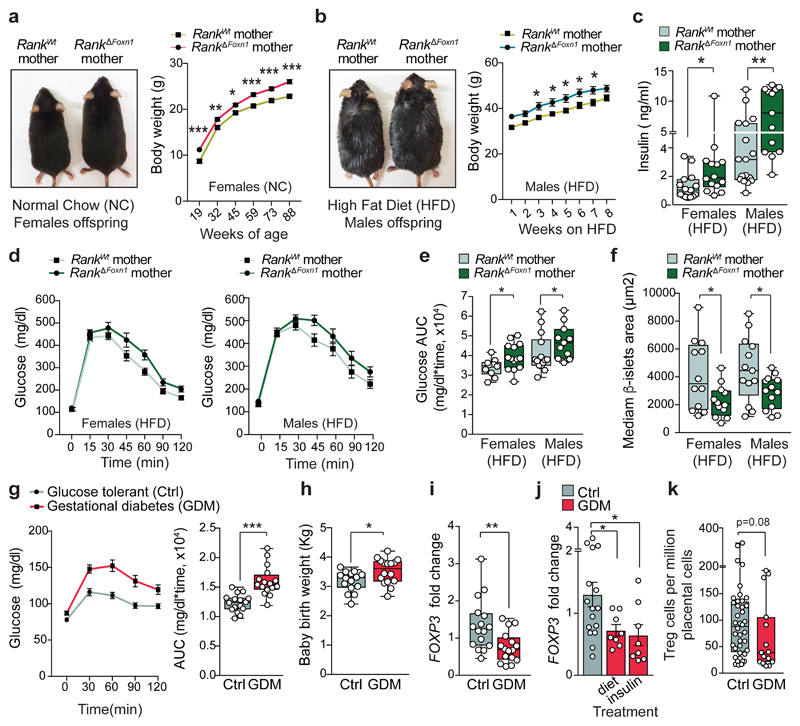
Successful pregnancies rely on adaptations within the mother1, including marked changes within the immune system2. It has long been known that the thymus, the central lymphoid organ, changes markedly during pregnancy3. However, the molecular basis and importance of this process remain largely obscure. Here we show that the osteoclast differentiation receptor RANK4,5 couples female sex hormones to the rewiring of the thymus during pregnancy. Genetic deletion of Rank (also known as Tnfrsf11a) in thymic epithelial cells results in impaired thymic involution and blunted expansion of natural regulatory T (Treg) cells in pregnant female mice. Sex hormones, in particular progesterone, drive the development of thymic Treg cells through RANK in a manner that depends on AIRE+ medullary thymic epithelial cells. The depletion of Rank in the mouse thymic epithelium results in reduced accumulation of natural Treg cells in the placenta, and an increase in the number of miscarriages. Thymic deletion of Rank also results in impaired accumulation of Treg cells in visceral adipose tissue, and is associated with enlarged adipocyte size, tissue inflammation, enhanced maternal glucose intolerance, fetal macrosomia, and a long-lasting transgenerational alteration in glucose homeostasis, which are all key hallmarks of gestational diabetes. Transplantation of Treg cells rescued fetal loss, maternal glucose intolerance and fetal macrosomia. In human pregnancies, we found that gestational diabetes also correlates with a reduced number of Treg cells in the placenta. Our findings show that RANK promotes the hormone-mediated development of thymic Treg cells during pregnancy, and expand the functional role of maternal Treg cells to the development of gestational diabetes and the transgenerational metabolic rewiring of glucose homeostasis.


Conflict of interest statement

Competing interests The authors declare no competing interests.

Figures

Extended Data Fig. 1
Extended Data Fig. 1. Characterization of non-pregnant Rank ΔFoxn1 and Rank ΔK5 conditional knockout mice.
a, qPCR analysis for relative Rank and Aire mRNA expression in the thymus of non-pregnant (N.P.; n = 12) and E12.5 pregnant (n = 8) Rank WT mice, normalized to non-pregnant values. Data are shown as box-and-whisker plots (from minimal to maximal values); dots represent individual mice.**P < 0.01. Two-tailed Student’s t-test. b, c, Immunofluorescence staining for AIRE (red) and K5 (K5, green) in thymus cross-sections (b, representative of n = 68/61 images) and relative quantification of AIRE+ mTECS in the thymic medullary regions (c) of non-pregnant and E12.5 pregnant Rank WT females (n = 11/12). Data are shown as box-and-whisker plots (from minimal to maximal values); dots represents individual data points (4–7 medullary fields per mouse), normalized to Rank WT non-pregnant values. **P < 0.01. Two-tailed Student’s t-test. d, e, Representative immunofluorescence staining for RANK (green), K5 (red), and DAPI (blue, to visualize nuclei) in thymic cross-sections of Rank WT and Rank ΔFoxn1 (d) and Rank WT and Rank ΔK5 (e) mice. Note that Rank expression is confined to the thymic medullary epithelium in Rank WT mice and is effectively ablated in Rank ΔFoxn1 as well as Rank ΔK5 mice. M, medulla; C, cortex. Images are representative of n = 5 mice per group. f, Immunofluorescence staining for AIRE (red) and K5 (green) in thymic cross-sections of Rank WT, Rank flox/K5, and Rank ΔK5 mice. Representative of n = 28/35/56 images. g, Relative numbers of AIRE+ mTECs in thymic medullary regions of Rank WT, Rank flox/K5 and Rank ΔK5 littermates, as determined by immunofluorescence. Note that Rank heterozygosity and Cre expression in the thymic epithelium does not affect AIRE+ mTECs numbers. Data were normalized to Rank WT values and are shown as box-and-whisker plots (from minimal to maximal values); dots represent individual data points. n = 5/5/9 (4–6 fields per mouse). ***P < 0.001. One-way ANOVA, Tukey’s post hoc test. h, Organization of the thymic microenvironment. Representative immunofluorescence staining of thymic cross-sections of Rank WT and Rank ΔFoxn1 as well as Rank WT and Rank ΔK5 mice, to evaluate thymocyte distribution (top), defined by CD4 (red) and CD8 (green), as well as thymic epithelium organization (bottom), defined by CD40 (medulla, red) and DEC205 (cortex, green) expression. C, cortex; M, medulla. Representative of n = 5 mice per group. i, Thymus weights in Rank WT and Rank ΔFoxn1 (n = 7) as well as Rank WT and Rank ΔK5 (n = 5) female mice. Data are mean ± s.e.m. Two-tailed Student’s t-test. j, k, Representative FACS blots for CD4 and/or CD8α-expressing thymocytes (j) and their respective percentages (k, mean ± s.e.m.) in the thymus of Rank WT and Rank ΔFoxn1 (n = 5/4) and Rank WT and Rank ΔK5 (n = 3/3) female mice. Two-tailed Student’s t-test. l, Spleen weights of Rank WT and Rank ΔFoxn1 (n = 5/5) and Rank WT and Rank ΔK5 (n = 4/4) female mice. Data are mean ± s.e.m. Two-tailed Student’s t-test. m, n, Representative FACS blots for CD4 and/or CD8α expression (m) and percentages of CD4+ or CD8+T cells (n, mean ± s.e.m.) in the spleen of Rank WT and Rank ΔFoxn1 (n = 5/4) mice as well as Rank WT and Rank ΔK5 (n = 3/3) female mice. Two-tailed Student’s t-test. o, p, Percentages of CD4+FOXP3+Treg cells in the thymus (o) and spleen (p) of Rank WT and Rank ΔFoxn1 (n = 12/9) mice as well as Rank WT and Rank ΔK5 (n = 8/7) female mice. Data are mean ± s.e.m., determined by FACS. Two-tailed Mann–Whitney U-test. q, Total number of Treg cells in the thymus of Rank WT and Rank ΔFoxn1 (n = 26/16) female mice. These mice are the littermate controls of the pregnant cohorts shown in Fig. 1d. Data are shown as box-and-whisker plots (from minimal to maximal values) and dots represent individual mice. Two-tailed Student’s t-test. r, Percentage of suppression of CD4+T effector cells proliferation mediated by Treg cells, as determined by flow cytometry using CellTrace Violet dilution, for peripheral (pool of splenic and lymph node) Treg cells isolated from Rank WT (n = 4) and Rank ΔFoxn1 (n = 4) female mice and co-cultured with Rank WT effector T cells at the indicated ratios. Data are mean ± s.e.m. Two-way ANOVA, Sidak’s multiple comparisons test. All data in the figure are from young (4–12-week-old) and non-pregnant female mice.
Extended Data Fig. 2
Extended Data Fig. 2. Rank deletion in mTECs impairs thymic adaptations and thymic Treg cell expansion during pregnancy.
a, b, Thymus weights (a) and percentages (b) of the thymic medulla areas in non-pregnant as well as in E12.5 and E17.5 pregnant Rank WT and Rank ΔFoxn1 mice. Data are mean ± s.e.m., each dot represents an individual mouse. n = 37/22/22 and n = 29/10/19 in a; n = 13/9/9 and n = 8/4/8 in b; for the Rank WT and Rank ΔFoxn1 groups, respectively. *P < 0.05; **P < 0.01; ***P < 0.001. Two-tailed Student’s t-test. Similar thymic involution defects were observed in Rank ΔK5 dams as compared to their Rank WT counterparts (data not shown). c, H&E-stained thymic cross-sections of non-pregnant and E17.5 pregnant Rank WT and Rank ΔFoxn1 mice. Representative of n = 13/8 and n = 9/8 (E17.5) mice. These sections as well as thymic cryo-sections stained for DAPI/K5 (data not shown) were used for the quantification of the thymic medulla expansion during pregnancy shown in b. d, Representative FACS blots for CD4 and CD8 expression (upper blots) and CD44 and CD25 expression (lower blots, gated on double negative -DN- CD4CD8 cells) in thymocytes of non-pregnant and E17.5 pregnant Rank WT and Rank ΔFoxn1 females. Numbers indicate percentage of cells in each quadrant. DN1, CD44+CD25; DN2, CD44+CD25+; DN3, CD44CD25+; DN4, CD44CD25. e, f, Percentages and total cell numbers of thymocyte subpopulations expressing CD4 and/or CD8 (e) and early developing double-negative (DN) thymocytes (as detected by CD44 and CD25 staining on CD4CD8 DN populations) (f) in the thymus of non-pregnant and E17.5 pregnant Rank WT and Rank ΔFoxn1 females. Data are mean ± s.e.m., dots represent individual mice. n = 3–10 animals per group *P < 0.05; **P < 0.01. One-way ANOVA. Similar percentage results were observed when comparing Rank WT and Rank ΔK5 dams at E18.5 (not shown). g, Total cell numbers and percentages of conventional single positive CD4+ thymocytes (FOXP3) in the thymus of non-pregnant and E13.5–E16.5 pregnant Rank WT and Rank ΔFoxn1 females. Data are mean ± s.e.m., dots represent individual mice. n = 5–19 animals per group. Two-tailed Student’s t-test. h, Relative quantification of AIRE+ mTECS in the thymic medullary regions of non-pregnant and E12.5 pregnant Rank WT (n = 12/12) and Rank ΔFoxn1 (n = 13/10) mice, as determined by immunofluorescence (5–7 medullary fields per mouse). Data are mean ± s.e.m., normalized to Rank WT non-pregnant values. Each dot represents an individual data point. **P < 0.01; ***P < 0.001. One-way ANOVA, Tukey’s post hoc test. i, Percentages of neuropilin-1highHelioshighFOXP3+Treg cells (of total CD4+ cells) in the thymus of non-pregnant (n = 9/5) and pregnant (pool from E15.5–E17.5, n = 11/8) Rank WT and Rank ΔFoxn1 females, as determined by FACS analysis. Data are shown as box-and-whisker plots (from minimal to maximal values) and each dot represents an individual mouse. *P < 0.05; **P < 0.01; ***P < 0.001. Two-tailed Mann–Whitney U-test. j, Percentages of CD4+FOXP3+Treg cells (of total CD4+ cells) in the thymus of non-pregnant and E18.5 pregnant Rank WT and Rank ΔK5 females. Data are shown as box-and-whisker plots (from minimal to maximal values); dots represent individual mice. n = 12/7 for Rank WT and n = 7/4 for Rank ΔK5 mice. *P < 0.05; ***P < 0.001. One-way ANOVA, Tukey’s post hoc test. k, Mean fluorescence intensity (MIF) of CD25, FOXP3, GITR, CTLA-4, neuropilin-1 and Helios in thymic Treg cells of non-pregnant as well as in E13.5–E16.5 pregnant Rank WT and Rank ΔFoxn1 mice. Data are mean ± s.e.m., each dot represents an individual mouse with n = 4–13 animals per group. *P < 0.05; **P < 0.01; ***P < 0.001. One-way ANOVA, Tukey’s post hoc test. l, Percentage of proliferating (KI-67+) and apoptotic (active CASP3+) CD4+FOXP3+Treg cells in the thymus of non-pregnant as well as in E13.5–E16.5 pregnant Rank WT and Rank ΔFoxn1 mice. Data are mean ± s.e.m., each dot represents an individual mouse with n = 10/5/13/8 for KI-67 and n = 6/4/8/7 for CASP3. *P < 0.05; ***P < 0.001. One-way ANOVA, Tukey’s post hoc test. m, Frequencies of Treg cell precursors (CD25+FOXP3) and Treg cells (CD25+FOXP3+) in the thymus of non-pregnant (n = 10/5) and E13.5–E16.5 pregnant (n = 12/7) Rank WT and Rank ΔFoxn1 females. Data are mean ± s.e.m.; shown as percentage of CD4+ single-positive (SP) thymocytes. Dots represent individual mice. *P < 0.05; ***P < 0.001. One-way ANOVA, Tukey’s post hoc test. n, Frequencies of the subsequent mature populations of thymic CD4+CD25+FOXP3+Treg cells, based on CCR7, CCR9, CD69 expression, in the thymus of non-pregnant (n = 4/4) and E13.5–E16.5 pregnant (n = 5/3) Rank WT and Rank ΔFoxn1 females. Data are mean ± s.e.m., each dot represents an individual mouse. *P < 0.05. One-way ANOVA, Tukey’s post hoc test. All data in this figure are from syngeneic C57BL/6J pregnancies.
Extended Data Fig. 3
Extended Data Fig. 3. Rank ΔFoxn1 thymus in allogeneic pregnancies and transcriptome analysis of thymic Treg cells.
a, Percentages of CD4+FOXP3+Treg cells (of total CD4+ cells) in the thymus of individual non-pregnant (n = 7/7) and E12.5–E15.5 pregnant Rank WT and Rank ΔFoxn1 females (n = 17/11), crossed to allogeneic BALB/cJ males. *P < 0.05; **P < 0.01. Two-tailed Student’s t-test. b, Total numbers of CD4+FOXP3+Treg cells in the thymus of individual E12.5–E15.5 pregnant Rank WT and Rank ΔFoxn1 females (n = 4/4), crossed to allogeneic BALB/cJ males. *P < 0.05. Two-tailed Student’s t-test. c, Percentages of early developing double negative (DN) thymocytes (as detected by CD44 and CD25 staining on CD4CD8 DN populations) in the thymus of E12.5–E15.5 pregnant Rank WT and Rank ΔFoxn1 females crossed to allogeneic BALB/cJ males. n = 18/9. ***P < 0.001. Two-tailed Student’s t-test. d, Relative quantification of AIRE+ mTECS in the thymic medullary regions of non-pregnant and E12.5 pregnant Rank WT (n = 3/7) and Rank ΔFoxn1 (n = 2/4) females, crossed to BALB/cJ males, as determined by immunofluorescence (3–6 medullary fields per mouse) and normalized to Rank WT non-pregnant values. *P < 0.05. One-way ANOVA, Tukey’s post hoc tes). ad, The defects and Treg cell deficiencies in Rank ΔFoxn1 dams observed in syngeneic pregnancies are also present in allogeneic pregnancies. Data in ad are box-and-whisker plots (from minimal to maximal values) and each dot represents an individual data point. e, Volcano plots for differentially expressed genes in Treg cells isolated from the thymus of non-pregnant as well as pregnant (E17.5) Rank WT (n = 4/3) and Rank ΔFoxn1 (n = 4/4) female mice. Dots represent genes, colored as: not significant (NS, dark grey); log2-transformed fold change above threshold (log2FC; abs(log2FC) > = 1.0, green); adjusted P value above threshold (Adj. P, adjusted P < = 0.1, light grey); and significant, with log2-transformed fold change and adjusted P value both above thresholds (red). The numbers of significantly up- and downregulated genes are indicated on each plot. P values are based on a two-tailed Wald test and adjusted via the Benjamini–Hochberg procedure. f, Summary of GSEA Hallmark gene sets enrichment analysis for the expression profiles of thymic Treg cells isolated from non-pregnant as well as E17.5 pregnant Rank WT (n = 4/3) and Rank ΔFoxn1 (n = 4/4) females. Numbers are normalized enrichment scores (NES) and are only shown for significantly enriched gene set (defined as NES > = 1.4 and FDR < = 10%). g, Venn diagram showing the number of unique CDR3 nucleotide sequences identified in the TCRs of thymic Treg cells isolated from non-pregnant as well as E17.5 pregnant Rank WT (n = 4/3) and Rank ΔFoxn1 (n = 4/4) females. Sequences were determined from the RNA-sequencing data using the MiXCR software. For primary data on TCR clones see Supplementary Table 1.
Extended Data Fig. 4
Extended Data Fig. 4. Progesterone-driven thymic Treg cell expansion as well as characterization of splenic Treg cells and autoimmunity in pregnant Rank ΔFoxn1 mice.
a, b, Representative FACS blots (a) and percentages (b) of CD4+FOXP3+ Treg cells (gated on CD4+ cells) in wild-type fetal thymic embryonic lobes (FTOCs) treated with DMEM, RANKL (100 ng ml−1) and/or osteoprotegerin (OPG;1,000 ng ml−1). Data in b is a pool of 3 independent experiments, total n = 6 per group. Data are shown as box-and-whisker plots (from minimal to maximal values) and each dot represents an individual data point. *P < 0.05. One-way ANOVA, Tukey’s post hoc test. c, qPCR analysis for Rank, Aire and progesterone receptor (Pgr) mRNA expression in the thymus of ovariectomized wild-type C57BL/6J female mice (11 weeks old) that were vehicle-treated (n = 4), or subcutaneously-treated with oestrogen (10 μg kg−1 daily, n = 3), progestin (MPA; 90-day slow-release pellet of 50 mg, n = 4), or with both progestin and oestrogen (same doses as single treatments, n = 3) for 5 days. Data are mean ± s.e.m., each dot is an individual mouse. *P < 0.05; **P < 0.01; ***P < 0.001. One-way ANOVA, Dunnett’s post hoc test versus the vehicle group. d, Thymus weights in non-ovariectomized (Non-Ovx) and ovariectomized wild-type C57BL/6J female mice (7 weeks and 11 weeks old, respectively) that were vehicle-treated, or subcutaneously-treated with oestrogen, progestin, or with progestin and oestrogen (same hormonal doses as in c) for 5 days. Data are mean ± s.e.m., each dot is an individual mouse (n = 3–5 per group). *P < 0.05; **P < 0.01; ***P < 0.001. One-way ANOVA, Dunnett’s post hoc test versus the vehicle group of each cohort. e, Percentage of thymic CD4+FOXP3+ Treg cells (of total CD4+ cells) in Rank WT and Rank ΔK5 ovariectomized females treated with sham surgery or subcutaneously with a progestin-releasing (MPA) pellet for 5 days. Data are mean ± s.e.m., each dot is an individual mouse (n = 3). *P < 0.05; **P < 0.01. One-way ANOVA, Tukey’s post hoc test. f, Representative FACS blots for thymic Treg cells (gated on single positive CD4+ cells, as shown in Supplementary Data 1) in Rank WT and Rank ΔFoxn1 as well as Rank WT and Rank ΔK5 ovariectomized females treated with sham surgery or subcutaneously with a progestin-releasing (MPA) pellet for 5 days. g, Percentages of neuropilin-1highFOXP3+ Treg cells (of total CD4+ cells) in the thymus of sham-treated (n = 11/9) and progestin-treated (n = 11/9) Rank WT and Rank ΔFoxn1 female mice. Data were determined by FACS analysis. Data are shown as box-and-whisker plots (from minimal to maximal values) and each dot represents an individual mouse. *P < 0.05; ***P < 0.001. One-way ANOVA, Tukey’s post hoc test. h, Percentages of thymic Treg cells in Rank WT females treated with sham-surgery or treated subcutaneously with progesterone (50 mg/21 day-release pellets) for 6 days (n = 3, each dot is an independent mouse and horizontal lines are median, error bars are s.e.m.). ***P < 0.001. Two-tailed Student’s t-test. i, Percentages of thymic Treg cells in Rank WT mice treated with vehicle (oil, n = 4), and Rank WT (n = 6) and Rank ΔFoxn1 (n = 5) mice treated subcutaneously with progesterone (450 μg in oil per day, n = 6/5) for 7 days. Data are shown as box-and-whisker plots (from minimal to maximal values) and each dot represents an individual mouse. *P < 0.05. Two-tailed Student’s t-test. j, qPCR analysis for the relative progesterone receptor mRNA expression in the thymus of ovariectomized (n = 3/2), non-ovarectomized and non-pregnant (n = 4/5), and E12.5–E13.5 pregnant (n = 7/8) Rank WT and Rank ΔFoxn1females, which is an expected finding in line with previous studies showing that RANKL/RANK acts downstream of progesterone. Data are mean ± s.e.m. Each dot represents an individual animal. *P < 0.05. Two-tailed Student’s t-test. k, Percentages of CD4+FOXP3+ Treg cells in the spleen of non-pregnant and pregnant (pool from E12.5–E18.5) Rank WT (n = 29/36) and Rank ΔFoxn1 (n = 17/26) female mice. Two-tailed Student’s t-test. l, Percentages of neuropilin-1highHelioshigh Treg cells (of total CD4+) in the spleen of non-pregnant and E16.5–E17.5 pregnant Rank WT (n = 10/12) and Rank ΔFoxn1 (n = 5/8) female mice. Two-tailed Student’s t-test. m, Total numbers of CD4+FOXP3+ Treg cells in the spleen of non-pregnant and pregnant (pool from E16.5–E17.5) Rank WT (n = 10/12) and Rank ΔFoxn1 (n = 5/8) female mice. Two-tailed Student’s t-test. n, o, Total numbers (n) and percentages (o) of CD4+ and CD8+ splenocytes in individual non-pregnant (n = 10/5) and E13.5–E15.5 pregnant (n = 12/8) Rank WT and Rank ΔFoxn1 female mice. One-way ANOVA, Tukey’s post hoc test. ko, Data are shown as box-and-whisker plots (from minimal to maximal values) and each dot represents an individual mouse. p, Percentage of suppression of conventional CD4+T cell proliferation mediated by Treg cells, as determined by flow cytometry using CellTrace Violet dilution, for peripheral (pool of splenic and lymph node) Treg cells isolated from E13.5–E15.5 pregnant Rank WT (n = 5) and Rank ΔFoxn1 (n = 3) female mice. Data are mean ± s.e.m. Two-way ANOVA, Sidak’s multiple comparisons test. q, Venn diagram showing the number of unique CDR3 nucleotide sequences identified in the TCRs of splenic Treg cells isolated from E17.5 pregnant Rank WT (n = 3) and Rank ΔFoxn1 (n = 2) females, as identified from the RNA-sequencing data using the MiXCR software. For a summary of clonal distributions see Extended Data Fig. 5g; for primary data on TCR clones see Supplementary Table 1. r, Clustered heat map showing the relative expression (z-score) of the 400 top-ranked genes of splenic Treg cells isolated from E17.5 pregnant Rank WT or Rank ΔFoxn1 mice. The initial ranking of genes is based on the maximum of the log2-transformed fold change, the absolute value and the statistical significance ranks. Rows indicate genes, columns samples (n = 3/2). s, Quantification of serum autoantibodies reactive against double-stranded DNA (dsDNA) in Rank WT (n = 9) and Rank ΔFoxn1 (n = 15) pregnant mice (from E12.5–E18.5), determined by ELISA. Values for individual mice (dots) are shown; horizontal lines are median values. Two-tailed Mann–Whitney U-test. t, Prevalence (shown as percentages) of Rank WT (n = 7–E14) and Rank ΔFoxn1 (n = 8–21) pregnant mice (from E12.5–E18.5) with detectable autoantibodies reactive towards different organs (red bars), as determined by indirect immunofluorescence shown in k. No statistically significant differences were observed between the cohorts of Rank WT and Rank ΔFoxn1 dams (two-tailed χ test; data not shown). u, Images for the detection of autoantibodies (red) by indirect immunofluorescence staining on uterus, ovaries, and placenta sections of Rag2 −/− mice using serum obtained from pregnant Rank WT and Rank ΔFoxn1 mice. Red: autoantibody staining, blue: DAPI. Serum from antibody-deficient Rag2 −/− as well as autoimmune-prone MRL/lpr females were used as negative and positive controls, respectively. Images are representative of n = 7–14 (Rank WT) and n = 8–21 (Rank ΔFoxn1) mice per tissue. All pregnancies in this figure were C57BL/6J syngeneic.
Extended Data Fig. 5
Extended Data Fig. 5. Characterization of the placental Treg cells, fetal macrosomia and glucose metabolism in pregnant Rank ΔFoxn1 mice.
a, Percentages of CD4+FOXP3+Treg cells (of total CD4+T cells) in E17.5 placentas of Rank WT and Rank ΔFoxn1 pregnant mice. Data were determined by FACS and are from individual placentas (n = 56/54) isolated from n = 11/13 dams, respectively. ***P < 0.001. Two-tailed Mann–Whitney U-test. b, c, Total numbers of thymic-derived Treg cells, as determined by neuropilin-1highHelioshigh expression (b), as well as total numbers and percentages of conventional CD4+ and CD8+T cells (c) in the E13.5–E16.5 placentas of Rank WT and Rank ΔFoxn1 pregnant mice. n = 39–76 placentas analysed from n = 8–17 dams per group. *P < 0.05. Two-tailed Mann–Whitney U-test. ac, Data are shown as box-and-whisker plots (from minimal to maximal values) and each dot represents an individual data point. d, Percentage of KI-67+CD4+FOXP3+Treg cells as well as conventional CD4+T cells in the E9.5 and E16.5 placentas of Rank WT mice. Data are mean ± s.e.m., from n = 28/10 individual E9.5 and E16.5 placentas (each dot), respectively. ***P < 0.001. One-way ANOVA, Tukey’s post hoc test. e, Percentage of KI-67+ and active CASP3+Treg cells in the E13.5–E16.5 placentas of Rank WT and Rank ΔFoxn1 mice. Data are mean ± s.e.m., from n = 34/27 (for KI-67) and n = 20/17 (Caspase3) individual placentas (each dot) analysed from n = 12/8 (KI-67) and n = 8/7 (Caspase3) Rank WT and Rank ΔFoxn1 pregnant females, respectively. *P < 0.05. Two-tailed Mann–Whitney U-test. f, Frequency of CD4+FOXP3+Treg cells and conventional CD4+T cells in the E13.5–E17.5 placentas from Rank WT and Rank ΔFoxn1 pregnant females expressing TCRVβ8.1/8.2 and TCRVα8.3 receptors, as determined by FACS analysis. The non-significant differences observed in the conventional FOXP3CD4+T cell population reinforce the thymic origin of the placental Treg cells, as opposed to a peripheral derivation from CD4+T cells. Data are mean ± s.e.m. and are from n = 61–68 (for Treg cells) and n = 36–25 (for conventional CD4+T cells) individual placentas (each dot) analysed from n = 17/17 (for Treg cells) and n = 7/11 (for conventional CD4+T cells) Rank WT and Rank ΔFoxn1 pregnant females, respectively. *P < 0.05; **P < 0.01. Two-tailed Mann–Whitney U-test. g, Distribution of TCR clonal proportions identified in thymic Treg cells isolated from non-pregnant Rank WT and Rank ΔFoxn1 females (n = 4/4), as well as in thymic (n = 3/4), splenic (n = 3/2) and placental (n = 3/3) Treg cells isolated from E17.5 pregnant Rank WT and Rank ΔFoxn1 mice. The proportions of the most abundant (top N) TCR clones by the number of next-generation sequencing reads are shown. The increased proportion of reads taken up by the top 1 to 10 (red) and 11 to 110 (orange) clones in placental Treg cells indicates a lower TCR clonal diversity compared to thymus and splenic Treg cells. h, Venn diagram showing the number of unique CDR3 nucleotide sequences identified in the TCRs of placental Treg cells isolated from E17.5 pregnant Rank WT (n = 3) and Rank ΔFoxn1 (n = 3) females. Data in g and h was determined from the RNA-sequencing data using the MiXCR software (for primary data on TCR clones see Supplementary Table 1). i, Clustered heat map showing the relative expression (z-score) of the 400 top-ranked genes of placental Treg cells isolated from E17.5 pregnant Rank WT and Rank ΔFoxn1 mice. The initial ranking of genes is based on the maximum of the log2-transformed fold change, the absolute value and the statistical significance ranks. Rows indicate genes, columns samples (n = 3/3). The genotypes, either Rank WT or Rank ΔFoxn1, are annotated for each sample at the top of the columns. j, GSEA enrichment plots of the top 3 positively as well as negatively enriched gene sets in the E17.5 placental Treg cells of Rank ΔFoxn1 versus Rank WT dams (n = 3 per group). A summary of the GSEA Hallmark gene sets enrichment analysis is shown in Supplementary Table 2. Data from gj are from sort-purified neuropilin-1highCD4+FOXP3+Treg cells. k, Number of total fetuses (viable + resorbed) gestated per Rank WT (n = 35) and Rank ΔFoxn1 (n = 31), as well as Rank WT (n = 16) and Rank ΔK5 (n = 12) individual mothers (each dot). Horizontal lines are median values. Two-tailed Mann–Whitney U-test. l, Sex distribution of viable fetuses at term (E17.5) born to Rank WT and Rank ΔFoxn1 dams. Total numbers and percentage of fetuses per sex are shown for Rank WT (n = 14) and Rank ΔFoxn1 (n = 11) dams. No significant difference was detected in fetal sex distributions between both cohorts (two-tailed χ test; data not shown). Sex was determined by PCR. m, Weight of E17.5 fetuses showing that the fetal macrosomia observed in fetuses gestated in Rank ΔFoxn1 dams is independent of the Rank ΔFoxn1 genotype of the offspring. All pregnancies were syngeneic to C57BL/6J males, thus the offspring of Rank ΔFoxn1 dams are either Rank WT wild-type (Rank flox/WT Foxn1 cre−) or Rank HET heterozygous (Rank flox/WT Foxn1 cre+) for RANK expression in the thymus; both groups are macrosomic compared to Rank WT (Rank flox/flox Foxn1 cre−) fetuses from Rank WT dams. Each dot represents an individual fetus, with n = 7–54 mice per group. Horizontal lines are mean, error bars are s.e.m. **P < 0.01; ***P < 0.001. Two-tailed Student’s t-test. n, o, Serum glucose (n; n = 42/26) and insulin (o; n = 20/13) levels in ad libitum-fed individual non-pregnant Rank WT and Rank ΔFoxn1 females. These are the littermate controls of the pregnant cohorts shown in Fig. 2e, f. n, o, Data are shown as box-and-whisker plots (from minimal to maximal values) and each dot represents an individual mouse. Two-tailed Student’s t-test (n) and two-tailed Mann–Whitney U-test (o). p, Images for the quantification of β-islet areas using the Definiens Tissue software to identify and categorize β-islets (blue) and the exocrine pancreas (green). Representative of n > 120 slides analysed. q, H&E-stained pancreas cross-sections for non–pregnant (upper panels) and E17.5 pregnant (lower panels) Rank WT and Rank ΔFoxn1 mice, depicting the expected enlargement of insulin-producing β-islets (arrows) during pregnancy, in both Rank WT and Rank ΔFoxn1 dams. Representative of n = 11–25 slides analysed per group. r, s, Relative total area of pancreatic β-islets (r) and median β-islets area (s) in non-pregnant and E17.5 pregnant Rank WT (n = 5/9) and Rank ΔFoxn1 (n = 7/13) mice, determined as shown in p (2 distal sections per mouse). *P < 0.05; **P < 0.01; ***P < 0.001. Two-tailed Student’s t-test. Data are mean ± s.e.m., each dot represents an individual data point. t, Fasting blood glucose levels in E16.5 pregnant Rank WT and Rank ΔFoxn1 mice. Data are shown as box-and-whisker plots (from minimal to maximal values) and each dot represents an individual dam, n = 12/14. Two-tailed Student’s t-test. All pregnancies in this figure were from C57BL/6J syngeneic crosses.
Extended Data Fig. 6
Extended Data Fig. 6. Characterization of Treg cells in the VAT and other tissues in pregnant Rank ΔFoxn1 mice.
a, Total numbers of neuropilin-1highHelioshighCD4+FOXP3+ cells Treg cells (indicative of thymic origin), per gram of visceral white adipose tissue (gonadal VAT) in non-pregnant (n = 11/5) and E13.5–E16.5 pregnant (n = 11/8) Rank WT and Rank ΔFoxn1 females. Data are shown as box-and-whisker plots (from minimal to maximal values) and each dot represents an individual mouse. Data were determined by FACS analysis. *P < 0.05. Two-tailed Student’s t-test. b, Percentages and total numbers of conventional CD4+ and CD8+T cells per gram of visceral white adipose tissue (gonadal VAT) in non-pregnant (n = 11/5) and E13.5–E17.5 pregnant (n = 12/8) Rank WT and Rank ΔFoxn1 females. Data are shown as box-and-whisker plots (from minimal to maximal values) and each dot represents an individual mouse. Data were determined by FACS analysis. Two-tailed Mann–Whitney U-test. c, Venn diagram showing the number of unique CDR3 nucleotide sequences identified in the TCRs of VAT (gonadal) Treg cells isolated from E17.5 pregnant Rank WT (n = 3) and Rank ΔFoxn1 (n = 2) females. d, Distribution of TCR clonal proportions identified in VAT Treg cells isolated from E17.5 pregnant Rank WT (n = 3) and Rank ΔFoxn1 (n = 2) mice. The proportions of the most abundant (top N) TCR clones by the number of next-generation sequencing reads are shown. Data from c and d were determined using the MiXCR software (for primary data on TCR clones see Supplementary Table 1). e, Clustered heat maps showing the relative expression (z-score) of the 400 top-ranked genes of VAT Treg cells isolated from E17.5 pregnant Rank WT or Rank ΔFoxn1 mice. The initial ranking of genes is based on the maximum of the log2-transformed fold change, the absolute value and the statistical significance ranks. Rows indicate genes, columns samples. The genotypes, either Rank WT (n = 3) or Rank ΔFoxn1 (n = 2), are annotated for each sample at the top of the columns. f, Summary of GSEA Hallmark gene sets enrichment analysis for the expression profiles of VAT Treg cells isolated from E17.5 pregnant Rank ΔFoxn1 (n = 2) versus Rank WT (n = 3) females. Numbers are NES and all gene sets shown are significantly enriched (defined as NES > = 1.4 and false discovery rate FDR < = 10%). Red, positively enriched gene sets in Rank ΔFoxn1; blue, positively enriched gene sets in Rank WT (the full list of gene sets is shown in Supplementary Table 3). g, Bar plot showing log2-transformed fold change of expression for cytokines and chemokines genes in VAT Treg cells isolated from E17.5 pregnant Rank ΔFoxn1 (n = 2) versus Rank WT (n = 3) mice, as determined by RNA sequencing. Red and blue denote significantly up- and downregulated genes in Rank ΔFoxn1, respectively (defined as abs(log2FC) > = 1.0 and adjusted P < = 0.1). h, Expression levels (in Fragments per Kilobase Million -FPKM) of the signature VAT Treg cells markers PPARγ and ST2 (IL-33R) in splenic and VAT Treg cells from E17.5 pregnant Rank WT (n = 3) and Rank ΔFoxn1 females (n = 2); as determined by RNA sequencing. Floating bars run from minimal to maximal values; lines are median and dots are individual mouse. i, Left, Representatives FACS histograms for ST2 expression in Treg cells from the spleen and gonadal VAT of E13.5–E16.5 Rank WT and Rank ΔFoxn1 pregnant mice. Right, Mean fluorescence intensity (MIF) of ST2 in Treg cells from gonadal VAT of non-pregnant as well as E13.5–E16.5 Rank WT (n = 11/11) and Rank ΔFoxn1 (n = 5/8) pregnant mice. Data were determined by FACS and are shown as box-and-whisker plots (from minimal to maximal values) with each dot representing an individual mouse. Kruskal–Wallis test, Dunn’s post-test. j, Percentages of CD4+FOXP3+Treg cells (of total CD4+ cells) in the uterus-draining para-aortic lymph nodes of individual non-pregnant and pregnant (pool from E12.5–E18.5) Rank WT (n = 19/26) and Rank ΔFoxn1 (n = 14/19) female mice, as determined by FACS. Data are shown as box-and-whisker plots (from minimal to maximal values) and each dot represents an individual mouse. Two-tailed Student’s t-test. k, Numbers of CD4+FOXP3+Treg cells per gram of lung and kidney of individual non-pregnant (n = 5/5) and E13.5–E15.5 pregnant (n = 5/3) Rank WT and Rank ΔFoxn1 female mice, as determined by FACS. Data are mean ± s.e.m., each dot represents an individual mouse. One-way ANOVA, Tukey’s post hoc test. l, Numbers of CD4+FOXP3+Treg cells per mm in β-islets and exocrine pancreas of E17.5 pregnant Rank WT (n = 11) and Rank ΔFoxn1 (n = 13) mice, as determined by immunohistochemistry. Data are mean ± s.e.m., each dot represents an individual mouse. Two-tailed Mann–Whitney U-test. m, Body weight increases for Rank WT or Rank ΔFoxn1 female mice (n = 4/5) fed a HFD for 47 days. Data are mean ± s.e.m. Two-way ANOVA, Sidak’s multiple comparison test. n, Liver and visceral white adipose tissue (gonadal VAT) weights in Rank WT and Rank ΔFoxn1 female mice (n = 4/5) fed a HFD for 7 weeks. Data are mean ± s.e.m., each dot represents an individual mouse. Two-tailed Student’s t-test. o, Percentages of CD4+FOXP3+Treg cells in the thymus of Rank WT (n = 4) and Rank ΔFoxn1 (n = 5) females fed a HFD for 7 weeks, as determined by FACS. Data are shown as box-and-whisker plots (from minimal to maximal values) and each dot represents an individual mouse. Two-tailed Mann–Whitney U-test. p, Oral glucose-tolerance test (mean ± s.e.m.) and the corresponding area under the curve (AUC) calculations (data are mean ± s.e.m., values for individual mice are shown) for Rank WT and Rank ΔFoxn1 females fed a HFD for 7 weeks (n = 4/5). Two-tailed Student’s t-test. q, Total numbers of CD4+FOXP3+Treg cells per gram of VAT in Rank WT and Rank ΔFoxn1 females fed a HFD for 7 weeks. Data are shown as box-and-whisker plots (from minimal to maximal values) and each dot represents an individual mouse (n = 4/5). Data were determined by FACS analysis. Two-tailed Mann–Whitney U-test. r, Serum levels of insulin in Rank WT and Rank ΔFoxn1 females fed ad libitum a HFD for 7 weeks (n = 4/5). Data are mean ± s.e.m., each dot represents an individual mouse. Two-tailed Student’s t-test.
Extended Data Fig. 7
Extended Data Fig. 7. Treg cell transplantation studies.
a, Treg-cell adoptive-transfer experimental design to assess the migration of the transplanted pregnancy-associated Treg cells into different organs. Recipient early pregnant (E3.5–E5.5) Rank WT females (no Foxp3 GFP transgene) were inoculated (intravenous inoculation) with 3 × 10 sort-purified FOXP3–GFP+CD4+neuropilin-1high Treg cells isolated from E6.5–E8.5 Rank WT Foxp3 GFP/GFP pregnant donors. b, c, Representative histograms (b) and relative percentage (c) of FOXP3–GPF+ transplanted Treg cells (of total Treg cells) in the thymus, spleen, draining (peri-uterine) lymph nodes, gonadal VAT and placentas of recipient Rank WT wild-type pregnant females 5 days after transfer, as described in a. n = 4 recipient mice and n = 26 placentas were analysed. Data are shown as box-and-whisker plots (from minimal to maximal values) and each dot represents an individual data point. ***P < 0.001 versus thymus, spleen or draining lymph nodes. One-way ANOVA, Dunnett’s post hoc test. d, Percentage of KI-67+GFP(recipients’) and KI-67+GFP+ (donors’) Treg cells in the gonadal VAT and placentas of recipient Rank WT wild-type pregnant females 5 days after transfer, as described in a. Data are mean ± s.e.m., each dot represents an individual data point from n = 4 (for VAT) and n = 26 (for placenta). *P < 0.05; ***P < 0.001. Two-tailed Mann–Whitney U-test. e, Schematics of the adoptive Treg cell transfer study used to determine which cell type migrates to the placenta (only wild-type animals were used). Since mice did not express the Foxp3 GFP transgene, Treg cells were sorted as CD4+CD25+CD45RBlow cells and conventional T CD4 cells as CD4+CD25CD45RBhigh. Treg cells of thymic origin (neuropilin-1high) were transplanted from pregnant donors into non-pregnant females (1). Vehicle-treated control pregnant recipients received only PBS (2). neuropilin-1high Treg cells isolated from pregnant (3) or non-pregnant donors (4) were transplanted into pregnant recipients. Finally, neuropilin-1low Treg cells (5) as well as conventional CD4+CD25CD45RBhigh T cells (6) were transferred from pregnant donors to recipient dams. In all cases, cells were sorted and pooled from spleen, lymph nodes and thymus of donors and transferred (intravenous inoculation, 1 × 10⁵) into early (E0.5–E2.5) pregnant mice. All recipients were euthanized 15 days post transfer (E15.5–E17.5) for FACS analysis of Treg cells in thymus, spleen and placentas shown in fi. f, g, Percentages of CD4+FOXP3+Treg cells (of total CD4+) in the thymus (f) and spleen (g) of recipient mice treated with different T cells as described in e, at the experimental end point (n = 4–3 mice per group). Data are mean ± s.e.m., each dot represents an individual mouse. *P < 0.05. Two-tailed Student’s t-test. h, Percentages of CD4+FOXP3+Treg cells (of CD4+), as well as i, neuropilin-1highHelioshigh Treg cells (of all CD4+FOXP3+Treg cells) in the E15.5–E17.5 placentas of recipient mice treated as described in e. Data are shown as box-and-whisker plots (from minimal to maximal values) and each dot represents an individual placenta. n = 10–24 individual placentas from n = 3 recipient mice were analysed per group. *P < 0.05; **P < 0.01. Two-tailed Student’s t-test versus group 3. j, Treg-cell adoptive-transfer scheme to assess whether Treg cells from non-pregnant Rank WT or from pregnant Rank ΔFoxn1 females can rescue placental Treg cell numbers and altered glucose metabolism in Rank ΔFoxn1 dams. As in the transplant study shown in Fig. 3a, thymic Treg cells were sorted and pooled from spleen, thymus and lymph nodes defined as CD4+FOXP3–GFP+neuropilin-1high Treg cells (thymic Treg cells). Both donor (E9.5) and recipient mice contained the FOXP3GFP transgene and 1 × 10⁵ Treg cells were transplanted at E.0.5–E2.5. Vehicle was PBS. k, l, Total numbers of Treg cells (k) and percentages of KI-67+Treg cells (l) in the E16.5 placentas of vehicle-treated Rank WT (2) and Rank ΔFoxn1 (3) pregnant mice, as well as E16.5 placentas of Rank ΔFoxn1 pregnant mice treated with thymic Treg cells isolated from non-pregnant Rank WT females (4) or isolated from pregnant Rank ΔFoxn1 females (5) as described in j. Data were obtained by FACS analysis and are shown as box-and-whisker plots (k, from minimal to maximal values) and bar charts (l, mean ± s.e.m.) from n = 46/25/25/32 for k, and n = 21/16/13/14 for l, individual placentas (each dot) analysed from n = 6/5/5/4 mice for groups 2 to 5 respectively. *P < 0.05. One-Way ANOVA, Dunnett’s multiple comparison test versus group 3. m, Total numbers of CD4+FOXP3+Treg cells per gram of gonadal VAT in vehicle-treated non-pregnant Rank WT females (group 1), vehicle-treated Rank WT (2) and Rank ΔFoxn1 (3) E16.5 pregnant mice, as well as Rank ΔFoxn1 E16.5 pregnant mice treated with thymic Treg cells isolated from non-pregnant Rank WT females (4) or from pregnant Rank ΔFoxn1 females (5) as described in j. Data were obtained by FACS analysis and are from n = 6/6/5/5/4 mice for groups 1 to 5, respectively. Data are shown as box-and-whisker plots (from minimal to maximal values) and each dot represents an individual mouse. *P < 0.05; **P < 0.01. Two-tailed Student’s t-test versus group 2. n, o, Oral glucose-tolerant test (n; mean ± s.e.m.) and the corresponding area under the curve calculations (o) in vehicle-treated non-pregnant Rank WT females (group 1), vehicle-treated Rank WT (2) and Rank ΔFoxn1 (3) E15.5 pregnant mice, as well as Rank ΔFoxn1 E15.5 pregnant females treated with thymic Treg cells isolated from non-pregnant Rank WT females (4) or from pregnant Rank ΔFoxn1 females (5) as described in j. n = 6/6/5/5/4 mice for groups 1–5, respectively. Lines in scatter dot plots are mean, error bars are s.e.m. *P < 0.05; **P < 0.01; ***P < 0.001. One-way ANOVA, Dunnett’s multiple comparisons test versus group 3.
Extended Data Fig. 8
Extended Data Fig. 8. Gene expression profiling and characterization of the VAT in pregnant Rank ΔFoxn1 mice.
a, b, Pairwise intersection heat map showing the numbers of differentially expressed genes in the gonadal VAT (a) as well as overlap counts (b) resulting from all pairwise comparisons of the three experimental conditions: vehicle-treated E17.5 pregnant Rank WT, as well as E17.5 Rank ΔFoxn1 pregnant females treated with either vehicle- or with sort-purified FOXP3–GFP+CD4+neuropilin-1high Treg cells isolated from Rank WT Foxp3 GFP/GFP pregnant donors (pregnancy tTreg-cell-treated). DESeq2 v.1.16.1, FDR threshold of 0.05. c, Summary of GSEA Hallmark gene sets significantly enriched (NES > = 1.4 and FDR < = 10%) comparing the expression profiles (in CPM) of the visceral (gonadal) white adipose tissue of Rank ΔFoxn1, Rank WT, and Rank ΔFoxn1 tTreg-cell-treated dams at E17.5 (n = 4 per group). NES scores are only listed for the significant sets. d, e, GSEA enrichment plots of the top positively enriched gene set: (TNF signalling via NF-κB), as well as the top negatively enriched gene set (oxidative phosphorylation) in the VAT of Rank ΔFoxn1 versus Rank WT as well as Rank ΔFoxn1 versus Rank ΔFoxn1 dams at E17.5 treated with thymic Treg cells (n = 4 per group). GSEA-derived heat maps on the right show the relative level of gene expression (red, high; blue, low) in the leading edge subset (top 20 genes shown). All mice described in this figure were treated as described in Fig. 3a. Rank ΔFoxn1 versus Rank WT dams were treated with vehicle (PBS), which for simplification is not shown in the figure. f, Total adipose tissue weights and g, median adipocyte sizes in the gonadal VAT of vehicle-treated E17.5 pregnant Rank WT mice (n = 6) as well as Rank ΔFoxn1 recipient E17.5 pregnant females treated with either vehicle (n = 5) or with sort-purified FOXP3–GFP+CD4+neuropilin-1high Treg cells isolated from Rank WT Foxp3 GFP/GFP pregnant donors (n = 6; that is, pregnancy tTreg-cell-treated). Treg-cell adoptive transfer was performed as shown in Fig. 3a. Data are mean ± s.e.m., each dot represents an individual data point. *P < 0.05; **P < 0.01; ***P < 0.001. One-way ANOVA, Dunnett’s post hoc test. h, Percentages of different adipocytes sizes in the VAT of vehicle-treated Rank WT dams (n = 6) as well as vehicle- and pregnancy tTreg-cell-treated Rank ΔFoxn1 dams at E17.5 (n = 5 and 6, respectively). *P < 0.05; other P values are shown. Two-tailed Student’s t-test. For g and h, two distal cross-sections were analysed per mouse. Data are mean ± s.e.m., each dot represents an individual data point. i, H&E cross-sections of the gonadal white adipose tissue of vehicle-treated Rank WT dams, as well as vehicle- and pregnancy tTreg-cell-treated Rank ΔFoxn1 dams at E17.5, showing markedly enlarged adipocytes in Rank ΔFoxn1 pregnant mice compared with Rank WT and pregnancy tTreg-cell-treated Rank ΔFoxn1 counterparts. Representative of n = 10–12 slides analysed from 5–6 mice per group. j, Immunohistochemistry detecting F4/80+ macrophages (arrows) in the VAT of vehicle-treated Rank WT, as well as of vehicle- and pregnancy tTreg-cell-treated Rank ΔFoxn1 dams at E17.5. Representative of n = 5–6 mice analysed. k, Percentages of F4/80+ macrophages in the VAT of non-pregnant Rank WT and Rank ΔFoxn1 females as well as vehicle-treated Rank WT and vehicle- and pregnancy tTreg-cell-treated Rank ΔFoxn1 dams at E17.5, as detected by immunohistochemistry and quantified using the Definiens Software (n = 5–6 per genotype). Data are shown as box-and-whisker plots (from minimal to maximal values) and each dot represents an individual mouse. *P < 0.05. One-way ANOVA, Tukey’s post hoc test.
Extended Data Fig. 9
Extended Data Fig. 9. Macrosomia, VAT and glucose metabolism in the offspring of Rank ΔFoxn1 dams.
a, Body weights (mean ± s.e.m.) and representative photograph (at 80 days of age) for the male offspring of Rank WT or Rank ΔFoxn1 dams (n = 16/11) fed a normal chow (NC). Data from female offspring are shown in Fig. 4a. **P < 0.01; ***P < 0.001. Two-way ANOVA, Sidak’s multiple comparison test. b, Body weights (mean ± s.e.m.) and representative photograph (taken after 6 weeks on a HFD) for the female offspring of Rank WT or Rank ΔFoxn1 dams (n = 14/12) fed a HFD. Male comparisons are shown in Fig. 4b. *P < 0.05; **P < 0.01. Two-way ANOVA, Sidak’s multiple comparison test. c, Body weights at 3 and 10 weeks of age for the different genotypes of the offspring of Rank ΔFoxn1 dams as compared to those from Rank WT dams. All pregnancies were syngeneic to C57BL/6J males, thus the offspring of Rank ΔFoxn1 dams are either Rank WT wild-type (Rank flox/WT Foxn1 cre−) or Rank HET heterozygous (Rank flox/WT Foxn1 cre+) for RANK expression in the thymus; both groups are macrosomic compared to Rank WT (Rank flox/flox Foxn1 Cre−) fetuses from Rank WT dams. Offspring of different genotypes were co-caged to minimize microbiota effects. Data are shown as box-and-whisker plots (from minimal to maximal values); dots represent individual mice, with n = 16–45 per group. *P < 0.05; **P < 0.01; ***P < 0.001. Kruskal–Wallis test, Dunn’s post-test. d, Body weights from postnatal day 1 until weaning (day 19) for pups born to Rank ΔFoxn1 dams but caged and breast-fed by Rank WT dams (n = 18), as well as the pups born to Rank WT dams but caged and breast-fed by Rank ΔFoxn1 dams (n = 21). As controls, pups born and breast-fed to Rank WT dams are shown (n = 11). Mothers were exchanged at day 1 after birth. Note the macrosomia is inherent to the pups and does not depend on mothers or breast milk-derived effects. Data are mean ± s.e.m. *P < 0.05; **P < 0.01; ***P < 0.001. Two-way ANOVA, Dunnett’s multiple comparison test. e, f, Ad libitum-fed (e) and fasting (f) serum insulin levels in male and female offspring of Rank WT and Rank ΔFoxn1 dams fed a normal chow (NC) diet for 80 days. Data are shown as box-and-whisker plots (from minimal to maximal values). Dots represent individual mice, with n = 14–24 per group. *P < 0.05. Two-tailed Mann–Whitney U-test. g, Fasting serum insulin levels in male (n = 16/11) and female (n = 15/13) offspring of Rank WT and Rank ΔFoxn1 dams fed a HFD for 9 weeks. Data are shown as box-and-whisker plots (from minimal to maximal values) and each dot represents an individual mouse. Two-tailed Mann–Whitney U-test. h, Ad libitum-fed blood glucose levels at different ages of females (n = 14–25) and males (n = 10–23) offspring of Rank WT or Rank ΔFoxn1 dams fed a normal chow (NC). Data are shown as box-and-whisker plots (from minimal to maximal values) and each dot represents an individual mouse. *P < 0.05; **P < 0.01. Two-tailed Student’s t-test. i, Fasting blood glucose levels in female (n = 18/20) and male (n = 25/16) offspring of Rank WT or Rank ΔFoxn1 dams that were fed a normal chow for 80 days. Data are shown as box-and-whisker plots (from minimal to maximal values) and each dot represents an individual mouse. *P < 0.05. Two-tailed Mann–Whitney U-test. j, k, Oral glucose-tolerance test (mean ± s.e.m.) and the corresponding area under the curve calculations for the female (j, n = 18/20) and male offspring (k, n = 25/16) of Rank WT and Rank ΔFoxn1 dams. Data are shown as box-and-whisker plots (from minimal to maximal values) and each dot represents an individual mouse, fed 80 days a normal chow diet. **P < 0.01. Two-tailed Mann–Whitney U-test. l, m, Ad libitum-fed (l) and fasting (m) blood glucose levels in male and female offspring of Rank WT and Rank ΔFoxn1 dams fed a HFD for 9 weeks. Data are shown as box-and-whisker plots (from minimal to maximal values) and each dot represents an individual mouse. n = 9–15. *P < 0.05. Two-tailed Student’s t-test. n, Percentages of CD4+FOXP3+ VAT Treg cells (of total CD4) in the gonadal white adipose tissue of the HFD-fed male and female offspring of Rank WT (n = 6/6) and Rank ΔFoxn1 (n = 6/6) dams. Mice were fed a HFD for 12 weeks. Data are shown as box-and-whisker plots (from minimal to maximal values) and each dot represents an individual mouse. ***P < 0.001. Two-tailed Student’s t-test. o, Median adipocyte sizes in the gonadal VAT of aged male and female offspring of Rank WT (n = 7/6) and Rank ΔFoxn1 (n = 9/6) dams. Data are shown as box-and-whisker plots (from minimal to maximal values) and each dot represents an individual mouse. *P < 0.05. Two-tailed Student’s t-test. p, Percentages of CD4+FOXP3+Treg cells (of total CD4) in the gonadal VAT of aged male and female offspring of Rank WT (n = 10/8) and Rank ΔFoxn1 (n = 12/9) dams. Data are shown as box-and-whisker plots (from minimal to maximal values) and each dot represents an individual mouse. **P < 0.01. Two-tailed Student’s t-test. q, Percentages of Cd11b+F4/80+ macrophages (left) as well as percentage of M1 (CD11c+CD301) and M2 (CD11cCD301+) macrophages (right, gated on Cd11b+F4/80+ macrophages) in the gonadal white adipose tissue of aged male and female offspring of Rank WT and Rank ΔFoxn1 dams. Data are shown as box-and-whisker plots (from minimal to maximal values) and each dot represents an individual mouse, with n = 6–12 per group. **P < 0.01. Two-tailed Student’s t-test. Data in oq are from individual 15–17-month-old mice, fed a normal chow since weaning.
Extended Data Fig. 10
Extended Data Fig. 10. Characterization of human patients with GDM.
a, Gestational week of delivery for control glucose-tolerant pregnant women (Ctrl) and pregnant women with GDM included in the study. All women were carrying singleton pregnancies with equal distribution of sex in each group (n = 8 carrying female and n = 8 carrying male babies). Placenta samples were collected at delivery and were also matched for gestational week and sex of the baby. Data are shown as box-and-whisker plots (from minimal to maximal values) and each dot represents an individual woman, with n = 16/16 women per group. Two-tailed Mann–Whitney U-test. b, BMI before pregnancy, at early pregnancy (<20 weeks) and at late pregnancy (36–38 weeks) for control glucose-tolerant pregnant women and pregnant women with GDM, showing matched BMI between the cohorts. Data are mean ± s.e.m. and each dot represents a woman n = 16/16. Two-tailed Student’s t-test. c, d, Fasting glucose (c) and insulin (d) levels for pregnant women diagnosed with GDM as well as control glucose-tolerant pregnant women. n = 16 per group (data are mean ± s.e.m. and each dot represents an individual woman). **P < 0.01. Two-tailed Student’s t-test. e, Plasma insulin levels (mean ± s.e.m.) and the corresponding area under the curve calculations during the 2 h oral glucose test shown in Fig. 4g, for the same pregnant women with GDM and control pregnant women. Data are shown as box-and-whisker plots (from minimal to maximal values) and each dot represents an individual woman, with n = 16 per group. *P < 0.05. two-tailed Mann–Whitney U-test. f, Homeostasis model assessment of insulin resistance (HOMA-IR) for the pregnant women with GDM as well as control glucose-tolerant pregnant women. Data are mean ± s.e.m. and each dot represents an individual woman, n = 16/16. **P < 0.01. two-tailed Student’s t-test. Data in cf were collected at early gestation (<20 weeks). Similar results were observed mid- (24–28 weeks) and late pregnancy (36–38 weeks) (data not shown). g, Birth levels of C-peptide (a by-product of insulin production in the β-islets) in the cord blood of babies born to GDM (n = 15) and control glucose-tolerant mothers (n = 15), revealing hyperinsulinaemia in the babies of mothers with GDM. Data are mean ± s.e.m. and each dot represents an individual sample. **P < 0.01. Two-tailed Student’s t-test. h, Relative expression of the Treg-cell-specific transcript FOXP3 normalized to CD4 transcript levels in the placentas of control glucose-tolerant pregnant women (n = 16) and in pregnant women with GDM (n = 16). Three distal placental tissue slices (all on the maternal side) were analysed for each woman and then averaged. Note that similar results were observed if normalized to a housekeeping gene (shown in Fig. 4i, j). Data are shown as box-and-whisker plots (from minimal to maximal values) and each dot represents an individual woman. *P < 0.05. Two-tailed Mann–Whitney U-test. i, Immunohistochemistry detecting FOXP3+Treg cells (arrows) in the placentas of control glucose-tolerant pregnant controls and women with GDM. Representative of n = 65/28 slides analysed per group. For relative quantification of the staining see Fig. 4k.
Fig. 1
Fig. 1. RANK-expressing mTECs control thymic Treg cell expansion in pregnancy.
a, AIRE and K5 staining in thymic cross-sections and relative numbers of AIRE+mTECs in Rank WT and Rank ΔFoxn1 mice (n = 4, 4–6 fields per mouse). Scale bar, 50 μm. b, Fluorescence-activated cell sorting (FACS) plots for CD4+FOXP3+Treg cells in the thymus of non-pregnant (NP), and pregnant Rank WT and Rank ΔFoxn1 mice at E12.5 and E17.5 (the gating strategy is shown in Supplementary Data 1). c, Percentages of CD4+FOXP3+Treg cells in the thymus of non-pregnant, mid-pregnant (E10.5–E12.5) and late pregnant (E16.5–E18.5) Rank WT and Rank ΔFoxn1 females (n = 10–28). d, Numbers of CD4+FOXP3+Treg cells in the thymus of Rank WT and Rank ΔFoxn1 pregnant mice at E12.5–E18.5 (n = 31/17 for Rank WT/Rank ΔFoxn1 mice, respectively. e, Rank and Aire mRNA expression in the thymic stroma of sham- or progestin-treated Rank WT female mice (n = 4). f, AIRE+mTECs in ovariectomized (Ovx, n = 7/8), and ovariectomized and progestin-treated (n = 8/11) Rank WT and Rank ΔFoxn1 female mice (5–6 fields per mouse). g, Percentages of CD4+FOXP3+ Thymic Treg cells in sham-treated (n = 11/12), progestin-treated (n = 5/4), ovariectomized (n = 5/5), and ovariectomized and progestin-treated (n = 15/16) Rank WT and Rank ΔFoxn1 female mice. h, Numbers of CD4+FOXP3+Treg cells in E17.5 placentas of Rank WT and Rank ΔFoxn1 mice. n = 59/32 placentas from n = 11/8 dams. i, Top, uterine horns of Rank WT and Rank ΔFoxn1 dams displaying placental–fetus units. Images are representative of n = 10/9. Red arrows show fetal resorption. Bottom, congested and widened spongiotrophoblast (green arrows), necrotic labyrinth (blue arrows) and trophoblast giant cells (black circles) in placental cross-sections stained with haematoxylin and eosin (images are representative of n = 29/30 placentas). Orange arrows, decidua basalis; yellow asterisks, mesometrial lymphoid aggregate of pregnancy; black asterisks, amnion cavity; orange cross, embryo. Scale bars, 1,000 μm. j, k, Prevalence (percentage of mice with at least one fetal resorption) (j) and percentages (k) of fetal resorption in Rank WT and Rank ΔFoxn1 (n = 40/40), and Rank WT and Rank ΔK5 (n = 16/13) dams at E12.5–E18.5. l, Numbers and percentages of resorbed fetuses in Rank WT and Rank ΔFoxn1 (n = 41/42), and Rank WT and Rank ΔK5 (n = 16/13) dams at E12.5–E18.5. Data are shown as bar graphs (a, k; mean ± s.e.m.), and box-and-whisker plots (ch, from minimal to maximal values. Dots represent individual data points. *P < 0.05; **P < 0.01; ***P < 0.001; NS, not significant. Two-tailed Student’s t-test (a, e); Kruskal–Wallis test with Dunn’s post-test (c); two-tailed Mann–Whitney U-test (d, h, k); one-way analysis of variance (ANOVA) with Tukey’s post hoc test (f, g); two-tailed χ 2 test (j, l).
Fig. 2
Fig. 2. Loss of Rank in mTECs augments gestational glucose intolerance.
a, Sizes of fetuses from Rank WT or Rank ΔFoxn1 mothers at E17.5. Scale bar, 10 mm. b, c, Macrosomia of E17.5 fetuses gestated in Rank ΔFoxn1 dams independent of sex (b) or litter size (c). n = 7–42 fetuses. d, Glucose levels in placentas of Rank WT and Rank ΔFoxn1 dams at E17.5 (n = 13/11 placentas from 4/5 dams). IC, ion current. e, f, Ad libitum-fed serum levels of glucose (e, n = 55/38) and insulin (f, n = 30/23) in pregnant (E12.5–E18.5) Rank WT and Rank ΔFoxn1 female mice. g, h, Oral glucose-tolerance test (mean ± s.e.m.) (g) and the corresponding area under the curve (AUC) (h) of non-pregnant (n = 6/7) and pregnant (E16.5) (n = 6/9) Rank WT and Rank ΔFoxn1 female mice. i, Total numbers of CD4+FOXP3+Treg cells in gonadal VAT of non-pregnant (n = 16/12) and pregnant (Preg, n = 19/18, E13.5–E17.5 pool) Rank WT and Rank ΔFoxn1 females. j, Uptake of 2-deoxyglucose in visceral adipose tissue of Rank WT and Rank ΔFoxn1 dams at E17.5. n = 6/5. RLU = relative luminescent units. Data are shown as bar charts, scatter dot plots (b-d, mean ± s.e.m.) and box-and-whisker plots (e,f,h-j, from minimal to maximal values). Dots represent individual data points. *P < 0.05; **P < 0.01; ***P < 0.001. Two-tailed Student’s t-test for b-e; two-tailed Mann–Whitney U-test for f,h,j; One-way ANOVA, Tukey’s post hoc for i.
Fig. 3
Fig. 3. Treg cells rescue fetal tolerance and maternal glucose metabolism.
a, Schematic of Treg cell adoptive transfer of pregnancy thymic Treg cells (Foxp3–GFP+CD4+neuropilin-1high Treg cells). For details, see Methods. b, Uterine horns of Rank ΔFoxn1 dams treated with vehicle (PBS) or pregnancy thymic Treg cells. Arrow shows fetal resorption. c, Percentages and total numbers of viable and resorpted fetuses gestated in Rank WT and Rank ΔFoxn1 pregnant mice, treated with vehicle or pregnancy thymic Treg cells. n = 8/2/6/4 dams. d, Percentage of CD4+FOXP3+Treg cells in E12.5 placentas of Rank WT and Rank ΔFoxn1 dams receiving vehicle or pregnancy thymic Treg cells. n = 14/4/9/15. eg, Oral glucose-tolerance test (mean ± s.e.m.) and corresponding area under the curve (e), numbers of CD4+FOXP3+Treg cells in gonadal VAT (f) and insulin-stimulated 2-deoxyglucose uptake and relative expression of the glucose transporter Glut4 (g) in the VAT of vehicle-treated Rank WT (n = 6) and vehicle- and pregnancy thymic Treg cell-treated Rank ΔFoxn1 (n = 5/6) dams at E16.5 (e, f) and E17.5 (g, 2 VAT samples per mouse). RLU, relative luminescent units. h, Relative expression levels of differentially expressed genes in the pairwise comparisons (DESeq2 v.1.16.1, false-discovery rate (FDR) threshold of 0.05). n = 4. i, Ccl2, Il6 and Tnf qPCR expression in VAT of vehicle-treated Rank WT (n = 6) and vehicle- and pregnancy thymic Treg cell-treated Rank ΔFoxn1 (n = 5/6) dams at E17.5 (3 VAT samples per mouse). j, Body weights of pups, born to the indicated mothers, at perinatal and weaning ages (n = 12/14/17). Data are shown as scatter dot plots (d, lines are median), bar charts (i, mean ± s.e.m.) and box-and-whisker plots (eg, j, from minimal to maximal values. Dots represent individual data points. *P < 0.05; **P < 0.01; ***P < 0.001. Two-tailed χ 2 test (c); Student’s t-test (d, f, g); two-tailed Mann–Whitney U-test (i); Kruskal–Wallis test with Dunn’s post-test (e); one-way ANOVA with Tukey’s post hoc test (j).
Fig. 4
Fig. 4. Transgenerational metabolic disorders in the offspring of Rank ΔFoxn1 mothers.
a, Body weights (mean ± s.e.m.) of the female offspring of Rank WT and Rank ΔFoxn1 dams (n = 15 and 14) fed normal chow. Image, 80-day-old mice. b, Photograph (6 weeks on HFD) and body weights (mean ± s.e.m.) of male offspring of Rank WT and Rank ΔFoxn1 dams (n = 16/11) fed an HFD. ce, Ad libitum-fed serum insulin levels in female (n = 15/14) and male (n = 17/13) offspring of Rank WT and Rank ΔFoxn1dams (c), oral glucose-tolerance test (mean ± s.e.m.) (d) and area under the curve (e) for female (n = 14/10) and male (n = 14/11) offspring of Rank WT and Rank ΔFoxn1 dams fed a HFD for 9 weeks. f, Median β-islets area in female (n = 12/12) and male (n = 13/13) offspring of Rank WT and Rank ΔFoxn1 dams on HFD for 12 weeks. g, Oral glucose-tolerance test (mean ± s.e.m.) and area under the curve for pregnant women with gestational diabetes mellitus (GDM) and a glucose-tolerant pregnant control group (control). n = 16/16. h, Birth weights of babies born to mothers with gestational diabetes and control mothers (n = 16/16). i, FOXP3 transcripts in the placentas of control pregnant women and pregnant women with gestational diabetes (n = 16/16). j, FOXP3 transcripts in the placentas of control pregnant women and pregnant women with gestational diabetes treated with a controlled diet or by administration of insulin (mean ± s.e.m., n = 16/8/8). k, FOXP3+Treg cells in the placentas (maternal side) of control pregnant women and pregnant women with gestational diabetes (n = 17/8) detected by immunohistochemistry (2–3 sites per placenta). Data in c, ei, k are shown as box-and-whisker plots (from minimal to maximal values). Dots represent individual data points. *P < 0.05; **P < 0.01; ***P < 0.001. Two-way ANOVA with Sidak’s multiple comparison (a, b); two-tailed Mann–Whitney U-test (c, e, g, ik); two-tailed Student’s t-test (f, h).

References

    1. Soma-Pillay P, Nelson-Piercy C, Tolppanen H, Mebazaa A. Physiological changes in pregnancy. Cardiovasc J Afr. 2016;27:89–94. - PMC - PubMed
    1. Arck PC, Hecher K. Fetomaternal immune cross-talk and its consequences for maternal and offspring’s health. Nat Med. 2013;19:548–556. - PubMed
    1. Persike EC., Jr Involution of the thymus during pregnancy in young mice. Proc Soc Exp Biol Med. 1940;45:315–317.
    1. Dougall WC, et al. RANK is essential for osteoclast and lymph node development. Genes Dev. 1999;13:2412–2424. - PMC - PubMed
    1. Kong Y-Y, et al. OPGL is a key regulator of osteoclastogenesis, lymphocyte development and lymph-node organogenesis. Nature. 1999;397:315–323. - PubMed

Publication types

MeSH terms

Substances