. 2021 Feb;590(7846):498-503.
doi: 10.1038/s41586-020-03069-8. Epub 2020 Dec 23.

Molecular basis of nucleosomal H3K36 methylation by NSD methyltransferases

Affiliations

Molecular basis of nucleosomal H3K36 methylation by NSD methyltransferases

Wanqiu Li et al. Nature. 2021 Feb.

Abstract

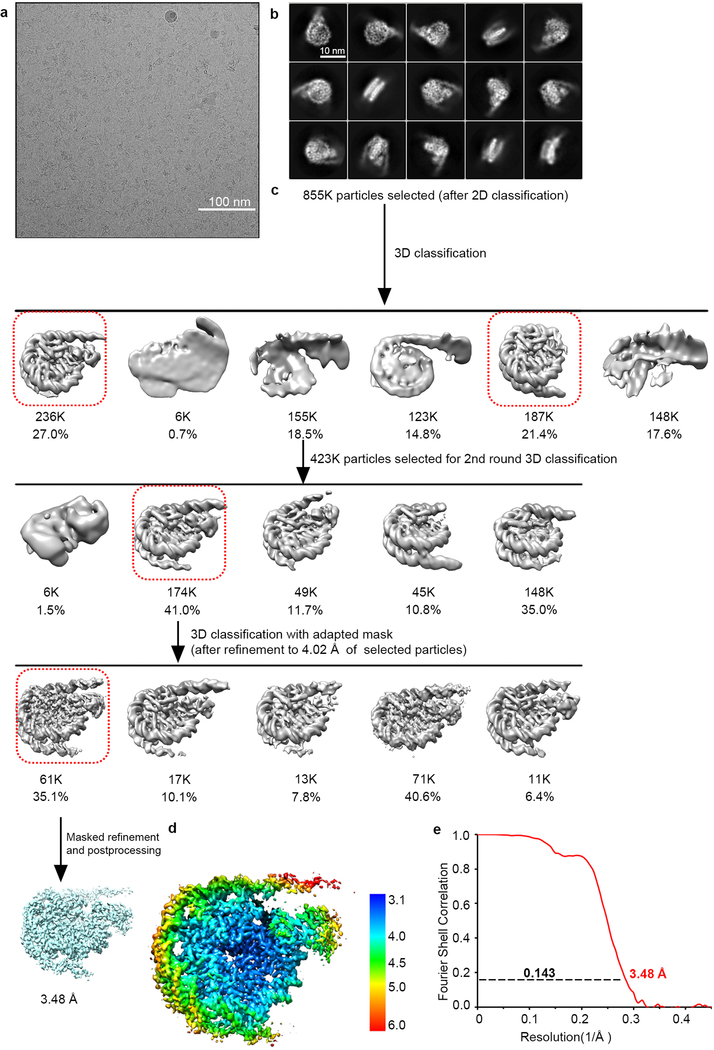
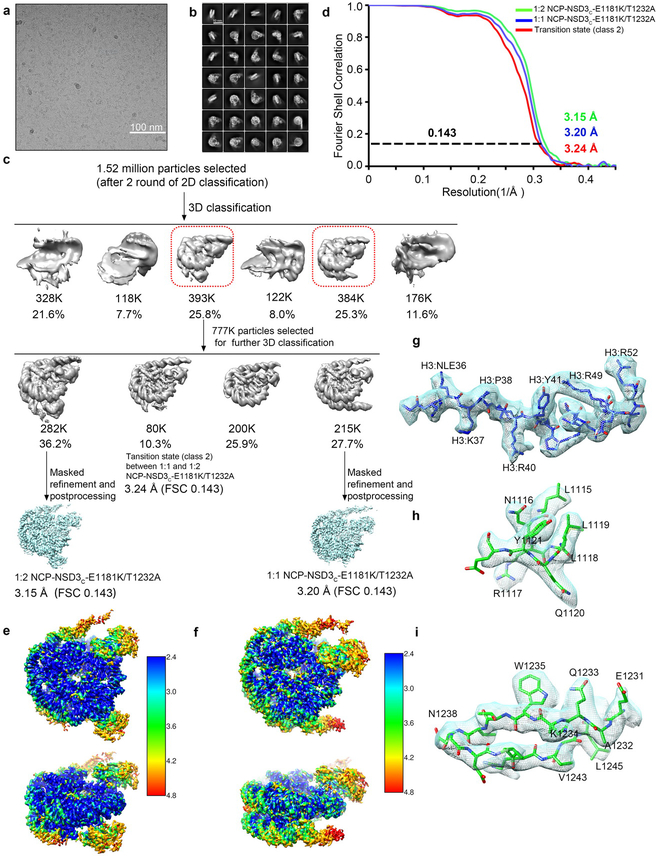
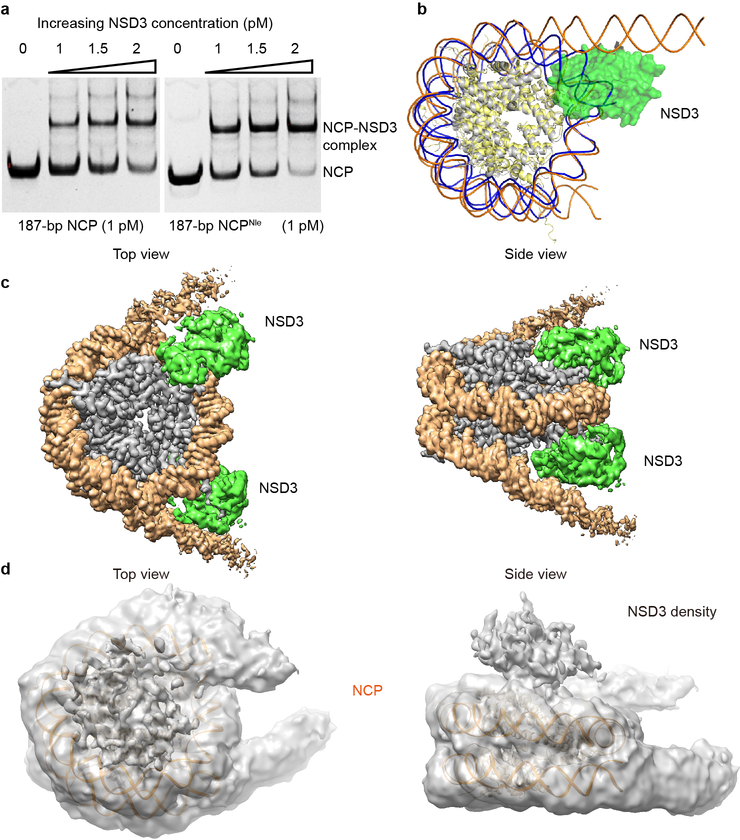
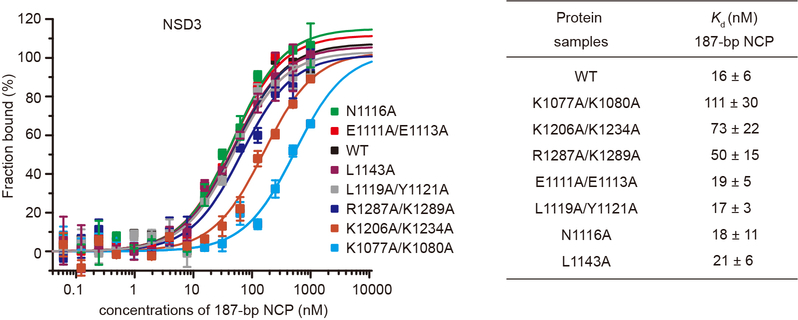
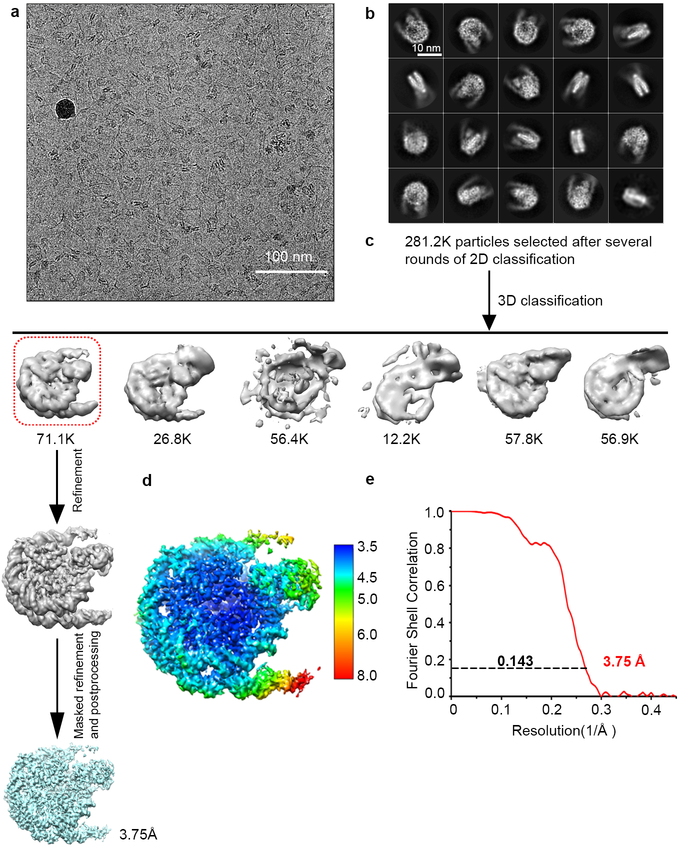
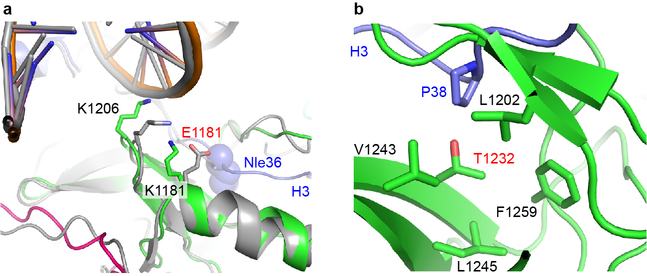
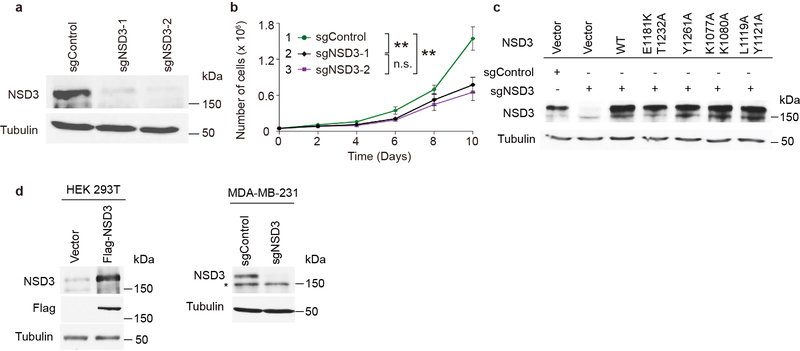
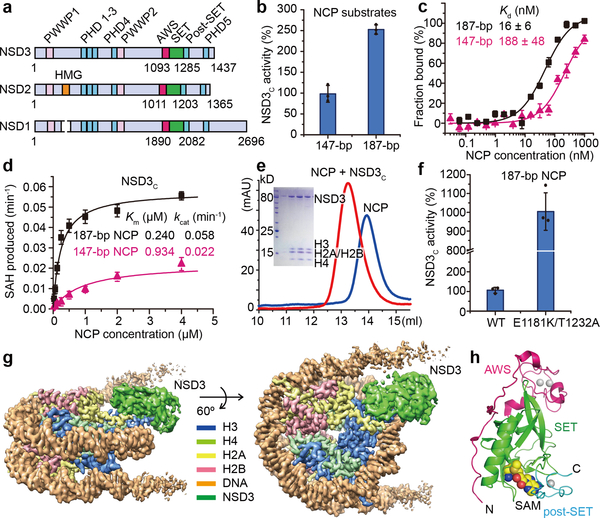
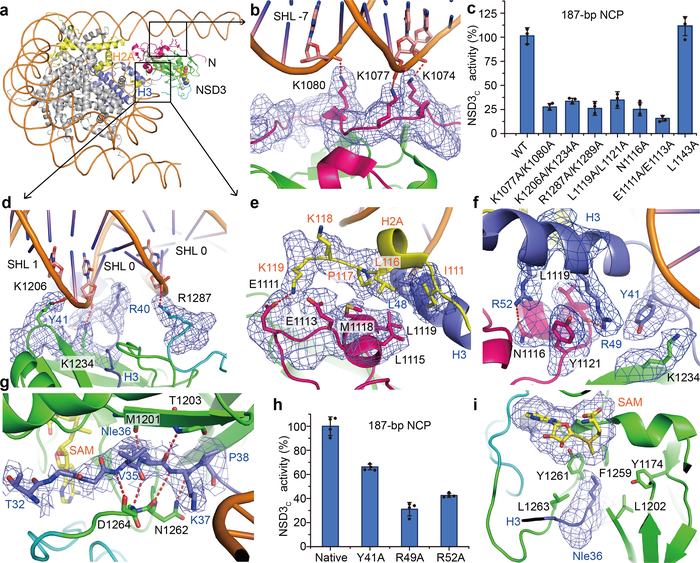
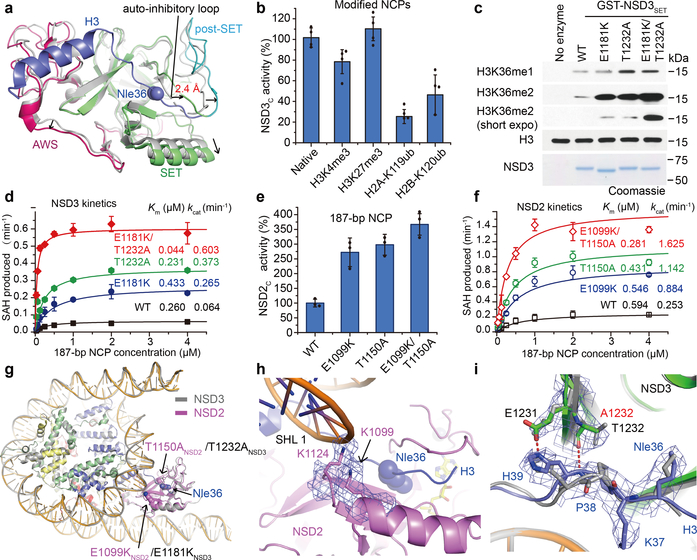
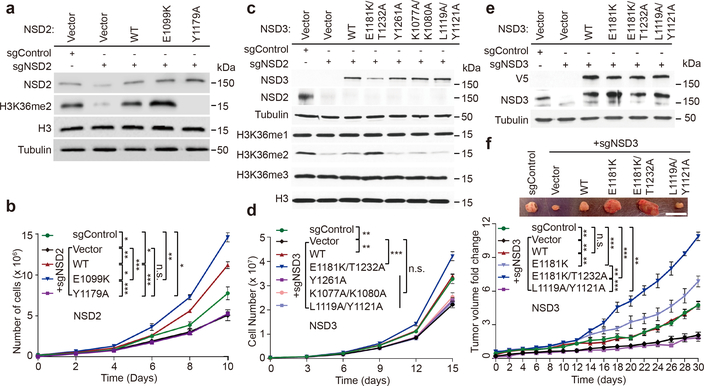
Histone methyltransferases of the nuclear receptor-binding SET domain protein (NSD) family, including NSD1, NSD2 and NSD3, have crucial roles in chromatin regulation and are implicated in oncogenesis1,2. NSD enzymes exhibit an autoinhibitory state that is relieved by binding to nucleosomes, enabling dimethylation of histone H3 at Lys36 (H3K36)3-7. However, the molecular basis that underlies this mechanism is largely unknown. Here we solve the cryo-electron microscopy structures of NSD2 and NSD3 bound to mononucleosomes. We find that binding of NSD2 and NSD3 to mononucleosomes causes DNA near the linker region to unwrap, which facilitates insertion of the catalytic core between the histone octamer and the unwrapped segment of DNA. A network of DNA- and histone-specific contacts between NSD2 or NSD3 and the nucleosome precisely defines the position of the enzyme on the nucleosome, explaining the specificity of methylation to H3K36. Intermolecular contacts between NSD proteins and nucleosomes are altered by several recurrent cancer-associated mutations in NSD2 and NSD3. NSDs that contain these mutations are catalytically hyperactive in vitro and in cells, and their ectopic expression promotes the proliferation of cancer cells and the growth of xenograft tumours. Together, our research provides molecular insights into the nucleosome-based recognition and histone-modification mechanisms of NSD2 and NSD3, which could lead to strategies for therapeutic targeting of proteins of the NSD family.


Figures

Extended Data Fig. 1 |
Cryo-EM structural analysis of the native NSD3C bound to 187-bp NCP. a, A representative cryo-EM micrograph from a total 2511 micrographs of the NCP-NSD3C complex (low-pass filtered to 20 Å). Scale bar, 100 nm. b, Selected 2D class averages of the NCP-NSD3C complex. Scale bar, 10 nm. Box size 216, pixel size 1.08 Å. c, Workflow of the NCP-NSD3C complex image processing procedures. It includes several rounds of 2D and 3D classification, refinement and masked refinement. The linker DNA is highly flexible, thus, it is invisible when the density map was shown in high resolution. d, Local resolution map of the NCP-NSD3C complex final density map. e, FSC curve of the NCP-NSD3C complex final density map.
Extended Data Fig. 2 |
Cryo-EM structural analysis of the NSD3C bearing E1181K/T1232A dual mutation in complex with 187-bp NCP. a, A representative cryo-EM micrograph from a total 3625 micrographs of the NCP-NSD3C-E1181K/T1232A complex (low-pass filtered to 20 Å). Scale bar, 100 nm. b, c, Selected 2D class averages (b), scale bar 10 nm, box size 108, pixel size 2.16 Å. Workflow of the NCP-NSD3C-E1181K/T1232A complex image processing procedures (c). It includes several rounds of 2D and 3D classification, refinement and masked refinement. As the linker DNA is highly flexible, it is invisible when the density map was shown at a high contour level. d, FSC curves of the NCP-NSD3C-E1181K/T1232A complex in different binding states. e, Local resolution map of the 1:2 NCP-NSD3C-E1181K/T1232A complex final density map. f, Local resolution map of the 1:1 NCP-NSD3C-E1181K/T1232A complex final density map. g-I, Local density map of representative regions of the final cryo-EM density map, for H3 tail (g), NSD3 AWS domain (h), and NSD3 SET domain (i).
Extended Data Fig. 3 |
EMSA and structural analysis of NSD3C with 187-bp NCPs. a, EMSA analysis of NSD3C with native or Nle-labeled187-bp NCPs. The concentrations of added NSD3C are indicated above the lanes. The results were repeated from at least three independent experiments. For gel source data, see Supplementary Fig. 1. b, Superimposition of the 1:1 NSD3-NCP complex with an apo NCP (PDB ID: 1AOI). Histone proteins and the wrapped DNA in apo NCP are colored in yellow and blue, respectively. Histone proteins and the nucleosomal DNA in the NSD3-binding NCP are colored in grey and orange, respectively. NSD3 is colored in green. c, Top (left) and side (right) views of the sharpened cryo-EM density map of the 1:2 NCP-NSD3C-E1181K/T1232A complex (contour at 3σ level). NSD3 is colored in green. NCP DNA and histone proteins are colored in orange and grey, respectively. d, Top (left) and side (right) views of the inactive state of the NSD3C-NCP complex. 146-bp NCP structure (PDB code 1AOI) was docked into the density of the 187-bp NCP. The cryo-EM density map was colored in grey and contoured at 1.5σ lever. Additional densities that lay on the top of the nucleosome disk were densities of NSD3.
Extended Data Fig. 4 |
MST-based analysis of wild-type (WT) and mutants of NSD3 for 187-bp NCPs. Left, MST-binding curves of wild-type and mutants of NSD3 for 187-bp NCPs. Right, dissociation constants (Kd) derived from left curves. Data are represented as means ± s.d. from n = 3 biological independent samples.
Extended Data Fig. 5 |
Cryo-EM structural analysis of NSD2 bearing E1099K/T1150A dual mutation in complex with 187-bp NCP. a, A representative cryo-EM micrograph from a total 1388 micrographs of the NCP-NSD2C-E1099K/T1150A complex (low-pass filtered to 20 Å). Scale bar, 100 nm. b, c, Selected 2D class averages (b), scale bar 10 nm, box size 216, pixel size 1.08 Å, and workflow of the NCP-NSD2C-E1099K/T1150A complex image processing procedures (c). d, Local resolution map of the NCP-NSD2C-E1099K/T1150A complex final density map. e, FSC curve of the NCP-NSD2C-E1099K/T1150A complex.
Extended Data Fig. 6 |
E1181 and T1232 sites of NSD3 in the structure of the NSD3-NCP complex. a, Comparisons of the structural differences between the superimposed NCP-bound wild-type NSD3 (colored in grey) and E1181K-mutated (colored as described above) NSD3. b, The side-chain of Thr1232 in native NSD3 is inserted into a hydrophobic pocket composed of hydrophobic residues from both NSD3 and histone H3.
Extended Data Fig. 7 |
Proliferation of HNSCC cell line UD-SCC-2 cells is dependent on NSD3. a, Western analysis with indicated antibodies of whole cell lysates from wild-type or NSD3 depleted UD-SCC-2 cells as indicated. All data were reproduced from three independent experiments. b, Cell proliferation rates of UD-SCC-2 cells expressing CRISPR-Cas9 and two independent NSD3 sgRNAs or a control sgRNA. Data are represented as means ± s.d. from n = 3 biological independent samples. **p < 0.01, n.s., not significant, two-tailed unpaired Student’s t test. Cell lines were numbered as the following: 1. sgControl, 2. sgNSD3–1, 3. sgNSD3–2. P values between the cells are: p (1 vs. 2) = 0.0046, p (1 vs. 3) = 0.0029, p (2 vs. 3) = 0.3249. c, Western analysis of NSD3-depleted UD-SCC-2 cells complemented with structure-guided NSD3 derivatives. All data were reproduced by three independent experiments. d, Validation of NSD3 antibody specificity. Left panel: transient expression of either vector alone or Flag-tagged NSD3 in HEK 293T cells. Right panel: CRISPR-cas9 mediated knockdown of either control or NSD3 in MDA-MB-231 cells. Whole cells lysates were blotted with indicated antibodies. *, non-specific band. All data were reproduced by three independent experiments. For gel-source data, see Supplementary Fig. 1.
Fig. 1 |
Fig. 1 |
Biochemical analysis of NSD3 and the overall structure of the NSD3-E1181K/T1232A-NCP complex. a, Domain architecture of the NSD family proteins. b, Catalytic activities of NSD3C on 147-bp and 187-bp NCPs measured through an in vitro methylation method. Signals for 147-bp NCP were set as 100%. c, MST-based binding curves of NSD3C with 147-bp and 187-bp NCPs. d, Michaelis-Menten titrations of NSD3 with147-bp and 187-bp NCPs. e, Gel-filtration profiles of NCPs with or without bound NSD3C. SDS-PAGE gel is shown as an insert. For gel source data, see Supplementary Fig. 1. The experiment has been repeated at least three times with similar results. f, Catalytic activities of wild-type (WT) NSD3C and its E1181K/T1232A mutant on 187-bp NCPs measured through an in vitro methylation method. g, Side (left) and top (right) views of the sharpened cryo-EM density map of the 1:1 NSD3-NCP complex (contour at 3σ level). H3, H4, H2A, H2B, DNA and NSD3 are colored in blue, lime green, yellow, red, orange and grass green, respectively. h, Domain architecture of the AWS, SET and post-SET domains of NSD3, which are colored in magenta, green and cyan, respectively. Data in panels b, c, d and f are represented as means ± s.d. from n = 3 independent samples.
Fig. 2 |
Fig. 2 |
Details of intermolecular contacts between NSD3-E1181K/T1232A and the nucleosome. a, An overview of the contacts between NSD3 and nucleosomal DNA. NSD3 domains are colored as in Fig.1h. Histone H3 and H2A are colored in blue and yellow, respectively. b, The N-terminal loop of NSD3 interacts with the phosphate backbone of the minor groove at SHL −7. c, Relative catalytic activities of the wild-type (WT) and various mutants of NSD3 on 187-bp NCPs. Activity of the WT NSD3 was set to 100%. d, NSD3 SET and post-SET domains interact with the phosphate backbone of the DNA minor groove at SHLs 1 and 0, respectively. e, NSD3 recognizes the C-terminal region of H2A. f, NSD3 recognizes the N-terminal helix of H3. g, NSD3-SET domain recognizes the N-terminal tail of H3. h, NSD3C showed reduced activities on NCPs bearing mutations on NSD3-interacting residues of H3. i, Nle36 binding pocket in NSD3 SET domain. Data are represented as means ± s.d. from n = 3 (panel c) or n = 4 (panel h) independent samples. The cryo-EM density maps of key residues were contoured at 2σ (panels b and g) or 4σ (panels d, e, f and i) level. Red dotted lines in panels b, d, e, f and g indicate salt bridges or hydrogen bonds.
Fig. 3 |
Fig. 3 |
Structural and biochemical analysis of NSD2/3 and their cancer-related mutations. a, Superimposition of the auto-inhibitory structure of the NSD3 catalytic region (PDB ID: 5UPD, colored in grey) with the active NCP-bound NSD3 (colored as described previously). Directions of shifted regions of NCP-bound NSD3 are indicated with black arrows. b, Catalytic activities of NSD3C with NCPs bearing modifications. c, In vitro methylation reactions of wild-type (WT) or mutant NSD3SET on NCPs with non-radiolabeled SAM. No enzyme is used as a negative control. Top panel, Western blots of the reaction products with the indicated antibodies. H3 is shown as a loading control. Bottom panel, Coomassie blue staining of NSD3 proteins. Three independent experiments were done with similar results. For gel source data, see Supplementary Fig. 1. d, Michaelis-Menten titrations of wild-type (WT), E1181K, T1232A, or both E1181K and T1232A mutated NSD3C with 187-bp NCPs. e, Catalytic activities of wild-type (WT) and several cancer-related mutations of NSD2 with 187-bp NCPs. f, Michaelis-Menten titrations of wild-type (WT), E1099K, T1150A, or both E1099K and T1150A mutated NSD2 with 187-bp NCPs. g, Overlapped NCP-bound structures of NSD2 (colored in pink) and NSD3 (colored in grey). Positions of E1099K and T1150A mutations in NSD2, and their corresponding E1181K and T1232A mutations in NSD3 are indicated with black arrows. h, A zoomed view of the E1099K mutation site in the NSD2-NCP complex. i, Comparison of the structural differences between the superimposed NCP-bound native NSD3 (colored in grey) and the T1232A-mutated NSD3 (colored as described above). Data are presented at means ± s.d. from n = 4 (panel b) or n = 3 (panels d, e and f) independent samples. The cryo-EM density maps of key residues in panels h and i are contoured at 4σ level.
Fig. 4 |
Fig. 4 |
Regulation of cancer cell phenotypes by NSD2/3 catalytic activity. a, b, NSD2 enzymatic activity is required for NSD2-dependent proliferation of human bone osteosarcoma cells (U2OS). (a) Western analysis and (b) cell growth rates of control or NSD2-depleted U2OS cells complemented with CRISPR-resistant wild-type NSD2 (WT), enzymatically hyperactive NSD2 (E1099K), enzymatically inactive NSD2 (Y1179A), or vector are shown. *p<0.05, **p < 0.01, ***p < 0.001, n.s., not significant, two-tailed unpaired Student’s t test. c, Structure-guided NSD3 mutations regulate H3K36me2 generation in cells. Western analysis with the indicated antibodies of whole cell lysates from NSD2-deficient HT1080 cells (to deplete endogenous global H3K36me2 levels) expressing NSD3 wild-type or mutant proteins as indicated. Whole cell lysate without NSD2 depletion is shown as a control. Vector: control transfection. d, NSD3 enzymatic activity regulates NSD3-dependent proliferation in Head and Neck Squamous Cell Carcinoma (HNSCC) cells. Cell proliferation rates of NSD3-depleted UD-SCC-2 HNSCC cells complemented with the indicated NSD3 derivatives. Vector alone and control knockdowns are shown as controls. **p < 0.01, ***p < 0.001, n.s., not significant, two-tailed unpaired Student’s t test. e, f, Hyperactive NSD3 catalytic activity promotes NSD3-dependent xenograft tumor growth in HNSCC cells. (e) Western analysis and (f) xenograft tumor growth rates of control or NSD3-depleted UD-SCC-2 cells complemented with the indicated CRISPR-resistant NSD3 constructs (n = 5 mice, for each treatment group). Top panel: Macroscopic picture of representative tumors from each of the six groups are shown. Scale bar, 1.5 cm. Bottom panel: Tumor growth measurements, analysis, **p < 0.002; ***p < 0.0001, n.s., not significant by two-way ANOVA with Tukey’s testing for multiple comparisons. Data are represented as means ± s.d. from n = 3 biological independent samples in panels b and d, or n = 5 biological independent mice. For detailed p values in panel b, d and f, see Methods section. For panels a, c and e, similar results were observed from three independent experiments. For gel source data, see Supplementary Fig. 1.

Comment in

References

    1. Husmann D & Gozani O Histone lysine methyltransferases in biology and disease. Nat Struct Mol Biol 26, 880–889, doi:10.1038/s41594-019-0298-7 (2019). - DOI - PMC - PubMed
    1. Bennett RL, Swaroop A, Troche C & Licht JD The Role of Nuclear Receptor-Binding SET Domain Family Histone Lysine Methyltransferases in Cancer. Cold Spring Harb Perspect Med 7, doi:10.1101/cshperspect.a026708 (2017). - DOI - PMC - PubMed
    1. Kuo AJ et al. NSD2 links dimethylation of histone H3 at lysine 36 to oncogenic programming. Mol Cell 44, 609–620, doi:10.1016/j.molcel.2011.08.042 (2011). - DOI - PMC - PubMed
    1. Li Y et al. The target of the NSD family of histone lysine methyltransferases depends on the nature of the substrate. J Biol Chem 284, 34283–34295, doi:10.1074/jbc.M109.034462 (2009). - DOI - PMC - PubMed
    1. Morrison MJ et al. Identification of a peptide inhibitor for the histone methyltransferase WHSC1. PLoS One 13, e0197082, doi:10.1371/journal.pone.0197082 (2018). - DOI - PMC - PubMed

Publication types

MeSH terms